. 2022 Aug;27(8):3520-3531.
doi: 10.1038/s41380-021-01174-2. Epub 2021 Jun 28.

Atypical perineuronal nets in the CA2 region interfere with social memory in a mouse model of social dysfunction

Affiliations

Atypical perineuronal nets in the CA2 region interfere with social memory in a mouse model of social dysfunction

Elise C Cope et al. Mol Psychiatry. 2022 Aug.

Erratum in

Abstract

Social memory dysfunction is an especially devastating symptom of many neuropsychiatric disorders, which makes understanding the cellular and molecular processes that contribute to such abnormalities important. Evidence suggests that the hippocampus, particularly the CA2 region, plays an important role in social memory. We sought to identify potential mechanisms of social memory dysfunction in the hippocampus by investigating features of neurons, glia, and the extracellular matrix (ECM) of BTBR mice, an inbred mouse strain with deficient social memory. The CA2 is known to receive inputs from dentate gyrus adult-born granule cells (abGCs), neurons known to participate in social memory, so we examined this cell population and found fewer abGCs, as well as fewer axons from abGCs in the CA2 of BTBR mice compared to controls. We also found that BTBR mice had fewer pyramidal cell dendritic spines, in addition to fewer microglia and astrocytes, in the CA2 compared to controls. Along with diminished neuronal and glial elements, we found atypical perineuronal nets (PNNs), specialized ECM structures that regulate plasticity, in the CA2 of BTBR mice. By diminishing PNNs in the CA2 of BTBR mice to control levels, we observed a partial restoration of social memory. Our findings suggest that the CA2 region of BTBR mice exhibits multiple cellular and extracellular abnormalities and identify atypical PNNs as one mechanism producing social memory dysfunction, although the contribution of reduced abGC afferents, pyramidal cell dendritic spine, and glial cell numbers remains unexplored.


Conflict of interest statement

Conflicts of Interest

Authors declare that they have no conflict of interest.

Figures

Figure 1.
Figure 1.. BTBR mice have impairments in sociability and social memory.
A. Left: Control mice display a preference for a social over nonsocial stimulus while BTBR mice show no such preference in the 3-chamber test. Control mice spent more time investigating a cagemate than a novel object and BTBR mice spent equal times investigating both stimuli (two-way ANOVA, strain: F(1,42) = 0.1097, p = 0.7422, chamber: F(1,42) = 9.106, p = 0.0043, strain X chamber: F(1,42) = 7.756, p = 0.0080). *p < 0.05 compared to cagemate. Right: BTBR mice have lower difference scores (cagemate – object) compared to controls (unpaired t-test, t21 = 2.25, p = 0.035). n = 11 for controls and n = 12 for BTBR. *p < 0.05 compared to controls. B. Left: Control mice display robust social memory while BTBR mice exhibit no evidence of social memory in the 3-chamber social novelty test (two-way ANOVA, strain: F(1,44) = 42.50, p < 0.0001, chamber: F(1,44) = 48.86, p < 0.0001, strain X chamber: F(1,44) = 22.86, p < 0.0001). *p < 0.05 compared to novel. Right: BTBR mice have lower difference scores (novel – cagemate) compared to controls (unpaired t-test, t22 =4.62, p = 0.00013). n = 12 for both groups. *p < 0.05 compared to controls. C. Left: Control mice show evidence of social memory while BTBR mice display no such evidence in the novel to familiar direct social interaction test (two-way repeated measures ANOVA, trial: F(1,28) = 18.56, p = 0.0002, strain: F(1,28) = 37.70, p < 0.0001, trial X strain: F(1,28) = 7.29, p = 0.012). *p < 0.05 control novel to familiar. Right: BTBR mice have lower difference scores (novel – familiar) compared to controls (Mann-Whitney test, U28 = 49, p = 0.0075). *p < 0.05 compared to controls. D. Left: Neither control nor BTBR mice decrease their investigation times for a new, novel mouse in the novel to novel direct social interaction test (two-way repeated measures ANOVA, trial: F(1,28) = 0.0398, p = 0.8433, strain: F(1,28) = 8.443, p = 0.0071, trial X strain: F(1,28) = 0.000746, p = 0.9784). Right: There was no change between groups in difference scores (novel 1 – novel 2) (unpaired t-test, t28 = 0.02732, p = 0.9784). *p < 0.05 compared to controls. For panels C and D, n = 15 for both groups. Error bars represent SEM. See Supplementary Table 2 for complete statistics.
Figure 2.
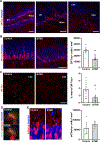
Figure 2.. BTBR mice have fewer mossy fibers from abGCs to the CA2.
A. Image of the dorsal DG immunolabeled with new neuron marker 3R-Tau (red) and counterstained with Hoechst (blue) in a control mouse (left). Scale bar = 100 μm. Dorsal DG labeled with 3R-Tau+ abGCs and their mossy fiber projections in a control (middle). Scale bar = 25 μm. 3R-Tau+ mossy fiber labeling in the CA2 of a control (right). Scale bar = 50 μm. B. Dorsal DG immunolabeled with abGC marker 3R-Tau (red) and counterstained with Hoechst (blue) in control and BTBR mice (left). Scale bar = 25 μm. BTBR mice have fewer 3R-Tau+ abGCs in the dorsal DG compared to controls (unpaired t-test, t16 = 4.73, p = 0.00023) (right). C. The CA2 labeled with 3R-Tau+ fibers (red) in control and BTBR mice (left). Scale bar = 50 μm. BTBR mice have less 3R-Tau+ in the CA2 (Mann-Whitney test, U16 = 14, p = 0.019) (right). For panels B and C, n = 9 for each group. D. CA2 of control and BTBR injected with AAV2-retro (mCherry, red) into the CA2 (PCP4, red). Scale bar = 100 μm. E. The DG of control and BTBR showing mCherry+ labeled granule cells after injection with AAV2-retro in the CA2. Scale bar = 10 μm. Similar expression of mCherry+ was observed in granule cells of control and BTBR mice, with no significant differences detected in the density of mCherry+ granule cells divided by the volume of the CA2 injection site (Mann-Whitney test, U6 = 3, p = 0.700) (right). Error bars represent SEM. *p <0.05 compared to controls.
Figure 3.
Figure 3.. BTBR mice have a smaller CA2 region as well as fewer pyramidal cell dendritic spines, microglia, and astrocytes.
A. Images of the CA2 from control and BTBR mice immunolabeled with the CA2 marker PCP4 (red) (left). Scale bar = 100 μm. BTBR mice have a smaller CA2 compared to controls (unpaired t-test, t14 = 2.22, p = 0.043) (right). n = 8 for each group. B. Apical and basal dendritic segments from CA2 pyramidal neurons labeled with DiI in control and BTBR mice (left). Scale bar = 2.5 μm. BTBR mice have reduced dendritic spine density on apical and basal dendrites of CA2 neurons (linear mixed effects model, apical: t45 = −5.088, p = 0.0002, basal: t43 = 3.355, p = 0.0017) (right). n = 6 for each group. C. Microglia labeled with iba1 (red) in the CA2 of control and BTBR mice (left). BTBR mice have a lower density of iba1+ microglia in the CA2 compared to controls (unpaired t-test, t17 = 3.40, p = 0.0034) (right). D. Astrocytes labeled with GFAP (red) in the CA2 of control and BTBR mice (left). BTBR mice have lower density of GFAP+ astrocytes in the CA2 compared to controls (unpaired t-test, t17 = 8.068, p < 0.0001) (right). For panels C and D, n = 9 for controls and n = 10 for BTBR. Scale bars = 25 μm. Error bars represent SEM. *p < 0.05 compared to controls.
Figure 4.
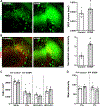
Figure 4.. BTBR mice have greater WFA+ volume and intensity in the CA2 but not the vCA1.
A. Images of the CA2 labeled with the PNN marker WFA (green) in control and BTBR mice (left). BTBR mice have greater WFA+ volume in the CA2 compared to controls (unpaired t-test, t14 = 2.75, p = 0.016) (right). B. Images of PCP4 (red) and WFA (green) in the CA2 from control and BTBR mice (left). BTBR mice have increased mean intensity of WFA in the CA2 compared to controls (unpaired t-test, t14 = 11.56, p < 0.0001) (right). Due to the exceedingly high intensity of WFA staining in the BTBR CA2, mean intensity values were normalized to control. For panels A and B, n = 8 for each group. Images shown are confocal projections made from multiple optical sections through the z plane combined to produce a single 2D image (see Supplementary Figure 2 for example optical sections demonstrating perineuronal staining of WFA in BTBR CA2). C. No differences in the numbers of WFA+ cells, PV+ cells, or WFA+PV+ cells were observed in the vCA1 between control and BTBR mice. D. No difference in WFA intensity was observed surrounding PV+ or PV- cells in the vCA1 between control and BTBR mice. For panels C and D, n = 8 for control and n = 7 for BTBR. Scale bars = 100 μm. Error bars represent SEM. *p < 0.05 compared to controls. See Supplementary Table 3 for complete statistics.
Figure 5.
Figure 5.. Reducing CA2 PNNs in control mice impairs social memory, while reducing PNNs in BTBR mice to control values partially rescues social memory impairment.
A. Timeline of experiment. Control and BTBR mice were injected with either PNase or chABC in the CA2, tested for social memory at 5 days (control mice) or 10 days (control and BTBR mice) later. B. Schematic of 3-trial social memory test. C. chABC impairs social memory (two-way repeated measures ANOVA, trial: F(2,36) = 11.90, p = 0.0001; drug: F(1,18) = 2.757, p = 0.1142; trial X drug: F(2,36) = 2.593, p = 0.0 87). *p < 0.05 Control PNase novel 1 to familiar. D. chABC-treated control mice have lower difference scores (novel 1 – familiar) compared to PNase-treated mice (Mann-Whitney test, U18 = 21, p = 0.0288). *p < 0.05 compared to controls. E. There was no significant change between groups in difference scores (familiar – novel 2) (unpaired t-test, t18 = 1.16, p = 0.2613). *p < 0.05 compared to controls. F. While BTBR mice treated with PNase showed no evidence of social memory, BTBR mice treated with chABC showed evidence of social memory (three-way repeated measures ANOVA, trial: F(1.872,103.0) = 48.52, p < 0.0001; strain: F(1,55) = 29.46, p < 0.0001; trial X strain: F(2,110) = 16.08, p < 0.0001; drug: F(1,55) = 0.6334, p = 0.4295; trial X drug: F(2,110) = 3.061, p = 0.0508; trial X strain X drug: F(2,110) = 1.904, p = 0.1538). *p < 0.05 from novel 1 to familiar. G. BTBR mice treated with chABC investigated the novel mouse more than the familiar mouse and this difference was greater than that of BTBR mice treated with Pnase (novel 1 – familiar) (two-way ANOVA, strain: F(1,55) = 26.69, p < 0.0001; drug: F(1,55) = 4.365, p = 0.0413; strain X drug: F(1,55) = 4.062, p = 0.0488). *p <0.05 compared to all other groups. H. Unlike BTBR mice treated with PNase, BTBR mice treated with chABC investigated the familiar mouse more than the second novel mouse (familiar – novel 2) (two-way ANOVA, strain: F(1,55) = 27.96, p < 0.0001; drug: F(1,55) = 5.756, p = 0.0199, strain X drug: F(1,55) = 0.07349, p = 0.7873). *p < 0.05 compared to Control + PNase and Control + chABC. For panels C - E, n = 10 for each group. For panels F - H, n = 15 for control groups, n = 15 for BTBR + PNase, and n = 14 for BTBR + chABC. Error bars represent SEM. See Supplementary Table 4 for complete statistics.

Similar articles

Cited by

References

    1. Williams DL, Goldstein G, Minshew NJ Impaired memory for faces and social scenes in autism: clinical implications of memory dysfunction. Arch Clin Neuropsychol 2005; 20:1–15. - PubMed
    1. Porcelli S et al. Social brain, social dysfunction and social withdrawal. Neurosci Biobehav Rev. 2019; 97:10–33. - PubMed
    1. Kurtz MM, Bronfeld M, Rose J. Cognitive and social cognitive predictors of change in objective versus subjective quality-of-life in rehabilitation for schizophrenia. Psychiatry Res. 2012; 200:102–107. - PMC - PubMed
    1. García-Casal JA, Goñi-Imizcoz M, Perea-Bartolomé MV, Soto-Pérez F, Smith SJ, Calvo-Simal S, Franco-Martín M. The efficacy of emotion recognition rehabilitation for people with Alzheimer’s Disease. J Alzheimers Dis. 2017;57:937–951. - PubMed
    1. Kogan JH, Frankland PW, Silva AJ. Long-term memory underlying hippocampus-dependent social recognition in mice. Hippocampus. 2000; 10:47–56. - PubMed

Publication types