. 2021 Aug;40(31):5013-5025.
doi: 10.1038/s41388-021-01921-3. Epub 2021 Jun 28.

DNAJA1 promotes cancer metastasis through interaction with mutant p53

Affiliations

DNAJA1 promotes cancer metastasis through interaction with mutant p53

Atsushi Kaida et al. Oncogene. 2021 Aug.

Abstract

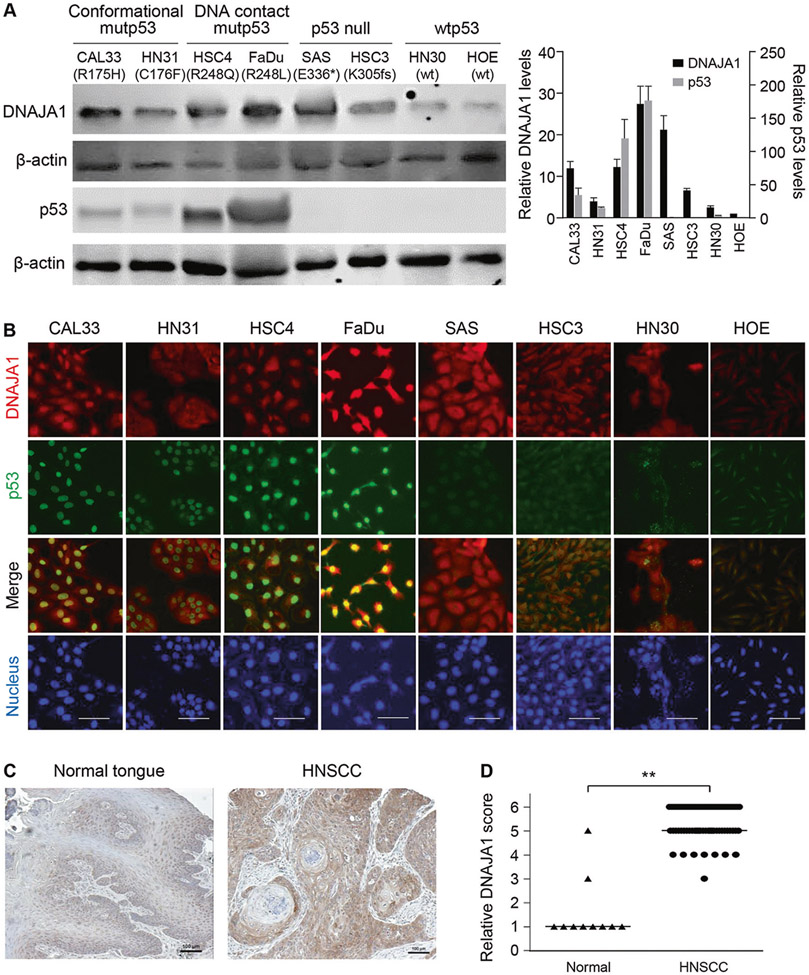
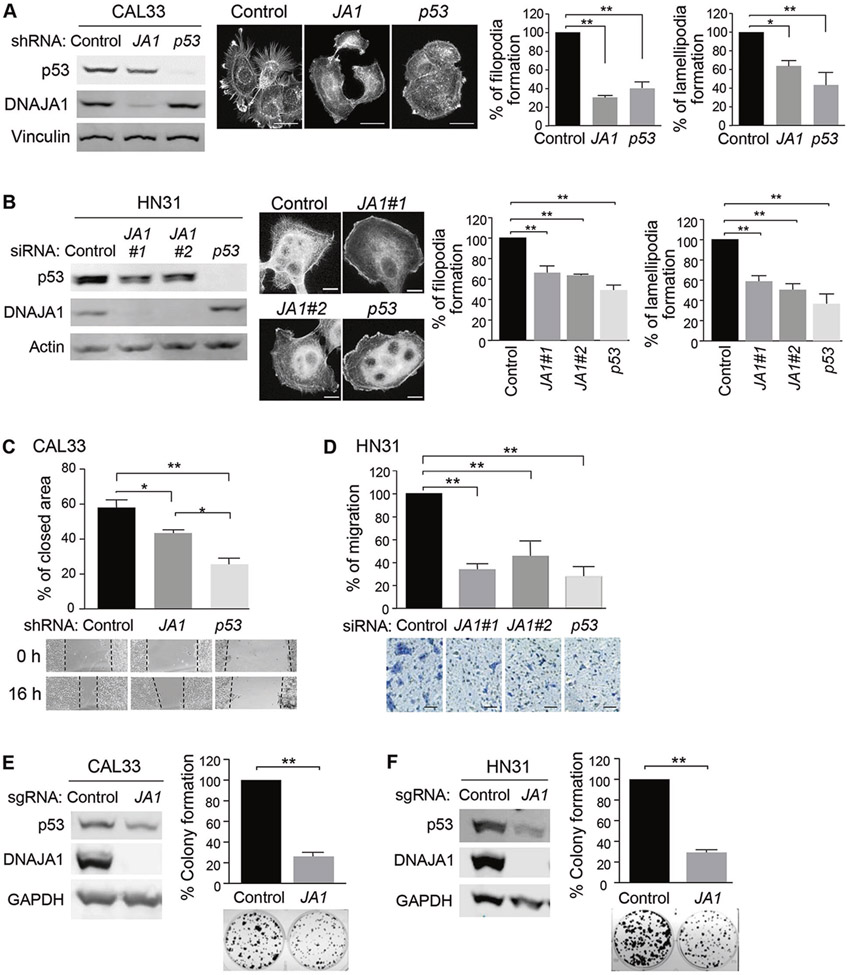
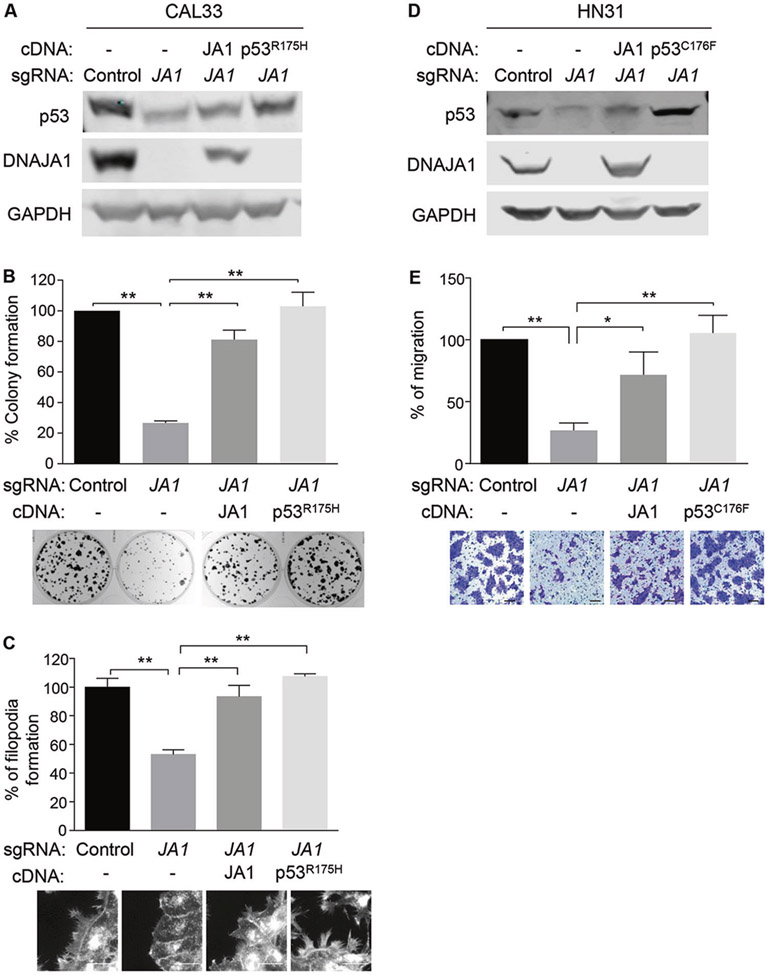
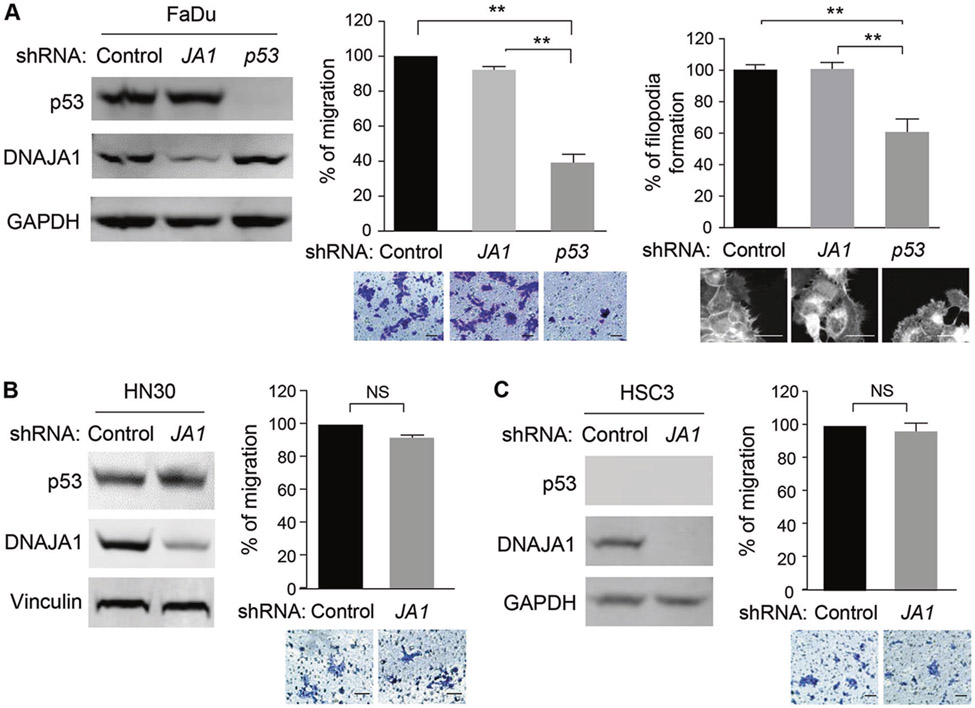
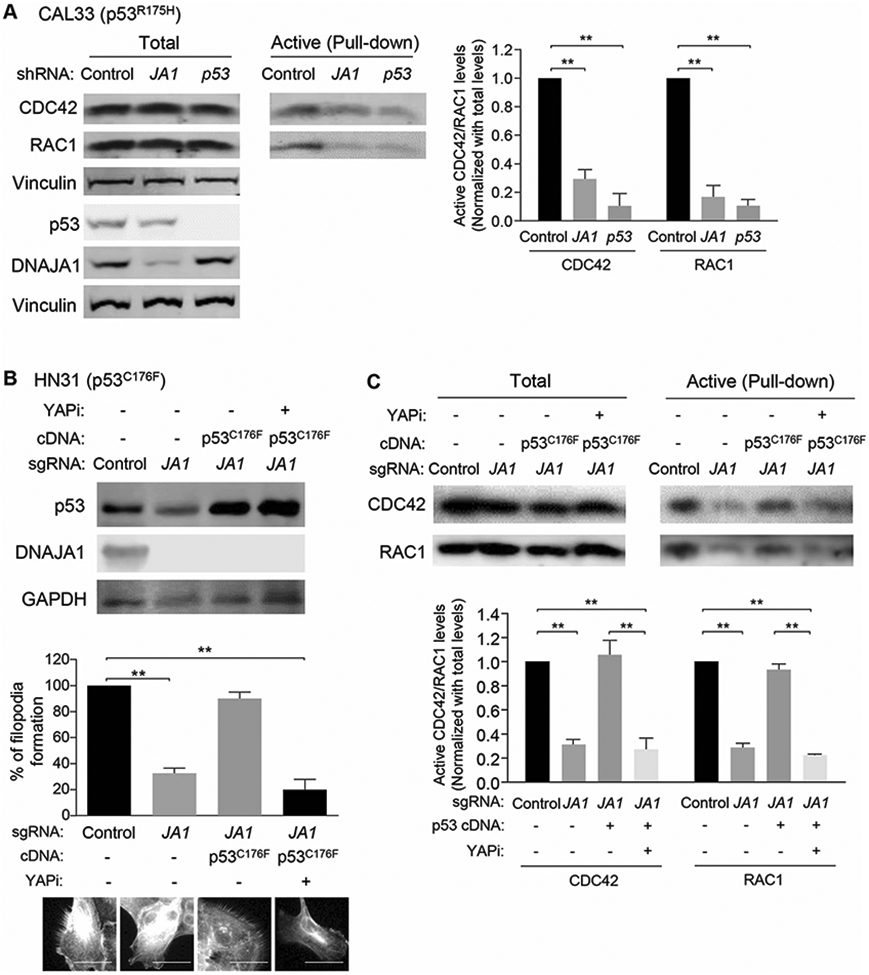
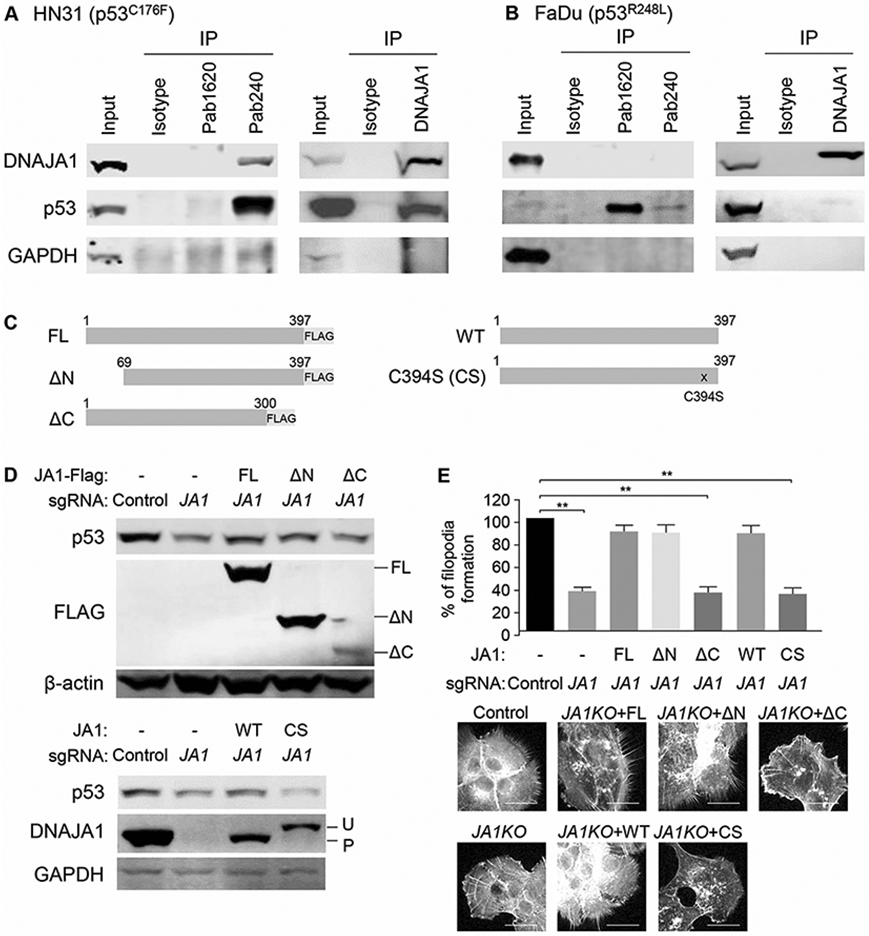
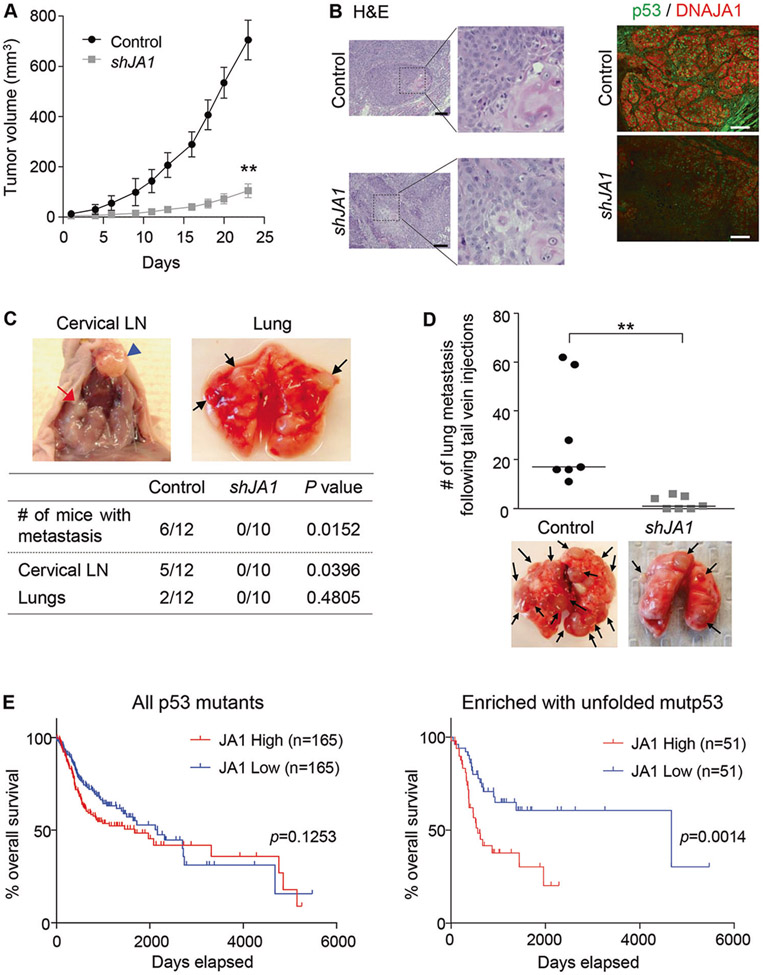
Accumulation of mutant p53 (mutp53) is crucial for its oncogenic gain of function activity. DNAJA1, a member of J-domain containing proteins or heat shock protein 40, is shown to prevent unfolded mutp53 from proteasomal degradation. However, the biological function of DNAJA1 remains largely unknown. Here we show that DNAJA1 promotes tumor metastasis by accumulating unfolded mutp53. Levels of DNAJA1 in head and neck squamous cell carcinoma (HNSCC) tissues were higher than those in normal tissues. Knockdown of DNAJA1 in HNSCC cell lines carrying unfolded mutp53 significantly decreased the levels of mutp53, filopodia/lamellipodia formation, migratory potential, and active forms of CDC42/RAC1, which were not observed in HNSCC cells with DNA contact mutp53, wild-type p53, or p53 null. Such mutp53-dependent functions of DNAJA1 were supported by the observation that DNAJA1 selectively bound to unfolded mutp53. Moreover, DNAJA1 knockdown in HNSCC cells carrying unfolded mutp53 inhibited primary tumor growth and metastases to the lymph nodes and lungs. Our study suggests that DNAJA1 promotes HNSCC metastasis mainly in a manner dependent on mutp53 status, suggesting DNAJA1 as a potential therapeutic target for HNSCC harboring unfolded mutp53.


Figures

Fig. 1
Fig. 1. Increased DNAJA1 protein levels in HNSCC.
A, B Western blotting ((A), left), quantitative analysis of DNAJA1 and p53 levels ((A), right), and representative images of immunofluorescence (B) for DNAJA1 and p53 using human HNSCC and oral epithelial (HOE) cells with different p53 status indicated in parentheses. Means ± SE (n = 3 independent experiments). Scale bar: 50 μm. C, D Representative images (C) and quantitative analysis (D) of immunohistochemistry for DNAJA1 in the normal tongue (left, n = 10) and HNSCC (right, n = 69) tissues in tissue microarrays. Scale bar: 100 μm. DNAJA1 scores were measured as the sum of intensity and extensity of DNAJA1. Horizontal lines represent the median. **P < 0.01; Mann–Whitney U test.
Fig. 2
Fig. 2. Reduced oncogenic properties by DNAJA1 depletion in HNSCC cells carrying unfolded mutp53.
A, B Western blotting for p53, DNAJA1, and vinculin or Actin (left), representative images of F-actin staining (middle), and quantification of filopodia/lamellipodia formation (right) using CAL33 (p53R175H) cells infected with lentiviral vectors encoding non-target control, DNAJA1 (JA1), or p53 shRNA (A) and HN31 (p53C176F) cells transfected with non-target control, DNAJA1 (JA1#1, JA1#2), or p53 siRNAs (B). Scale bar: 10 μm. C Quantitative analysis (top) and representative images (bottom) of wound healing assays using non-target control, DNAJA1 (JA1), and p53 (p53) knockdown CAL33 cells. Images were captured immediately (0 h) and 16 h after wound generation. D Quantitative analysis (top) and representative images (bottom) of transwell migration assays using control, DNAJA1 (JA1#1, JA1#2), and p53 (p53) knockdown HN31 cells (5 × 10⁴). Migrating cells in the entire field were counted 14 h later. Scale bar: 100 μm. E, F Western blotting for indicated proteins (left) and quantitative analyses with representative images of colony formation (right), using CAL33 (E) and HN31 (F) cells knockout for DNAJA1 with scramble control or DNAJA1 (JA1) sgRNA, using the all-in-one CRISPR-Cas9 system. Means ± SE (n = 3 independent experiments). *P < 0.05, **P < 0.01; one-way ANOVA (A)–(D) or two-tailed Student’s t-test (E), (F).
Fig. 3
Fig. 3. Phenotypic rescue by DNAJA1 and mutp53 in DNAJA1-knockout HNSCC cells.
A Western blotting for p53, DNAJA1, and GAPDH in control or DNAJA1-knockout (JA1) CAL33 cells, generated by the all-in-one CRISPR-Cas9 system, with or without overexpression of DNAJA1 (V5-tagged at the C-terminus) or p53R175H. B Quantitative analysis (upper) and representative images (bottom) of colony formation assays in control or DNAJA1-knockout CAL33 cells with or without overexpression of DNAJA1 or p53R175H. C Quantitative analysis (upper) and representative images (bottom) of filopodia formation in control or DNAJA1-knockout CAL33 cells with or without overexpression of DNAJA1 or p53R175H. Scale bar: 10 μm. D Western blotting for indicated proteins using control or DNAJA1-knockout HN31 cells, generated by the all-in-one CRISPR-Cas9 system, with or without overexpression of DNAJA1 or p53C176F. E Quantitative analysis (upper) and representative images (bottom) of transwell migration assays in control or DNAJA1-knockout HN31 cells (5 × 10⁴) with or without overexpression of DNAJA1 or p53C176F. Migrating cells in the entire field were counted 16 h later. Scale bar: 100 μm. Means ± SE (n = 3 independent experiments). *P < 0.05, **P < 0.01; one-way ANOVA.
Fig. 4
Fig. 4. Minimal impact of DNAJA1 knockdown on the p53 levels and migration in HNSCC cells with wtp53, p53 null, and DNA contact mutp53.
A Western blotting for p53, DNAJA1, and GAPDH (left), quantitative analysis with representative images of transwell migration assays (5 × 10⁴ cells for 12 h, scale bar: 100 μm, middle), and quantitative analysis with representative images of filopodia formation assays (scale bar: 10 μm, right), using FaDu (p53R248L) cells with control, DNAJA1 (JA1), and p53 (p53) knockdown. B, C Western blotting for indicated proteins (left) and quantitative analysis with representative images of transwell migration assays (right), using HN30 (wtp53, (B)) and HSC3 (p53 null, (C)) cells knockdown for non-target control or DNAJA1. Migration assays were performed using 5 × 10⁴ HN30 and 8 × 10⁴ HSC3 cells for 14 h. Scale bar: 100 μm. Means ± SE (n = 3 independent experiments). **P < 0.01; one-way ANOVA (A) or two-tailed Student’s t-test (B), (C). NS not significant.
Fig. 5
Fig. 5. Reduced CDC42 and RAC1 activities by DNAJA1 knockdown in cells carrying unfolded mutp53.
A RAC1/CDC42 pull-down assays and western blotting for indicated proteins (left) using DNAJA1- or mutp53-knockdown CAL33 (p53R175H) cells. Quantitative analyses of RAC1/CDC42 activities (right). B Western blotting for p53, DNAJA1 and GAPDH (top) and quantification of filopodia formation with representative images of F-actin staining (bottom), using control or DNAJA1-knockout (JA1) HN31 cells infected with lentiviral vectors encoding empty vector or p53C176F cDNA, in the absence or presence of an inhibitor, verteporfin (YAPi, 2 μM for 24 h). Scale bar: 10 μm. C RAC1/CDC42 pull-down assays and western blotting for indicated proteins, using control or DNAJA1-knockout (JA1) HN31 cells with or without overexpression of p53C176F, with or without treatment of verteporfin (YAPi, 2 μM for 24 h) (top). Quantitative analyses of RAC1/CDC42 activities (bottom). Means ± SE (n = 3 independent experiments). **P < 0.01; one-way ANOVA.
Fig. 6
Fig. 6. Selective interaction of DNAJA1 with unfolded mutp53.
A, B Co-immunoprecipitation studies under a non-denaturing condition with conformation-specific p53 antibodies (PAb1620 and PAb240) or an anti-DNAJA1 antibody using HN31 (A) and FaDu (B) cells. C Design for deletion or missense DNAJA1 mutants. DNAJA1 Full-length (FL) and mutants lacking a N-terminal (ΔN) or a C-terminal (ΔC) region were tagged with 3×FLAG, while wild-type (WT) and missense DNAJA1 mutants (C394S) were non-tagged. D, E Western blotting with indicated antibodies (D) and quantitative analysis with representative images of filopodia formation (E), using control or DNAJA1-knockout HN31 cells reconstituted with DNAJA1 (FL, WT) or mutant DNAJA1 as indicated. Scale bar: 10 μm. Means ± SE (n = 3 independent experiments). **P < 0.01; one-way ANOVA.
Fig. 7
Fig. 7. Inhibition of primary tumor growth and metastases by DNAJA1 knockdown.
A Tumor growth in nude mice following injection of control and DNAJA1-knockdown (shJA1) HN31 cells into the floor of mouth (n = 5, each group). Means ± SE **P < 0.01; two-way ANOVA. B Representative images of H&E staining and immunofluorescence for p53 and DNAJA1 using primary tumors developed in mice. Scale bar: 100 μm. C Representative images of metastases to cervical lymph nodes (LN; red arrow, left) and lungs (black arrows, right). A blue arrowhead on the left indicates a primary tumor. A summary table below the panels shows a quantitative analysis of metastases. P values; Fisher’s exact test. D Representative images and quantitative analysis of pulmonary metastatic nodules, following tail vein injections of HN31 cells (1 × 10⁵) with or without DNAJA1 knockdown (n = 7). The horizontal lines represent the median. **P < 0. 01; Mann–Whitney U test. E TCGA data-based Kaplan–Meier analyses for overall survival in patients with HNSCC carrying missense mutp53 with (right, n = 51) or without (left, n = 165) exclusion of mutations in four major DNA contact sites (K120, R248, R273, R280). A cohort is separated by cases with the top third (high, red) and bottom third (low, blue) of DNAJA1 mRNA expression levels. P value; log-rank test.

Similar articles

Cited by

References

    1. Cyr DM, Ramos CH. Specification of Hsp70 function by type I and type II Hsp40. Subcell Biochem. 2015;78:91–102. - PubMed
    1. Hartl FU, Bracher A, Hayer-Hartl M. Molecular chaperones in protein folding and proteostasis. Nature. 2011;475:324–32. - PubMed
    1. Large AT, Goldberg MD, Lund PA. Chaperones and protein folding in the archaea. Biochem Soc Trans. 2009;37:46–51. - PubMed
    1. Kampinga HH, Craig EA. The HSP70 chaperone machinery: J proteins as drivers of functional specificity. Nat Rev Mol Cell Biol. 2010;11:579–92. - PMC - PubMed
    1. Chen CY, Jan CI, Lo JF, Yang SC, Chang YL, Pan SH, et al. Tid1-L inhibits EGFR signaling in lung adenocarcinoma by enhancing EGFR Ubiquitinylation and degradation. Cancer Res. 2013;73:4009–19. - PubMed

Publication types

MeSH terms