. 2021 Dec;28(12):3357-3370.
doi: 10.1038/s41418-021-00823-x. Epub 2021 Jun 28.

Ki-67 gene expression

Affiliations

Ki-67 gene expression

Sigrid Uxa et al. Cell Death Differ. 2021 Dec.

Abstract

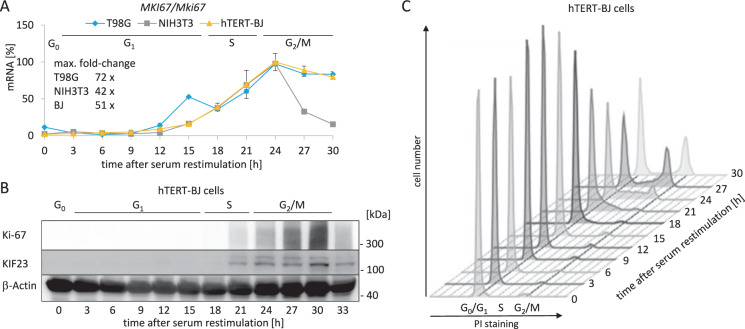
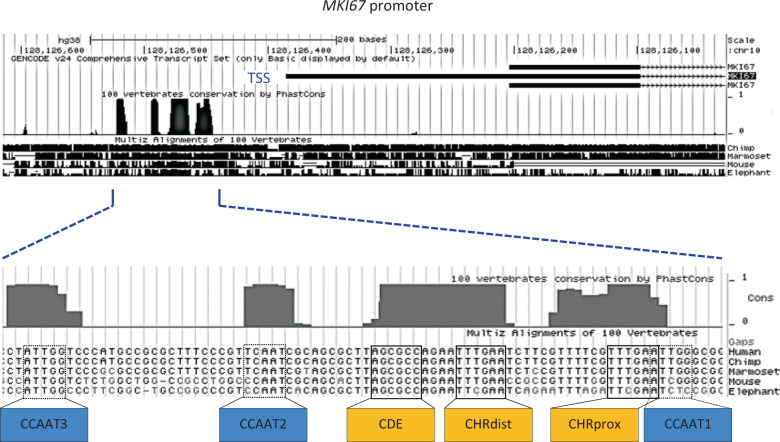
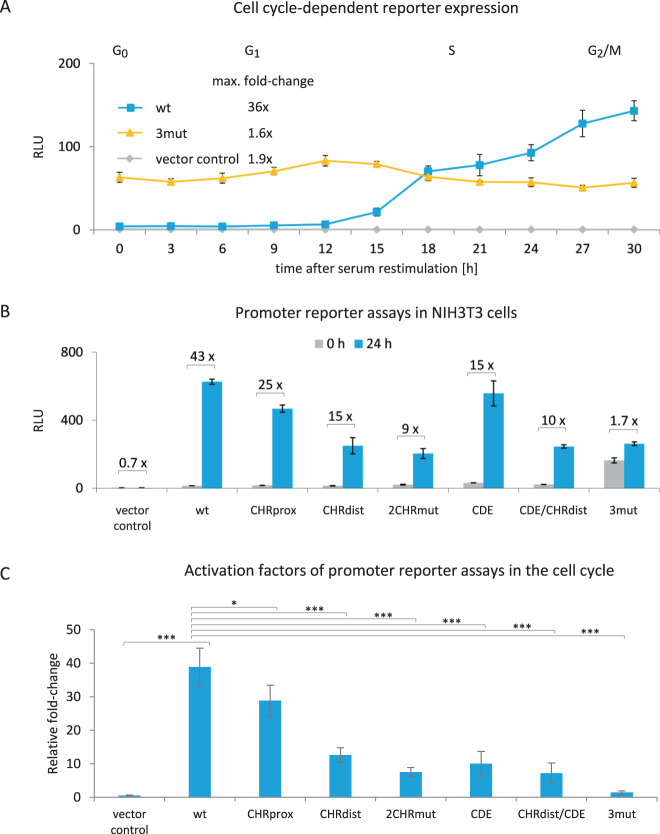
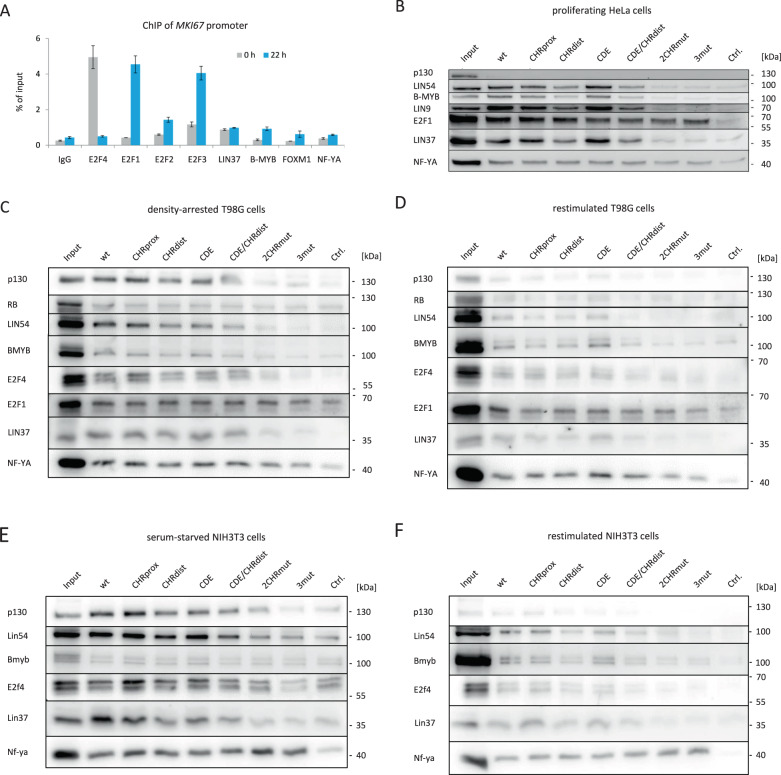
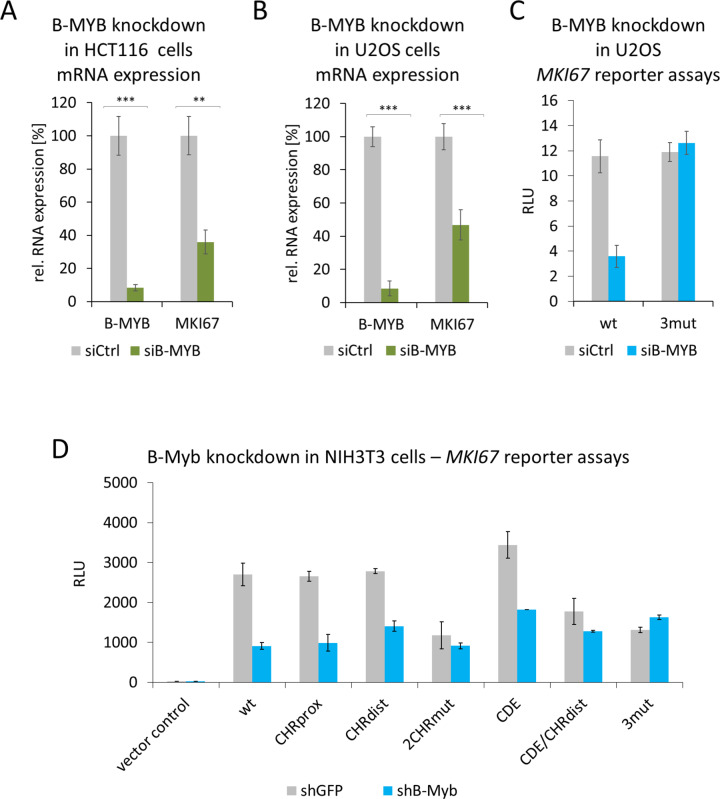
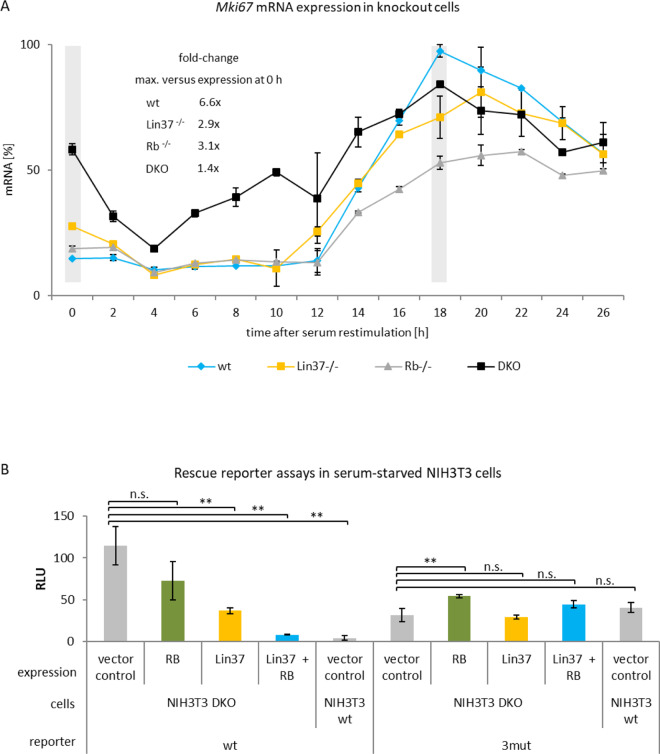
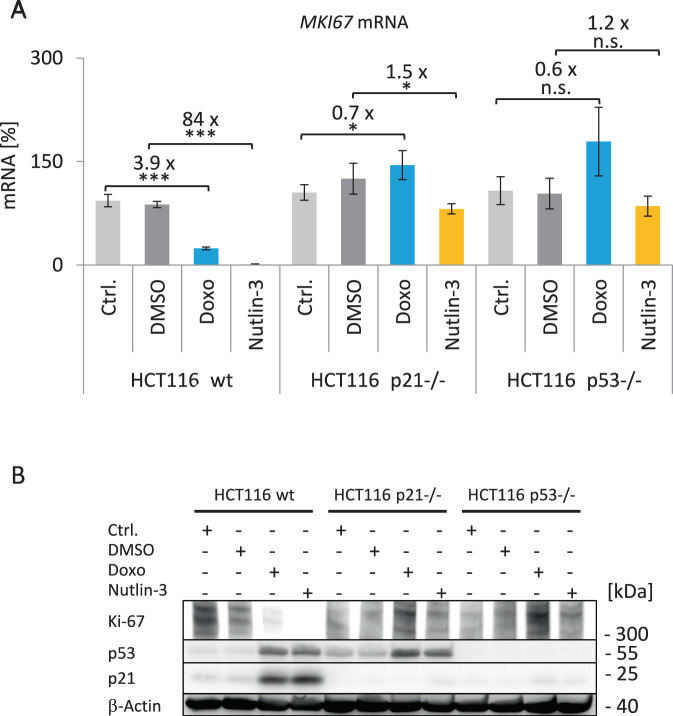
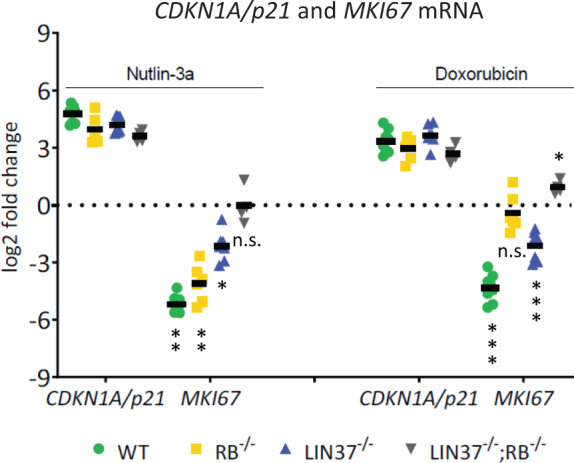
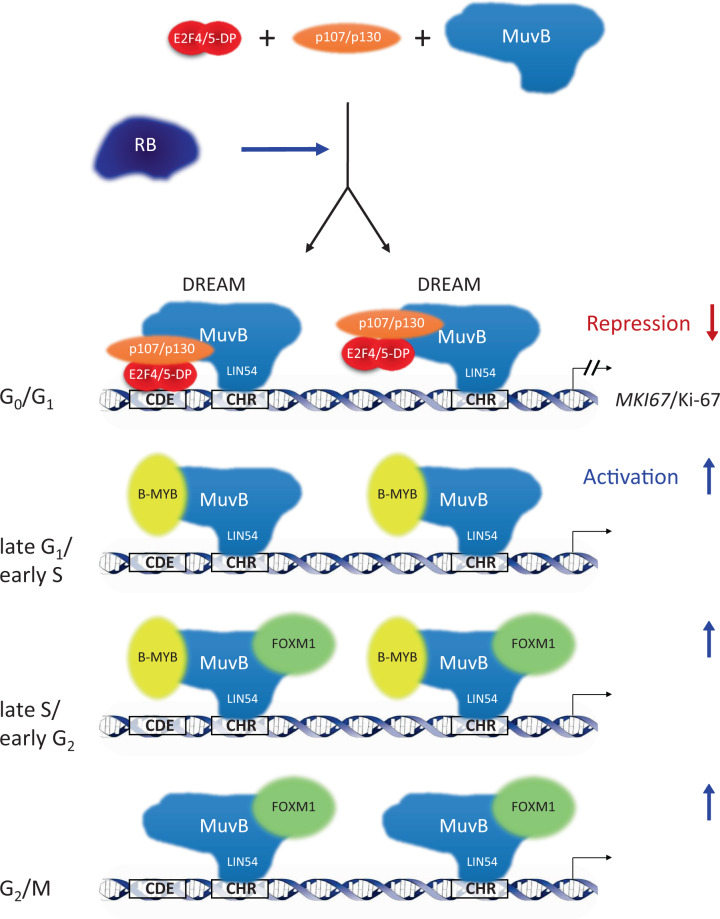
Ki-67 serves as a prominent cancer marker. We describe how expression of the MKI67 gene coding for Ki-67 is controlled during the cell cycle. MKI67 mRNA and Ki-67 protein are maximally expressed in G2 phase and mitosis. Expression is dependent on two CHR elements and one CDE site in the MKI67 promoter. DREAM transcriptional repressor complexes bind to both CHR sites and downregulate the expression in G0/G1 cells. Upregulation of MKI67 transcription coincides with binding of B-MYB-MuvB and FOXM1-MuvB complexes from S phase into G2/M. Importantly, binding of B-MYB to the two CHR elements correlates with loss of CHR-dependent MKI67 promoter activation in B-MYB-knockdown experiments. In knockout cell models, we find that DREAM/MuvB-dependent transcriptional control cooperates with the RB Retinoblastoma tumor suppressor. Furthermore, the p53 tumor suppressor indirectly downregulates transcription of the MKI67 gene. This repression by p53 requires p21/CDKN1A. These results are consistent with a model in which DREAM, B-MYB-MuvB, and FOXM1-MuvB together with RB cooperate in cell cycle-dependent transcription and in transcriptional repression following p53 activation. In conclusion, we present mechanisms how MKI67 gene expression followed by Ki-67 protein synthesis is controlled during the cell cycle and upon induction of DNA damage, as well as upon p53 activation.


Conflict of interest statement

The authors declare no competing interests.

Figures

Fig. 1
Fig. 1. Ki-67 expression on the mRNA and protein levels reaches a maximum in G2/M.
A Expression of MKI67/Mki67 mRNA over the course of one cell cycle. Human T98G (blue), mouse NIH3T3 (gray), and human hTERT-BJ cells (yellow) were arrested in G0 by serum starvation for 72 h. To stimulate the cells to re-enter the cell cycle, FCS was added to the medium. Cells were collected every 3 h after serum restimulation. Each sample was divided into three aliquots for RNA and protein extraction, and for flow cytometry analyses. Relative mRNA levels from MKI67/Mki67 genes were quantified using real-time RT-qPCR. Mean values ± SD of two technical replicates for each time point are given. The maximum fold-change in MKI67/Mki67 mRNA levels was calculated for each cell line. Approximations of cell cycle phase distribution for hTERT-BJ cells were deduced from flow cytometry analyses in C and are indicated above the graphs. B Protein levels of Ki-67 in hTERT-BJ cells used in A, B, and C over the course of one cell cycle were analyzed by western blot analysis. One representative experiment from three biological replicates is shown. KIF23 and β-actin proteins served as cell cycle and loading controls, respectively. Approximate cell cycle phases are indicated. C Flow cytometry analyses of propidium iodide (PI) staining of hTERT-BJ cells analyzed in A and B. Quantification of Ki-67 protein expression of two biological replicates is displayed in Suppl. Fig. 1.
Fig. 2
Fig. 2. Identification of phylogenetic conserved putative regulatory sites and the transcription start in the MKI67 gene.
A DNA segment spanning ~0.6 kb upstream from the first MKI67 intron of the human gene (genome version hg38) and surrounding the transcriptional start site (TSS) was aligned to 100 vertebrate genes using the UCSC Genome Browser. The most conserved region of about 100 nucleotides is displayed in detail giving a sequence alignment of the human, chimpanzee, marmoset, mouse, and elephant gene regions. Transcriptional elements are highlighted and named relative to their position to the MKI67 coding region: CCAAT-boxes (CCAAT1, 2, and 3), proximal cell cycle genes homology region CHR (CHRprox), cell cycle-dependent element (CDE), and distal CHR (CHRdist).
Fig. 3
Fig. 3. Two CHR sites and one CDE control MKI67 cell cycle-dependent transcriptional regulation.
Luciferase reporter promoter assays from transfected cells that were serum-starved and restimulated by serum addition to the medium. Transfected plasmids were the empty reporter vector pGL4.10 (vector control) and wild-type or mutant reporter plasmid constructs based on a 596 bp MKI67 fragment including the TSS (see Fig. 2 and Suppl. Fig. 2 for position): wild-type (wt), mutant of the proximal CHR (CHRprox), mutant of the distal CHR (CHRdist), mutant of both CHR elements (2CHRmut), CDE mutant (CDE), a combination of mutations in CHRdist and CDE (CDE/CHRdist), and mutation of the three sites CHRprox, CHRdist, and CDE (3mut). Relative light units (RLUs) were calculated as the ratio of firefly luciferase activity from the promoter reporter constructs to the Renilla luciferase activity from a cotransfected control plasmid lacking a promoter. A Promoter reporter activity in different phases of the cell cycle. NIH3T3 cells were arrested in G0 through serum starvation for 72 h. To stimulate the cells to re-enter the cell cycle, serum was added to the medium. Luciferase assays from NIH3T3 cells transfected with vector control (gray), wt (blue), or 3mut (yellow) MKI67 firefly reporter promoter constructs. Cells were collected every 3 h after serum restimulation and RLUs were measured from three technical replicates for each time point. One representative experiment from two biological replicates is shown. The maximum fold-change for each construct was calculated. Approximate cell cycle phases were assessed by flow cytometry and are given above the graph. B NIH3T3 cells were serum-starved for 72 h (0 h, gray) and restimulated by serum addition (blue) for 24 h. One representative experiment from three biological replicates is shown. Cells were collected and RLUs were measured as technical duplicates. The relative fold-change in RLUs from 0 to 24 h for each promoter construct was calculated and is given above the columns. For all graphs, mean values ± SD are given. C Compilation of relative activation factors for each tested plasmid from experiments as shown in B. Averages of activation factors of RLUs 24 h after restimulation over RLUs at 0 h before stimulation. Activation factors yield a rate of activation for each promoter construct in the cell cycle. Results are from n ≥ 3 biological replicates for each plasmid examined. Significance was tested via an unpaired t-test (n.s., not significant; *p ≤ 0.05; **p ≤ 0.01; ***p ≤ 0.001).
Fig. 4
Fig. 4. DREAM, E2F, and FOXM1/B-MYB/MuvB complex components bind to the MKI67 promoter in vivo and in vitro.
E2F4 and p130 were detected as representatives of DREAM. B-MYB is specific for B-MYB-MuvB. NF-YA is a subunit of NF-Y. E2F1/2/3 proteins are detected to represent E2F proteins independent of DREAM. FOXM1 detection indicates FOXM1-MuvB binding. LIN37 and LIN54 are representative components of all MuvB-based complexes. A In vivo protein binding to the MKI67 promoter in serum-starved (0 h, gray) and restimulated (22 h, blue) human T98G cells was analyzed via chromatin immunoprecipitation (ChIP) followed by real-time qPCR. Mean values ± SD are given of one representative experiment with two technical replicates for each precipitate. BF Nuclear extracts from proliferating HeLa cells (B), density-arrested human T98G cells (C), restimulated T98G cells (D), serum-starved mouse NIH3T3 cells (E), as well as restimulated NIH3T3 cells (F) were subjected to DNA affinity purification, to assay in vitro binding of complex components by western blot analysis. Fragments of the MKI67 promoter containing wild-type (wt) or mutant promoter fragments with mutations in CHRprox, CHRdist, and CDE sites were used for DNA probes. 2CHRmut, CDE/CHRdist, and 3mut mutant probes carry combined mutations in CHRdist/CHRprox, CDE/CHRdist, and CHRdist/CHRprox/CDE, respectively. As a negative control of background binding (Ctrl.), a fragment of the mouse Gapdh2 promoter was employed. Input samples were taken from the nuclear extract before purification. For detection with one specific antibody, all samples were run on the same gel and analyzed via western blotting.
Fig. 5
Fig. 5. B-MYB activates the MKI67 promoter through the two CHR elements.
A, B MKI67 mRNA expression after B-MYB knockdown in HCT116 (A) or U2OS (B) cells. The cells were transfected with A 10 nM or B 25 nM non-targeting siRNAs (siCtrl) or B-MYB siRNA (siB-MYB). Relative mRNA levels from MKI67 and MYBL2 genes were quantified using real-time RT-qPCR. Mean values ± SD of three (A) or four (B) biological replicates are given. C MKI67 luciferase promoter reporter assays after B-MYB knockdown in U2OS cells employing wild-type (wt) and mutant MKI67 promoter (3mut) carrying mutations in the CHRprox, CHRdist, and CDE sites. Mean values ± SD are given of one representative experiment with three technical replicates out of four biological replicates. D NIH3T3 cells were transfected with MKI67 luciferase promoter reporter constructs together with equal amounts of plasmids expressing non-targeting shRNAs (shGFP) or B-Myb shRNAs (shB-Myb). Transfected reporter plasmids were the empty reporter vector pGL4.10 (vector control) and wild-type or mutant reporter plasmid constructs: wild-type (wt), mutants of the proximal CHR (CHRprox), distal CHR (CHRdist), mutant of both CHR elements (2CHRmut), CDE mutant (CDE), a combination of mutations in CHRdist and CDE (CDE/CHRdist), and mutation of the three sites CHRprox, CHRdist, and CDE (3mut). The mean relative light units (RLUs) of two biological replicates and SDs are given.
Fig. 6
Fig. 6. DREAM cooperates with RB for repression of MKI67 gene expression.
Expression of Mki67 mRNA or expression from MKI67 reporter constructs in knockout cell models. Wild-type mouse NIH3T3 and knockout cells deficient for Lin37, Rb, or Lin37 and RB (DKO) were employed for the assays. A Mki67 mRNA expression in serum-starved and restimulated cells. Wild-type (wt, blue), Lin37-deficient (Lin37−/−, yellow), Rb-deficient (Rb−/−, gray), and DKO (black) cells were arrested by serum starvation (0 h) followed by addition of serum to the medium, to stimulate cells to re-enter the cell cycle. Hours after serum addition are given. Relative Mki67 mRNA levels were quantified using real-time RT-qPCR. All values were normalized to the highest measurement from the wild-type cells. Mean values ± SD are given of two technical replicates for each time point. The fold-change of Mki67 mRNA levels was calculated for each cell line by dividing maximal expression by levels at 0 h. Gray bars at 0 and 18 h time points were introduced to emphasize comparison of expression between serum-starved and restimulated cells, respectively. B Expression from MKI67 promoter luciferase reporter constructs and phenotype rescue in cells lacking Lin37 and Rb. Serum-starved NIH3T3 wild-type cells (wt) and NIH3T3 cells deficient for both Lin37 and Rb (DKO) were transfected before starvation with different expression plasmids: empty pcDNA vector (vector control, gray), carrying a cDNA coding for Rb (Rb, green), containing a Lin37 cDNA (Lin37, yellow) or expressing both Lin37 and RB (Lin37 + RB, blue). In addition, cells were transfected with reporter plasmids containing wild-type (wt) or mutated in CHRprox, CDE, and CHRdist elements (3mut) MKI67 promoter constructs. Luciferase relative light units (RLUs) of one representative out of three biological replicates were measured. Mean values ± SD of three technical replicates are given and significances were calculated using the Student’s t-test (n.s., not significant; *p ≤ 0.05; **p ≤ 0.01; ***p ≤ 0.001).
Fig. 7
Fig. 7. Ki-67 downregulation after DNA damage and p53 activation depends on the p53-p21 pathway.
A Expression of MKI67 mRNA in HCT116 wild-type (wt), p21-deficient (p21−/−), or p53-deficient (p53−/−) cells treated with doxorubicin (Doxo, blue) or nutlin-3a (yellow) for 48 h. Cells without treatment (Ctrl., light gray) or with DMSO treatment (dark gray) served as controls. MKI67 mRNA levels are shown, which were quantified from one representative experiment out of two biological replicates by real-time RT-qPCR and normalized to U6 RNA levels. Mean values ± SD from two technical replicates are given and significances were calculated using the Student’s t-test (n.s., not significant; *p ≤ 0.05; **p ≤ 0.01; ***p ≤ 0.001). The relative fold-change in expression levels between treatment and respective control was calculated. B Immunoblot detection of Ki-67. Cell samples from the same experiment described in A were used for protein extraction. It is one representative experiment of three biological replicates. Ki-67, p53, and p21 protein levels were analyzed via western blotting. β-Actin served as loading control. All samples were run on the same gel and all proteins detected on the same blot.
Fig. 8
Fig. 8. LIN37 and RB contribute to MKI67 mRNA downregulation upon DNA damage induction and p53 activation.
HCT116 wild-type (WT) and mutant cells were tested for mRNA expression of the MKI67 and the CDK inhibitor CDKN1A/p21 genes. Clonal cell lines for WT (n = 4), RB−/− (n = 3), LIN37−/− (n = 4), or double-knockout LIN37−/−; RB−/− (n = 2) cells were treated with nutlin-3a or doxorubicin for 48 h. As controls, untreated or DMSO (solvent control)-treated (48 h) cell lines were analyzed. Levels of mRNA from CDKN1A/p21 and MKI67 genes were determined by real-time RT-qPCR. The log2-fold changes in mRNA expression of treated vs. control cells are given. Mean values are indicated by black bars. Significances were calculated using the Student’s t-test (n.s., not significant; *p ≤ 0.05; **p ≤ 0.01; ***p ≤ 0.001).
Fig. 9
Fig. 9. Regulation of MKI67/Ki-67 expression during the cell cycle.
Repression of transcription in G0 and G1 cells requires two DREAM complexes binding to one CDE and two CHR sites in the MKI67 promoter. One DREAM complex binds the downstream CHR site through the LIN54 subunit of the MuvB core complex. The second DREAM complex employs, in addition to a LIN54-CHR binding, complex formation of E2F4/5-DP heterodimers with the CDE site. In contrast to the direct interaction of DREAM complexes with the MKI67 promoter, RB does not directly control MKI67 transcription via binding to the gene. RB indirectly contributes to regulation through the CHR and CDE sites by influencing DREAM function. Once cells progress through the cell cycle, the p107/p130-E2F4/5-DP module dissociates from DREAM causing loss of repression. Instead, B-MYB and later FOXM1 sequentially bind to the MuvB core complex. Binding of B-MYB and FOXM1 through LIN54/MuvB to CHR elements leads to transcriptional activation and expression of MKI67/Ki-67. Transcription of MKI67 starts in late G1 phase and continues into mitosis with peak expression in G2/M.

References

    1. Gerdes J, Schwab U, Lemke H, Stein H. Production of a mouse monoclonal antibody reactive with a human nuclear antigen associated with cell proliferation. Int J Cancer. 1983;31:13–20. - PubMed
    1. Scholzen T, Gerdes J. The Ki-67 protein: from the known and the unknown. J Cell Physiol. 2000;182:311–22. - PubMed
    1. Gerdes J, Li L, Schlueter C, Duchrow M, Wohlenberg C, Gerlach C, et al. Immunobiochemical and molecular biologic characterization of the cell proliferation-associated nuclear antigen that is defined by monoclonal antibody Ki-67. Am J Pathol. 1991;138:867–73. - PMC - PubMed
    1. Gerdes J, Lemke H, Baisch H, Wacker HH, Schwab U, Stein H. Cell cycle analysis of a cell proliferation-associated human nuclear antigen defined by the monoclonal antibody Ki-67. J Immunol. 1984;133:1710–5. - PubMed
    1. Dowsett M, Dunbier AK. Emerging biomarkers and new understanding of traditional markers in personalized therapy for breast cancer. Clin Cancer Res. 2008;14:8019–26. - PubMed

Publication types

MeSH terms