Comparative Study
. 2021 Jul;7(7):966-978.
doi: 10.1038/s41477-021-00951-9. Epub 2021 Jun 28.

A species-specific functional module controls formation of pollen apertures

Affiliations
Comparative Study

A species-specific functional module controls formation of pollen apertures

Byung Ha Lee et al. Nat Plants. 2021 Jul.

Abstract

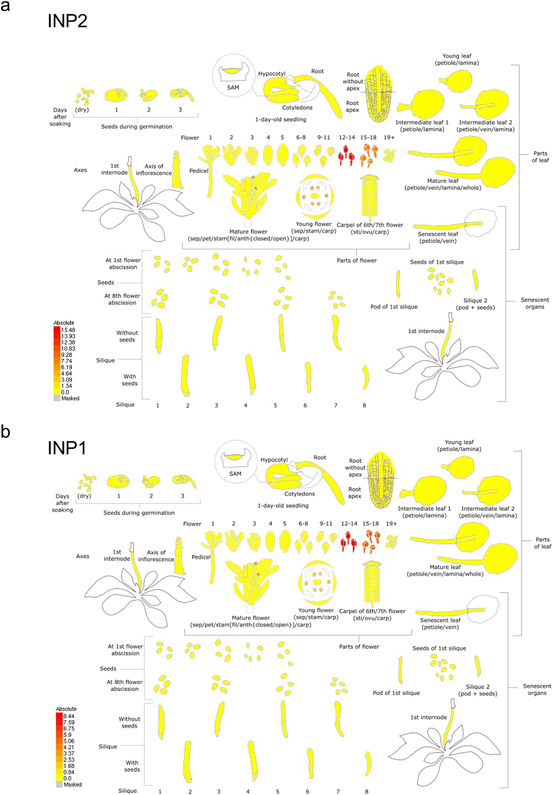
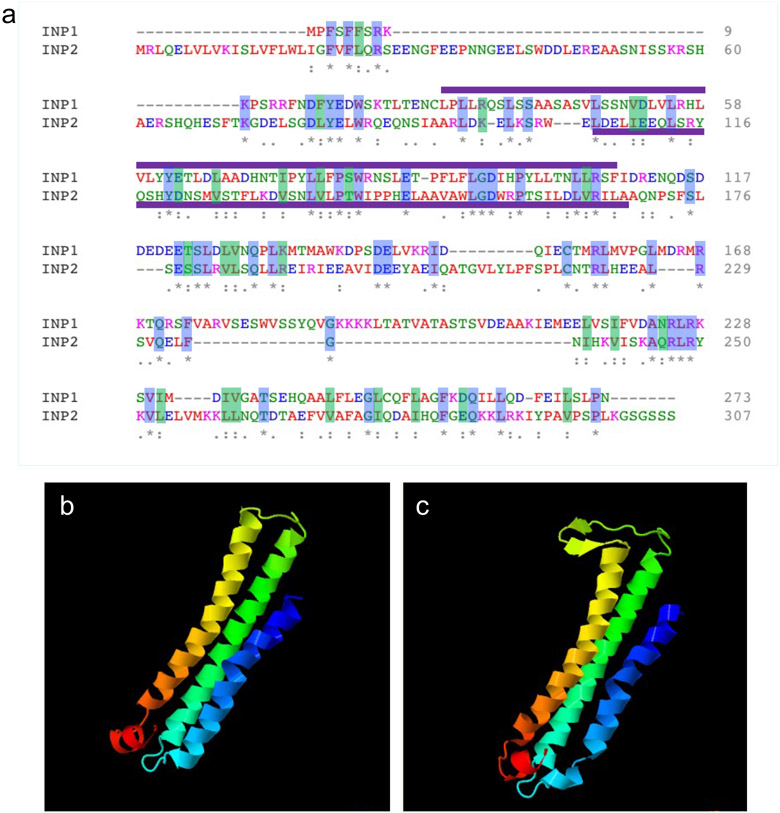
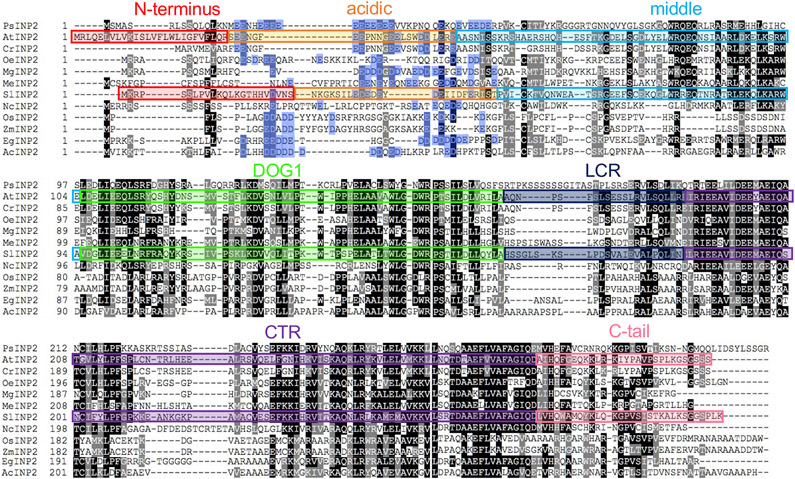
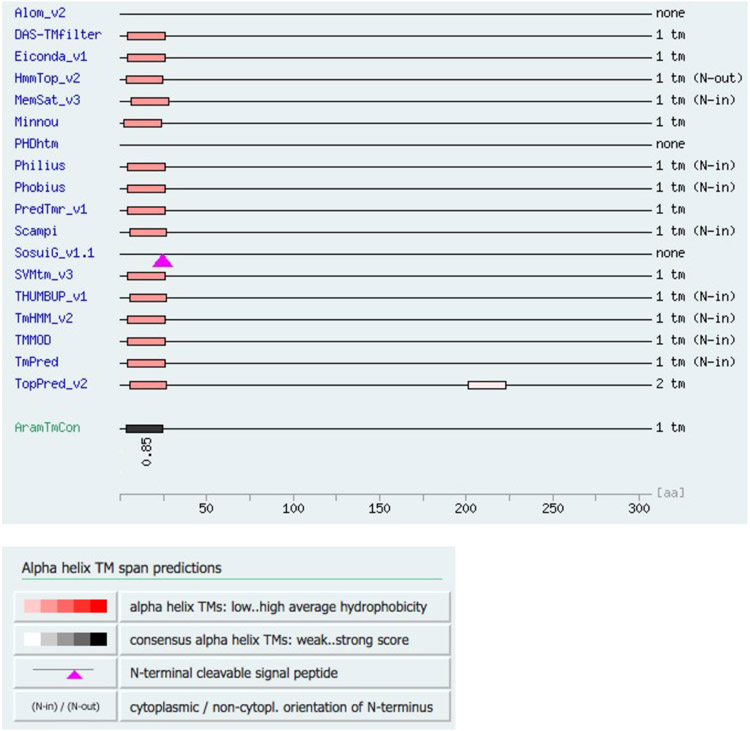
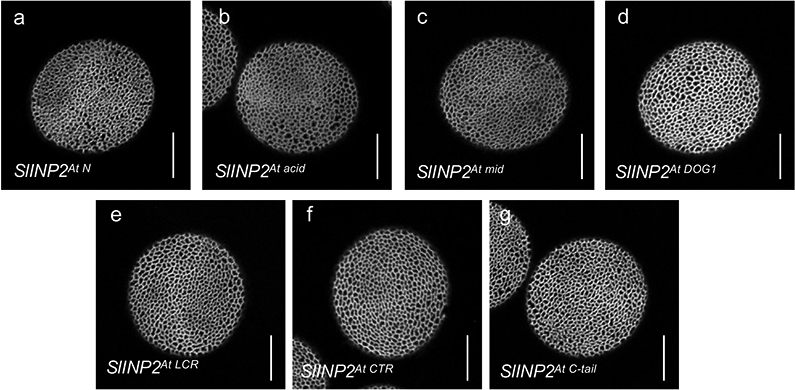
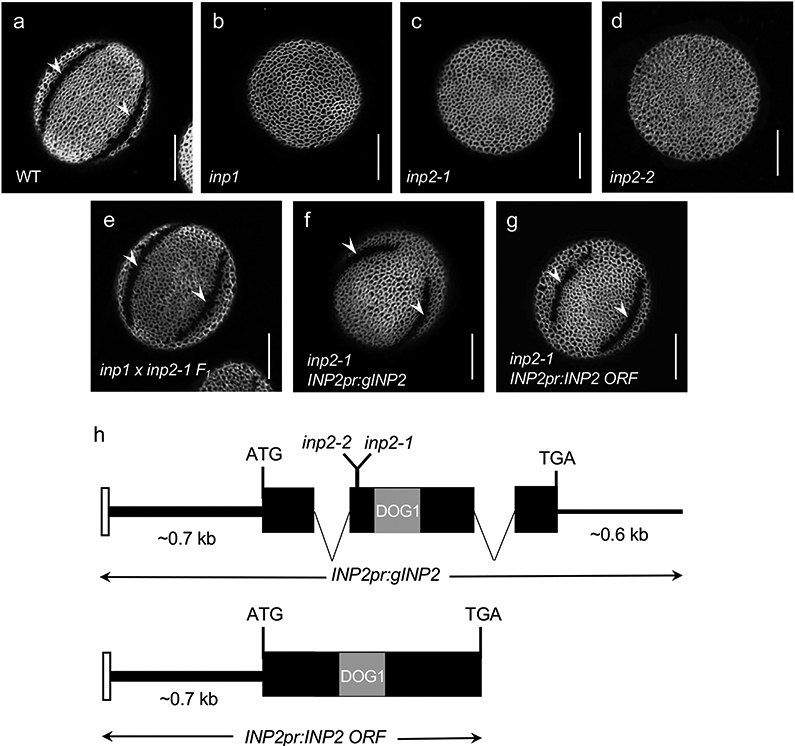
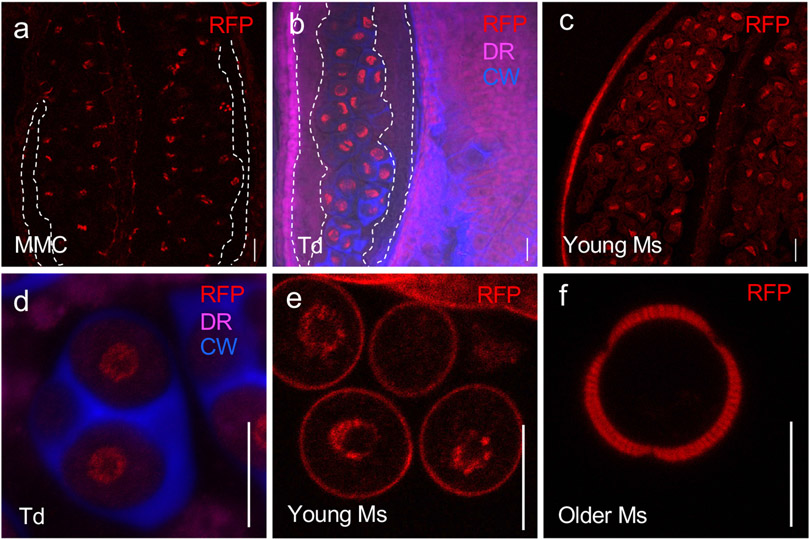
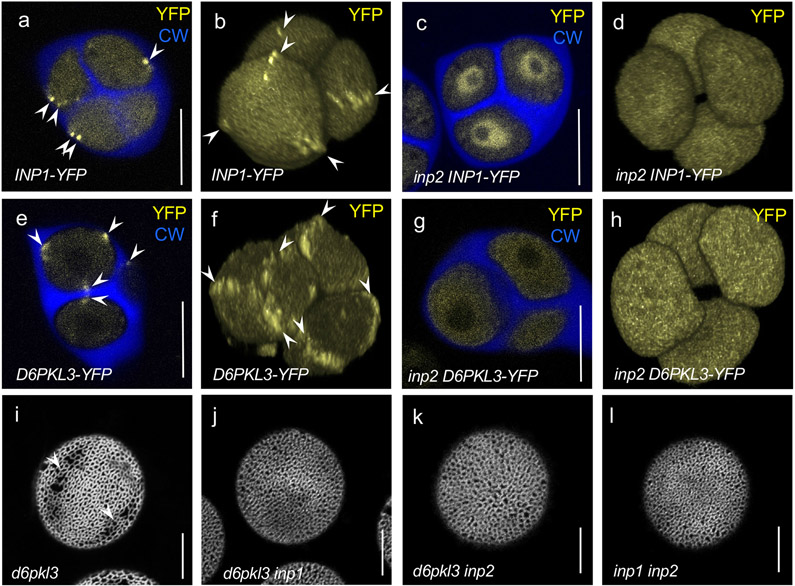
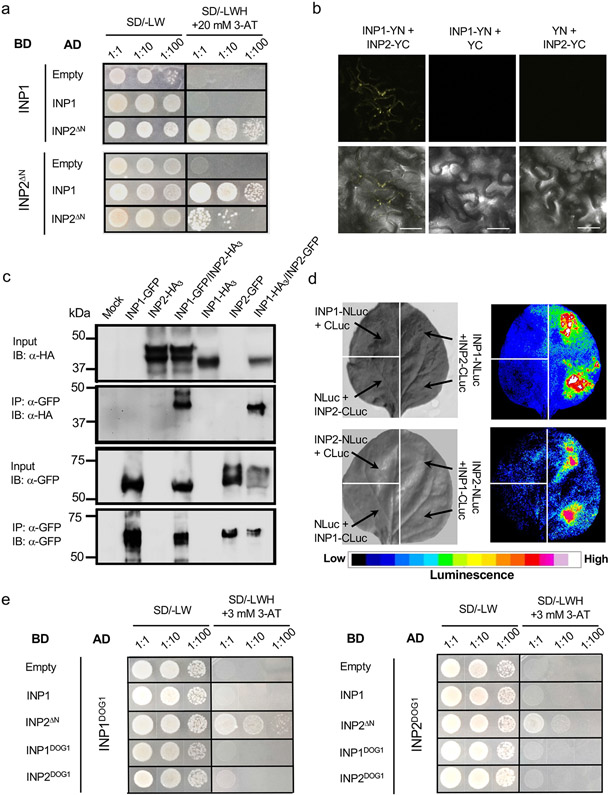
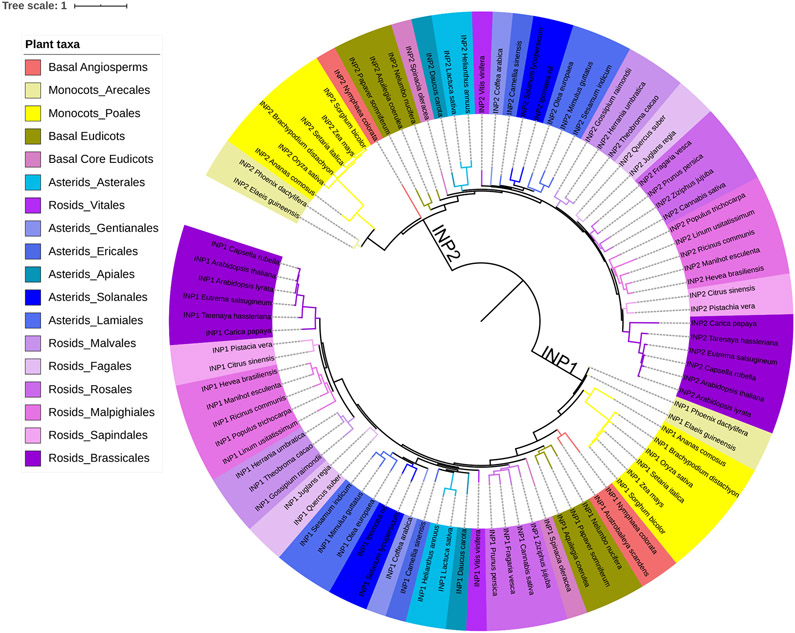
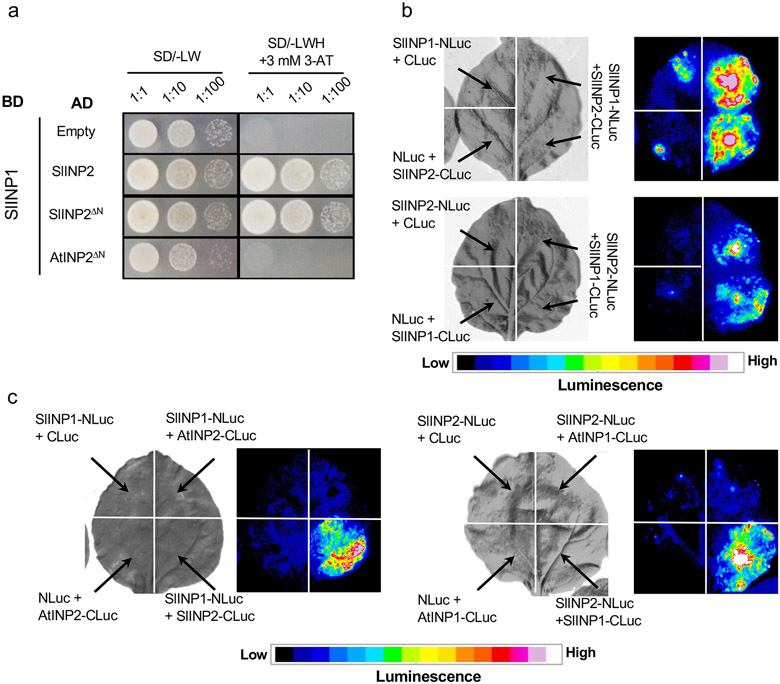
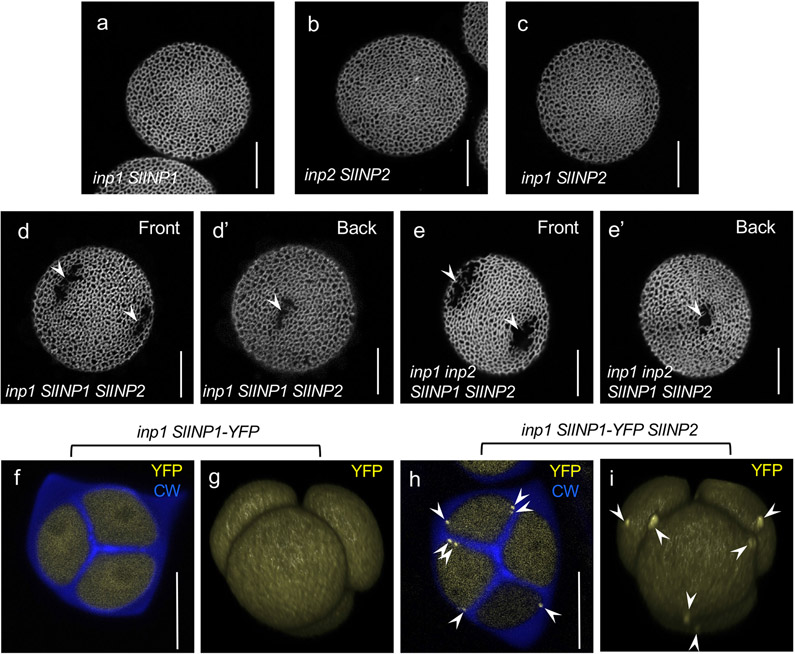
Pollen apertures are an interesting model for the formation of specialized plasma-membrane domains. The plant-specific protein INP1 serves as a key aperture factor in such distantly related species as Arabidopsis, rice and maize. Although INP1 orthologues probably play similar roles throughout flowering plants, they show substantial sequence divergence and often cannot substitute for each other, suggesting that INP1 might require species-specific partners. Here, we present a new aperture factor, INP2, which satisfies the criteria for being a species-specific partner for INP1. Both INP proteins display similar structural features, including the plant-specific DOG1 domain, similar patterns of expression and mutant phenotypes, as well as signs of co-evolution. These proteins interact with each other in a species-specific manner and can restore apertures in a heterologous system when both are expressed but not when expressed individually. Our findings suggest that the INP proteins form a species-specific functional module that underlies formation of pollen apertures.


Figures

Extended Data Fig. 1
Extended Data Fig. 1. INP2 and INP1 display similar expression patterns, with both genes showing highest expression in young developing buds.
The RNA-seq data for INP2 (a) and INP1 (b) are from the dataset of Klepikova et al. (2016) and visualized with the BAR eFP Browser.
Extended Data Fig. 2
Extended Data Fig. 2. INP1 and INP2 proteins both contain the DOG1 domain and have similar structural organization predicted for their C-terminal parts.
a, Protein alignment between INP1 and INP2 proteins. Identical and similar (V/I/L, D/E, K/R, N/Q, and S/T) residues are shaded, respectively, in blue and green. The positions of the DOG1 domains predicted by Pfam are indicated by purple lines. b-c, Protein structures predicted by Phyre2 for C-terminal parts of INP1 (b) and INP2 (c) (confidence: >97% for both proteins). In both cases, the modeled regions cover 114 amino acids, which constitute, respectively, 42% of INP1 and 37% of INP2. The same template (c4clvB, nickel-cobalt-cadmium resistance protein NccX from Cupriavidus metallidurans 31a) was selected by the program in both cases.
Extended Data Fig. 3
Extended Data Fig. 3. Alignment of INP2 proteins from representatives of different angiosperm taxa.
The following species were used (from top to bottom): Papaver somniferum (basal eudicots, Papaveraceae), Arabidopsis thaliana (rosids, Brassicaceae) Capsella rubella (rosids, Brassicaceae), Olea europea (asterids, Oleaceae), Mimulus guttatus (asterids, Phrymacae), Manihot esculenta (rosids, Euphorbiaceae), Solanum lycopersicum (asterids, Solanaceae), Nymphaea colorata (basal angiosperms, ANA, Nympheaceae), Oryza sativa (monocots, Poaceae), Zea mays (monocots, Poaceae), Elaeis guineensis (monocots, Arecaceae), Ananas comosus (monocots, Bromeliaceae). The seven regions selected for creating AtINP2/SlINP2 chimeras are indicated by differently colored rectangles. Aspartate (D) and glutamate (E) residues in the acidic region are shaded in blue. Black shading indicates identical amino acids and grey shading indicates similar amino acids present at the same position in at least half of the aligned proteins.
Extended Data Fig. 4
Extended Data Fig. 4. Arabidopsis INP2 likely contains a transmembrane domain at its N-terminus.
Multiple TM discovery algorithms predict existence of the transmembrane domain at the N-terminus of INP2 from Arabidopsis thaliana (AtINP2), with the consensus score of 0.85 generated by the plant membrane protein database Aramemnon (AramTMCon).
Extended Data Fig. 5
Extended Data Fig. 5. None of the seven AtINP2 regions is sufficient on its own to convert SlINP2 into a protein able to function in Arabidopsis.
Confocal images of pollen grains produced by the transgenic inp2 plants expressing seven versions of chimeric SlINP2 constructs in which one region at a time was replaced with the corresponding regions from AtINP2. At least 10 independent T1 lines were tested for each construct (≥ 50 pollen grains per line), with similar results. Scale bars = 10 μm.
Fig.1
Fig.1. INP2 is a new factor essential for the formation of pollen apertures.
a-g, Confocal images of pollen grains stained with auramine O. Scale bars = 10 μm. a, Wild-type Arabidopsis pollen has three equidistant furrow-like apertures (two are visible here, arrowheads). b, inp1 pollen completely lacks apertures. c-d, Similar to inp1, inp2 pollen has normal exine, but completely lacks apertures (>100 pollen grains were imaged, with similar results; for inp2-2, two independent CRISPR plants were obtained, producing similar phenotypes). e, Pollen of the F1 progeny of the cross between inp1 and inp2 develops normal apertures (arrowheads), indicating that mutations disrupt different genes (eight plants (≥50 pollen grains per plant) were imaged, with similar results). f-g, INP2pr:gINP2 and INP2pr:INP2 ORF transgenes restore apertures (arrowheads) in inp2 (7/8 and 15/15 independent T1 lines, respectively; ≥ 50 pollen grains per line were imaged, with similar results). h, INP2 gene model and structure of the INP2pr:gINP2 and INP2pr:INP2 ORF complementation constructs. Black boxes indicate the protein-coding sequence of At1g15320. The region encoding the DOG1 domain is indicated by the grey box. The white box denotes a short region from the preceding gene, At1g15330, which was included in the constructs. Both the ~0.7 kb upstream region and the ~0.6 kb downstream region were included in the genomic construct. Positions of the inp2-1 and inp2-2 mutations are indicated on the gene model.
Fig. 2
Fig. 2. INP2 is expressed in the male reproductive lineage at the time of aperture formation.
Images of anthers at different developmental stages (a-c) and magnified images of the cells from the male reproductive lineage at different developmental stages (d-f) expressing the transcriptional fusion construct INP2pr:H2B-RFP. Nuclear signal of H2B-RFP (red) is found in dividing microspore mother cells (MMC, a), tetrads of microspores (Td, b, d) and young free microspores (Ms, c, e). Older microspores (f) do not show nuclear H2B-RFP signal (peripheral red signal is due to the autofluorescence of the developing exine). No signal was observed in the tapetal layer of the anther (outlined by the white dashed lines in a, b). Besides RFP, the images in b, d show staining for callose wall (blue, CW, calcofluor white) and membranous structures (magenta, DR, CellMask Deep Red). Five independent T1 lines were imaged, with similar results. Scale bars = 10 μm.
Fig. 3
Fig. 3. INP2 is required for INP1 and D6PKL3 accumulation at the aperture domains and both inp1 and inp2 are epistatic to d6pkl3.
a-h, INP1-YFP and D6PKL3-YFP localization in tetrads of microspores in the presence and absence of INP2. Confocal optical sections (a, c, e, and g) and 3D reconstructions of tetrads of microspores (b, d, f, and h). YFP signal is shown in yellow and callose wall (CW, stained by calcofluor white) is shown in blue. Arrowheads point to the YFP signal at the aperture domains. INP1-YFP localizes to the aperture PM domains in the wild type (a, b) but loses this localization in the inp2 mutant (c, d), instead becoming enriched in the nucleoplasm. Experiments in (c, d) were repeated three times, with similar results. Likewise, D6PKL3-YFP localizes to the aperture domains in the wild type (e, f) but loses this localization in the inp2 mutant (g, h). Experiments in (g, h) were repeated two times, with similar results. i-l, inp1 and inp2 mutations are epistatic to d6pkl3, and do not cause additional phenotypic changes when combined. Confocal images of pollen grains stained with auramine O. d6pkl3 mutant pollen often develops apertures partially covered with exine (arrowheads) (i), whereas double mutants d6pkl3 inp1 (j), d6pkl3 inp2 (k), and inp1 inp2 (l) completely lack apertures. ≥ 3 plants (≥ 50 pollen grains per plant) were imaged in (i-l), with similar results. Scale bars = 10 μm.
Fig. 4
Fig. 4. INP1 and INP2 physically interact.
a, Yeast two-hybrid assay of interaction between INP1 and INP2ΔN (lacking the N-terminal region). BD, DNA-binding domain; AD, activating domain; SD, synthetic defined medium. To test for the presence of both BD and AD constructs, leucine (L) and tryptophan (W) were excluded from the medium. To test for protein interaction, yeast were grown on media lacking L, W, and histidine (H) and containing 20 mM 3-aminotriazole (3-AT). b, BiFC experiments. INP1 and INP2 proteins fused, respectively, to the N- and C-terminal parts of YFP (YN and YC) were co-transformed into tobacco leaves to test for interaction. Co-transformation of INP1-YN with only YC and co-transformation of INP2-YC with only YN were used as negative controls. Top panels show YFP signal in leaf epidermis. Bottom panels show merged YFP and bright-field images. Scale bars = 50 μm. c, Co-immunoprecipitation experiments. INP1-HA3/INP2-GFP and INP1-GFP/INP2-HA3 pairs (or just single tagged proteins as negative controls) were co-expressed in tobacco leaves, precipitated with anti-GFP antibodies and visualized with anti-GFP or anti-HA antibodies. IP, immunoprecipitation; IB, immunoblot. ‘Mock’ indicates protein extract from leaves infiltrated only with buffer. d, Split-luciferase assay. Tobacco leaves were divided into sectors co-expressing indicated proteins containing the N-terminal (NLuc) and C-terminal (CLuc) parts of the firefly luciferase. Panels on the left show the bright-field images and panels on the right show the corresponding luminescence images. e, Yeast two-hybrid assay in which the DOG1 domains of INP1 (INP1DOG1) and INP2 (INP2DOG1) were tested for interaction with each other, self-interaction, and interaction with the full-length INP1 and with INP2ΔN. The description is the same as for a, except that 3 mM 3-AT was used here. Experiments in a-c and e were repeated three times and experiments in d were repeated two times (each time using multiple leaves from multiple plants), with similar results.
Fig. 5
Fig. 5. INP1 and INP2 exhibit similar trends of evolutionary sequence divergence.
Maximum likelihood phylogenetic tree of INP1 and INP2 sequences from a variety of angiosperm taxa (indicated by color coding). The INP1 and INP2 sequences cluster into two separate clades, which display similar topology.
Fig. 6
Fig. 6. INP1 and INP2 interact in a species-specific manner.
a, Yeast two-hybrid assay testing SlINP1 interactions with SlINP2 (or SlINP2ΔN lacking the N-terminal region) and AtINP2DN. BD, DNA-binding domain; AD, activating domain; SD, synthetic defined medium. To test for the presence of both BD and AD constructs, leucine (L) and tryptophan (W) were excluded from the medium. To test for protein interaction, yeast were grown on media lacking L, W, and histidine (H) and containing 3 mM 3-aminotriazole (3-AT). b, Split-luciferase assay testing the ability of SlINP1 and SlINP2 to interact. Tobacco leaves were divided into sectors co-expressing indicated proteins containing the N-terminal (NLuc) and C-terminal (CLuc) parts of the firefly luciferase. Panels on the left show the bright-field images and panels on the right show the corresponding luminescence images. c, Split-luciferase assay testing the ability of INP1 and INP2 from Arabidopsis and tomato to interact with a protein from another species. Only the same-species interactions were observed. The description is the same as for b. All experiments were repeated at least twice, with similar results.
Fig. 7
Fig. 7. Tomato orthologs of INP1 and INP2 fail to function in Arabidopsis when expressed individually but gain this ability when co-expressed.
a-c, Neither SlINP1 (a) nor SlINP2 (b, c) are able to restore apertures in Arabidopsis pollen when expressed on their own. ≥ 10 T1 plants (≥ 50 pollen grains per plant) were analyzed, with similar results. d-e’, When both SlINP1 and SlINP2 are expressed in Arabidopsis, they restore short to medium apertures (arrowheads) in the inp1 (d, d’) and inp1 inp2 (e, e’) Arabidopsis mutants. Confocal images of pollen grains stained with auramine O. Both front and back views are shown for the same pollen grains in (d-d’) and (e-e’) to demonstrate positions of apertures. Experiments were repeated twice, with similar results (~90% of plants had short- to medium-size apertures, and the rest had no apertures). f-i, SlINP1-YFP localizes to the aperture domains in the presence of SlINP2 (h, i) but not when expressed on its own (f, g). Confocal optical sections (f, h) and 3D reconstructions of tetrads of microspores (g, i). YFP signal is shown in yellow and callose wall (CW, stained by calcofluor white) is shown in blue. Arrowheads point to the YFP signal at the aperture domains. Experiments were repeated twice, with similar results. Scale bars = 10 μm
Fig. 8
Fig. 8. Certain regions of INP2 mediate its species specificity.
a, A diagram of 18 INP2 chimeric constructs containing regions from Arabidopsis (At, green) and tomato (Sl, magenta). The protein was divided into seven regions. The ability of a construct to restore apertures in the Arabidopsis inp2 mutant is indicated by ‘+’, the failure to restore apertures is indicated by ‘−’, and the ability to restore apertures in some but not all transgenic lines is indicated by ‘+/−’. b-m, Representative images of pollen grains produced by transgenic inp2 plants expressing different chimeric INP2 constructs. > 10 independent T1 lines were tested for each construct (≥ 50 pollen grains per line), with all or nearly all lines producing similar results, except in h, h’, and k where, as described, some plants produced short apertures and others – no apertures. Apertures are indicated by arrowheads. Scale bars = 10 μm

References

    1. Furness CA & Rudall PJ Pollen aperture evolution – a crucial factor for eudicot success? Trends Plant Sci. 9, 154–158 (2004). - PubMed
    1. Zhou Y & Dobritsa AA Formation of aperture sites on the pollen surface as a model for development of distinct cellular domains. Plant Science 288, 110222 (2019). - PubMed
    1. Heslop-Harrison J An interpretation of the hydrodynamics of pollen. Am. J. Bot 66, 737–743 (1979).
    1. Katifori E, Alben S, Cerda E, Nelson DR & Dumais J Foldable structures and the natural design of pollen grains. PNAS 107, 7635–7639 (2010). - PMC - PubMed
    1. Vieira AM & Feijó JA Hydrogel control of water uptake by pectins during in vitro pollen hydration of Eucalyptus globulus. Am. J. Bot 103, 437–451 (2016). - PubMed

Publication types

MeSH terms

LinkOut - more resources