. 2021 Nov;23(11):2194-2201.
doi: 10.1038/s41436-021-01241-7. Epub 2021 Jun 28.

Can you hear us now? The impact of health-care utilization by rare disease patients in the United States

Affiliations

Can you hear us now? The impact of health-care utilization by rare disease patients in the United States

Angela A Navarrete-Opazo et al. Genet Med. 2021 Nov.

Abstract

Purpose: The vast majority of rare diseases (RDs) are complex, disabling, and life-threatening conditions with a genetic origin. RD patients face significant health challenges and limited treatments, yet the extent of their impact within health care is not well known. One direct method to gauge the disease burden of RDs is their overall cost and utilization within health-care systems.

Methods: The 2016 Healthcare Cost and Utilization Project (HCUP) databases were used to extract health-care utilization data using International Classification of Diseases, Tenth Revision (ICD-10) codes.

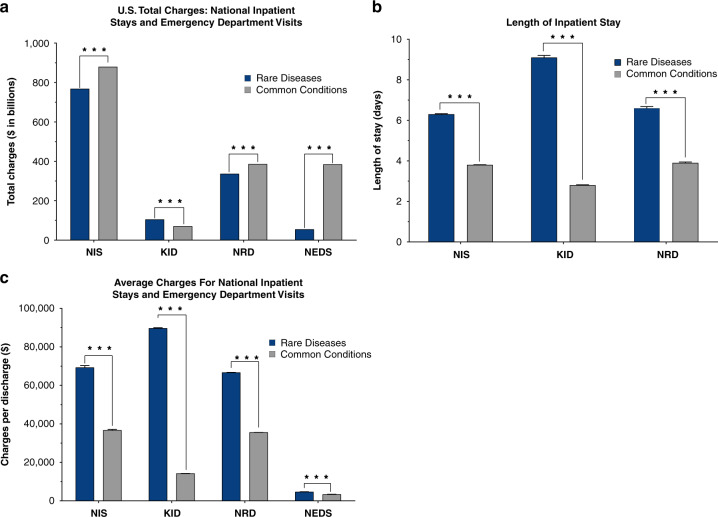
Results: Of 35.6 million national hospital weighted discharges in the HCUP Nationwide Inpatient Sample, 32% corresponded to RD-associated ICD-10 codes. Total charges were nearly equal between RDs ($768 billion) compared to common conditions (CCs) ($880 billion) (p < 0.0001). These charges were a result of higher charges per discharge and longer length of stay (LOS) for RD patients compared to those with CCs (p < 0.0001). Health-care cost and utilization was similarly higher for RDs with pediatric inpatient stays, readmissions, and emergency visits.

Conclusion: Pediatric and adult discharges with RDs show substantially higher health-care utilization compared to discharges with CCs diagnoses, accounting for nearly half of the US national bill.


Conflict of interest statement

The authors declare no competing interests.

Figures

Fig. 1
Fig. 1. Estimated total charges for US health-care utilization of rare diseases (RDs) compared to common conditions (CCs).
RD patient cost burden was significantly higher than patients with common conditions (CCs) across all databases except Nationwide Emergency Department Sample (NEDS). (a) Estimated total charges for the Nationwide Inpatient Sample (NIS) were $768 billion (b) for RDs and $880 billion for CCs. Estimated total charges for RDs for Kids’ Inpatient Database (KID), Nationwide Readmissions Database (NRD), and NEDS were $105 billion, $337 billion, and $55 billion, respectively. Estimated total charges for CCs for KID, NRD, and NEDS were $70 billion, $385 billion, and $384 billion, respectively. All comparisons were p < 0.0001 and estimated total chargers are shown. (b) Estimated charges per discharge for RDs was higher than for CCs. Estimated average charge per discharge for NIS was $69,275 ± 1004 compared to $36,718 ± 389 for CCs (p < 0.0001). Estimated average charge per discharge for KID was $89,681 ± 289 for RDs compared to $14,226 ± 23 for CCs (p < 0.0001). Estimated average charge per discharge for NRD was $66,675 ± 98 for RDs compared to $35,585 ± 28 for CCs (p < 0.0001). Estimated average charge per discharge for NEDS was $4,670 ± 108 for RDs compared to $3,397 ± 76 for CCs (p < 0.0001). Mean cost per discharge shown with error bars indicating standard error. (c) Estimated inpatient length of stay (LOS) for RDs was longer in each Healthcare Cost and Utilization Project (HCUP) database evaluated (NIS, KID, NRD, NEDS) when compared to CCs. Estimated LOS for NIS was 6.3 days compared to 3.8 days for CCs (p < 0.0001). Estimated average charge per discharge for KID was 9.1 days compared to 2.8 days for CCs (p < 0.0001). Estimated average charge per discharge for NRD was 6.6 days compared to 3.9 days for CCs (p < 0.0001). Mean LOS is shown with error bars indicating standard error.

Similar articles

Cited by

References

    1. Stoller JK. The challenge of rare diseases. Chest. 2018;153:1309–14. doi: 10.1016/j.chest.2017.12.018. - DOI - PubMed
    1. Rodwell C, Ayme S. Rare disease policies to improve care for patients in Europe. Biochim Biophys Acta. 2015;1852:2329–35. doi: 10.1016/j.bbadis.2015.02.008. - DOI - PubMed
    1. Shah RR. Regulatory framework for the treatment of orphan diseases. In: Mehta A, Beck M, Sunder-Plassmann G, editors. Fabry Disease: Perspectives from 5 Years of FOS. Oxford. 2006.
    1. Haendel M, Vasilevsky N, Unni D, Bologa C, Harris N, Rehm H, et al. How many rare diseases are there? Nat Rev Drug Discov. 2020;19:77–8. doi: 10.1038/d41573-019-00180-y. - DOI - PMC - PubMed
    1. Nguengang Wakap S, Lambert DM, Olry A, Rodwell C, Gueydan C, Lanneau V, et al. Estimating cumulative point prevalence of rare diseases: analysis of the Orphanet database. Eur J Hum Genet. 2020;28:165–73. doi: 10.1038/s41431-019-0508-0. - DOI - PMC - PubMed