

Extent of transverse sinus stenosis does not predict visual outcomes in idiopathic intracranial hypertension
- PMID: 34183795
- PMCID: PMC9232644
- DOI: 10.1038/s41433-021-01651-6
Extent of transverse sinus stenosis does not predict visual outcomes in idiopathic intracranial hypertension
Abstract
Background: We aimed to investigate whether the degree of transverse sinus stenosis (TSS) on magnetic resonance venography (MRV) can predict visual outcomes in patients with idiopathic intracranial hypertension (IIH).
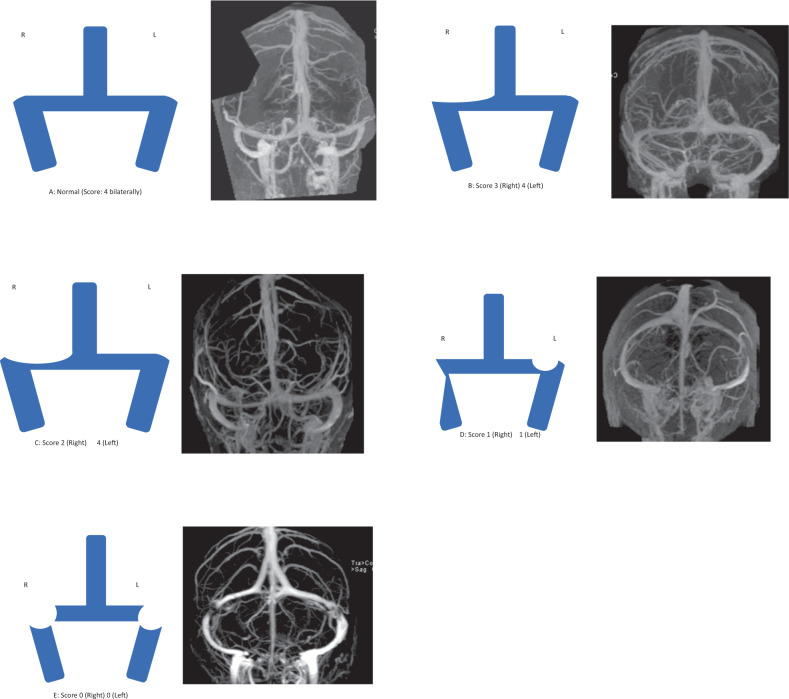
Methods: A chart review identified IIH patients followed for at least 6 months. Mean deviation (MD) on visual field (VF) testing at initial and last follow-up visits, best corrected visual acuity (BCVA), patients' age, body mass index, and lumbar puncture opening pressure were recorded. MRV was used to grade TSS on a scale of 0-8 using the grading scheme proposed by Farb et al., whereby a lower score indicates a greater degree of stenosis. Linear regression analysis was used to test for association between above variables and MD on VF, including change in MD over time.
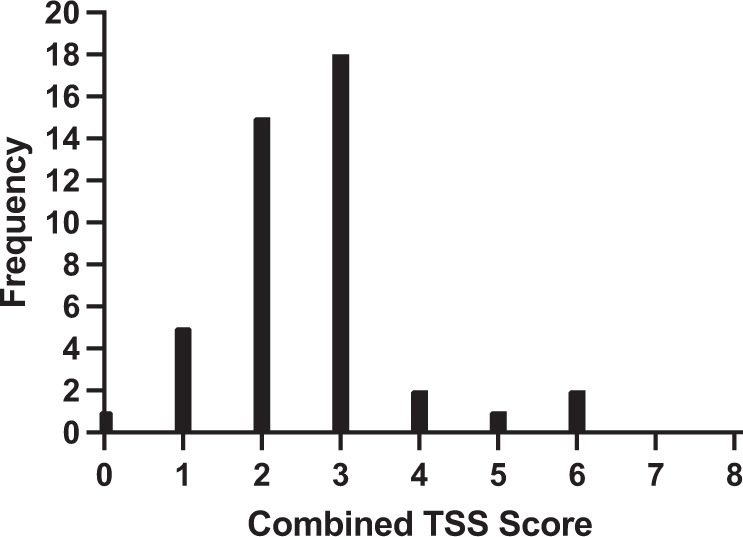
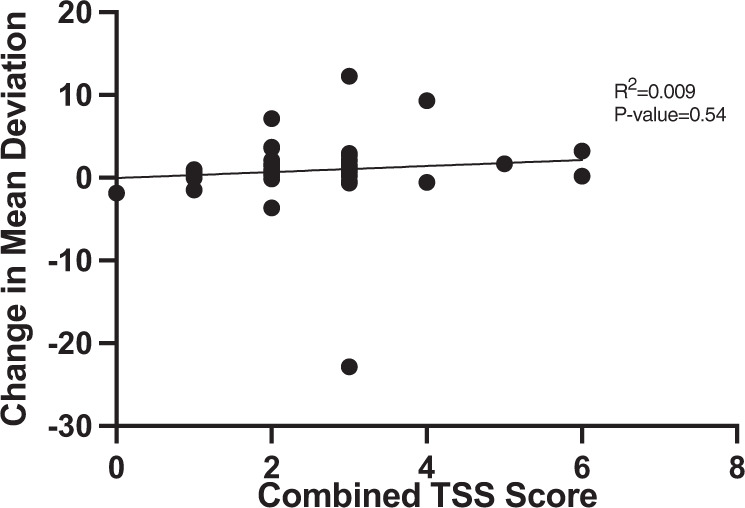
Results: 44 female patients were followed for a median of 26 months. All patients had unilateral or bilateral TSS on MRV. The median TSS score was 3/8. The median BCVA was 0.06 logMAR at baseline. The median VF MD was -3.02 dB at baseline and -1.96 dB at final follow-up. There was no significant association between the degree of TSS and either baseline MD (P-value = 0.34) or the change in MD on VF over the course of follow-up (P-value = 0.54). Baseline BCVA (P = 0.045) and baseline MD (P < 0.001) were the only significant predictors of changes in MD on VF over follow-up.
Conclusions: Baseline BCVA and MD on VF were the only significant predictors of visual outcome in IIH patients. While all patients demonstrated TSS on MRV, the degree of TSS did not correlate with visual prognosis.
© 2021. The Author(s), under exclusive licence to The Royal College of Ophthalmologists.
Conflict of interest statement
The authors declare no competing interests.
Figures


Similar articles
-
Outcomes of Stenting in Atypical Idiopathic Intracranial Hypertension Patients With Transverse Sinus Stenosis.Brain Behav. 2025 Feb;15(2):e70351. doi: 10.1002/brb3.70351. Brain Behav. 2025. PMID: 39972974 Free PMC article.
-
Clinical course of idiopathic intracranial hypertension with transverse sinus stenosis.Neurology. 2013 Jan 15;80(3):289-95. doi: 10.1212/WNL.0b013e31827debd6. Epub 2012 Dec 26. Neurology. 2013. PMID: 23269597 Free PMC article.
-
Association of Extent of Transverse Sinus Stenosis With Cerebral Glymphatic Clearance in Patients With Idiopathic Intracranial Hypertension.Neurology. 2024 Jul 9;103(1):e209529. doi: 10.1212/WNL.0000000000209529. Epub 2024 Jun 4. Neurology. 2024. PMID: 38833652
-
Optic nerve sheath fenestration for treating papilloedema in the era of cerebral venous sinus stenting.Clin Exp Ophthalmol. 2023 May-Jun;51(4):349-358. doi: 10.1111/ceo.14212. Epub 2023 Feb 17. Clin Exp Ophthalmol. 2023. PMID: 36754636 Review.
-
[Idiopathic intracranial hypertension: stent or not].Rev Neurol (Paris). 2012 Oct;168(10):685-90. doi: 10.1016/j.neurol.2012.07.014. Epub 2012 Sep 13. Rev Neurol (Paris). 2012. PMID: 22981295 Review. French.
Cited by
-
Advances in the Understanding of the Complex Role of Venous Sinus Stenosis in Idiopathic Intracranial Hypertension.J Magn Reson Imaging. 2022 Sep;56(3):645-654. doi: 10.1002/jmri.28177. Epub 2022 Mar 31. J Magn Reson Imaging. 2022. PMID: 35357056 Free PMC article. Review.
-
MRI features of idiopathic intracranial hypertension are not prognostic of visual and headache outcome.J Headache Pain. 2023 Jul 28;24(1):97. doi: 10.1186/s10194-023-01641-x. J Headache Pain. 2023. PMID: 37507663 Free PMC article.
-
Progress and recognition of idiopathic intracranial hypertension: A narrative review.CNS Neurosci Ther. 2024 Aug;30(8):e14895. doi: 10.1111/cns.14895. CNS Neurosci Ther. 2024. PMID: 39097911 Free PMC article. Review.
-
Concordance between venous sinus pressure and intracranial pressure in patients investigated for idiopathic intracranial hypertension.J Headache Pain. 2024 Sep 17;25(1):153. doi: 10.1186/s10194-024-01865-5. J Headache Pain. 2024. PMID: 39289632 Free PMC article.
References
-
- Corbett JJ, Savino PJ, Thompson HS, Kansu T, Schatz NJ, Orr LS, et al. Visual loss in pseudotumor cerebri: follow-up of 57 patients from five to 41 years and a profile of 14 patients with permanent severe visual loss. Arch Neurol. 1982;39:461–74. doi: 10.1001/archneur.1982.00510200003001. - DOI - PubMed
MeSH terms
LinkOut - more resources
Full Text Sources
Miscellaneous
