. 2021 Aug;6(8):981-990.
doi: 10.1038/s41564-021-00930-y. Epub 2021 Jun 28.

Single-molecule imaging of LexA degradation in Escherichia coli elucidates regulatory mechanisms and heterogeneity of the SOS response

Affiliations

Single-molecule imaging of LexA degradation in Escherichia coli elucidates regulatory mechanisms and heterogeneity of the SOS response

Emma C Jones et al. Nat Microbiol. 2021 Aug.

Abstract

The bacterial SOS response represents a paradigm of gene networks controlled by a master transcriptional regulator. Self-cleavage of the SOS repressor LexA induces a wide range of cell functions that are critical for survival and adaptation when bacteria experience stress conditions1 including DNA repair2, mutagenesis3,4, horizontal gene transfer5-7, filamentous growth and the induction of bacterial toxins8-12, toxin-antitoxin systems13, virulence factors6,14 and prophages15-17. SOS induction is also implicated in biofilm formation and antibiotic persistence11,18-20. Considering the fitness burden of these functions, it is surprising that the expression of LexA-regulated genes is highly variable across cells10,21-23 and that cell subpopulations induce the SOS response spontaneously even in the absence of stress exposure9,11,12,16,24,25. Whether this reflects a population survival strategy or a regulatory inaccuracy is unclear, as are the mechanisms underlying SOS heterogeneity. Here, we developed a single-molecule imaging approach based on a HaloTag fusion to directly monitor LexA in live Escherichia coli cells, demonstrating the existence of three main states of LexA: DNA-bound stationary molecules, free LexA and degraded LexA species. These analyses elucidate the mechanisms by which DNA binding and degradation of LexA regulate the SOS response in vivo. We show that self-cleavage of LexA occurs frequently throughout the population during unperturbed growth, rather than being restricted to a subpopulation of cells. This causes substantial cell-to-cell variation in LexA abundances. LexA variability underlies SOS gene-expression heterogeneity and triggers spontaneous SOS pulses, which enhance bacterial survival in anticipation of stress.


Conflict of interest statement

Competing interests

The authors declare no conflict of interest.

Figures
Extended Data Fig. 1
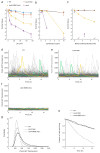
Extended Data Fig. 1. Assessing the functionality of the LexA-Halo fusion.
a, b, c DNA damage sensitivity assays: 10-fold serial dilutions of LB cultures at OD 0.4 were spotted on LB agarose plates and exposed to indicated UV doses (a), or spotted on LB plates containing ciprofloxacin (b), or methyl methanesulfonate (c). Plates were incubated overnight. Control plates were incubated without DNA damage treatment. The percentages of surviving cells are the number of colonies on treatment plates normalised relative to the number of colonies counted for wild-type (WT) without treatment. Data are mean ±SEM from 6 repeats (UV) or 3 repeats (ciprofloxacin, MMS). * indicates zero survival observed. The LexA-Halo fusion strain shows a moderate increase in UV sensitivity compared to the wild-type AB1157 strain, while the SOS deficient strains with non-cleavable LexAG85D mutant or recA- mutation are hypersensitive to UV damage. LexA-Halo shows the same sensitivity to ciprofloxacin and methyl methanesulfonate as the wild-type. d, e, f, Functionality of LexA-Halo fusion assessed in continuous growth conditions: Single-cell fluorescence dynamics of SOS expression reporter PrecA-GFP during unperturbed growth in mothermachine microfluidic chips for cells expressing wild-type LexA (d, 310 cells), LexA-Halo (e, 501 cells), and non-cleavable LexAG85D (f, 446 cells). Two example cell traces are highlighted per strain. The LexA-Halo fusion strains shows SOS expression pulses similar to the wild-type strain. No pulses are seen in the LexA G85D strain. g, Distributions of PrecA-GFP fluorescence for wild-type LexA, LexA-Halo, and LexAG85D strains show that the LexA-Halo fusion is functional in SOS gene repression. The tail in the distribution for LexA-Halo shows functional SOS induction similar to the wild-type strain. The amplitudes of the SOS expression pulses were slightly reduced compared to the wild-type, matching the reduction in UV tolerance (panel A). h, Distributions of cell survival times during growth in microfluidic chips for wild-type LexA, LexA-Halo, and LexAG85D strains confirms functionality of the LexA-Halo fusion.
Extended Data Fig. 2
Extended Data Fig. 2. LexA-Halo complementation and characterization of HaloTag labelling.
a, Testing LexA-Halo functionality by complementation of ΔlexA mutant. Representative phase contrast and fluorescence snapshots from 3 independent biological repeats. The PrecA-GFP reporter shows high fluorescence in a ΔlexA strain because the SOS response is unrepressed. The PrecA-GFP reporter becomes repressed to the same level when the ΔlexA allele is complemented with pBAD plasmids expressing LexA (untagged wild-type gene) or the LexA-Halo fusion construct. The ΔlexA strain without PrecA-GFP reporter is included to show the level of cellular autofluorescence. b, Average PrecA-GFP fluorescence per cell ± SEM and individual measurements from 3 repeats. ΔlexA: 1195 cells; ΔlexA PrecA-GFP: 1268 cells; ΔlexA PrecA-GFP pBAD LexA: 1100 cells; ΔlexA PrecA-GFP pBAD LexA-Halo 1241 cells). c, Histograms of PrecA-GFP fluorescence for pBAD LexA (1100 cells) and pBAD-LexA-Halo (1241 cells) complementation. d, Characterisation of LexA-Halo labelling: Average number of observed LexA-Halo tracks per cell after labelling with different concentrations of TMR dye. The labelling efficiency saturates for TMR concentration > 2.5 µM. Arrow indicates concentration used throughout this study. e, D distributions for LexA-Halo do not depend on the concentration of TMR dye used for labelling. f, LexA degradation is unaffected by TMR labelling. D distributions for LexA-Halo 90 min after 50 J/m2 UV treatment for cells labelled with TMR before treatment (top) and for cells labelled with TMR after UV treatment. g, TMR labelling does not affect cell viability or UV sensitivity. Cells expressing LexA-Halo were prepared and labelled with 2.5 µM TMR using the same protocol as for imaging, or mock-labelled in buffer only. 10-fold serial dilutions were spotted on LB agarose plates and exposed to 50 J/m2 UV light before incubating overnight, or incubated without UV exposure.
Extended Data Fig. 3
Extended Data Fig. 3. Spatial distribution of LexA.
Histograms show the density of LexA-Halo localizations projected onto the long cell axis. Cells were split into 4 classes based on length, < 2.5 µm, 2.5 – 3.5 µm, 3.5 – 4.5 µm, 4.5 – 5.5 µm. In untreated cells, LexA localizations reflect the typical spatial distribution of the nucleoid that splits into two lobes as cells elongate. This spatial pattern is largely absent in cells 180 min after treatment with 50 J/m2 UV when LexA-Halo has been largely converted into free HaloTag. Untreated cells: 4 repeats, 466 cells, 500284 localizations; UV-treated cells: 3 repeats, 164 cells, 103475 localizations.
Extended Data Fig. 4
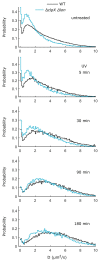
Extended Data Fig. 4. Comparison of LexA diffusion in ΔclpX Δlon and wild-type strains without treatment and after exposing cells to a pulse of 50 J/m2 UV.
Combined data from N = 3 repeats per time point. Untreated WT: N = 9 repeats, 2528 cells, 384241 tracks. Untreated ΔclpX Δlon: 458 cells, 33239 tracks. 5 min WT: 280 cells, 23452 tracks. 5 min ΔclpX Δlon: 238 cells, 11249 tracks. 30 min WT: 295 cells, 15408 tracks. 30 min ΔclpX Δlon: 258 cells, 17578 tracks. 90 min WT: 333 cells, 18338 tracks. 90 min ΔclpX Δlon: 232 cells, 17995 tracks. 180 min WT: 307 cells, 18391 tracks. 180 min ΔclpX Δlon: 250 cells, 10858 tracks.
Extended Data Fig. 5
Extended Data Fig. 5. Quantifying relative abundances of LexA populations.
a, Bound, free, and degraded LexA populations were quantified by fitting a mixture model to D distributions using least squares optimization (3 repeats for each condition), as described in the Materials and Methods. The D distribution of LexA-Halo from fixed cells was used as a model for the bound population (dark blue curve). The mobile part of the D distribution for the non-cleavable LexAK156A mutant was used as a model for the free population (light blue curve). The mobile part of the D distribution for the unconjugated HaloTag was used to model the degraded population (yellow curve). The model distributions were smoothed using moving mean filters. b, Fitted mixture model for LexA-Halo in untreated wild-type cells.
Extended Data Fig. 6
Extended Data Fig. 6. Dynamics of LexA populations after UV exposure
a, Relative abundances of degraded (yellow), free (light blue), and DNA-bound (dark blue) LexA populations after exposing cells to a pulse of 50 J/m2 UV. LexA populations were quantified by fitting a mixture model to D distributions at different time points post UV using least squares optimization as shown in Extended Data Fig. 7 (error bars: SEM, 3 repeats, average numbers per time point: 304 cells, 15365 tracks). Lines show moving mean curves. b, Decay of bound LexA population post UV exposure of 5 J/m2 (blue), 20 J/m2 (orange), or 50 J/m2 (grey), 1 repeat per condition. c, Decay rate constants were obtained from exponential fits of the data in panel b. Error bars: ± 95% confidence intervals. The decay of the bound LexA population is slower than that of the free LexA population (Fig. 2e), and the rate does not scale with UV dose. d, e, f Dynamics of LexA populations post 50 J/m2 UV exposure for cells carrying empty pUC19 plasmid, pUC19 with PdinG or PsulA (error bars: SEM, N = 3 biologically independent experiments. Average numbers per time point pUC19 empty: 232 cells, 5669 tracks; PdinG: 273 cells, 13186 tracks; PsulA: 290 cells, 18724 tracks). Bound population (d), free population (e), degraded population (f).
Extended Data Fig. 7
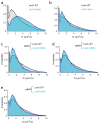
Extended Data Fig. 7. D distributions for mutant strains and LexA variants.
a, LexA-Halo in wild-type (grey, 9 repeats, 2528 cells, 384241 tracks) and Δdam (blue, 3 repeats, 911 cells, 186197 tracks) strain backgrounds. b, LexA-Halo in wild-type (grey, 9 repeats, 2528 cells, 384241 tracks) and recA- (blue, 3 repeats, 854 cells, 41528 tracks) strain backgrounds. c, Wild-type LexA-Halo (grey, 5 repeats, 1265 cells, 99306 tracks) and non-cleavable LexAK156A mutant (blue, 3 repeats, 368 cells, 24343 tracks), both expressed from pBAD plasmid. d, Wild-type LexA-Halo (grey, 5 repeats, 1265 cells, 99306 tracks) and auto-cleavage deficient LexAV82S mutant (blue, 3 repeats, 1096 cells, 116653 tracks), both expressed from pBAD plasmid. e, Wild-type LexA-Halo (grey, 5 repeats, 1265 cells, 99306 tracks) expressed from pBAD plasmid in wild-type (grey) and recA- (blue, 934 cells, 3 repeats, 1511 cells, 153981 tracks) strain backgrounds.
Extended Data Fig. 8
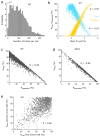
Extended Data Fig. 8. Quantification of LexA populations in single cells.
a, Distribution of the number of tracks per cell for LexA-Halo wild-type. b, The abundances of Pfree and Pdegraded are highly correlated with the average diffusion coefficient of LexA-Halo per cell. Each dot represents a single cell from the wild-type LexA-Halo strain. R: Pearsson’s correlation coefficient. c, d, Plots of Pfree versus Pdegraded show that increased level of LexA degradation is correlated with a loss of the pool of free LexA in individual cells from the wild-type and the Δdam strain background. R: Pearsson’s correlation coefficient. e, Evaluation of the statistical fitting error for single cells: Recorded movies were split into two halves, and single-cell quantification of LexA populations was performed independently for each movie half. Pfree from the two movie segments are correlated (R: Pearsson’s correlation coefficient) with a mean absolute difference of 16%, showing that the cell-to-cell variation in LexA abundances is not due to fitting uncertainty. Note that the actual fitting uncertainty is yet lower because the analysis includes the full-length movie data.
Extended Data Fig. 9
Extended Data Fig. 9. Spontaneous SOS expression pulses are associated with a cell cycle delay.
a, Snapshots of PrecA-GFP expression reporter for untreated cells growing in microfluidic channels. Continuous scale of spontaneous SOS induction levels in wild-type cells. b, No SOS expression pulses are seen in the LexAG85D mutant strain. Identical greyscale as in panel a. c, Histogram of cell cycle durations for wild-type cells growing in microfluidic channels. All cell cycles (grey, 16076 cycles), cell cycles that contain a PrecA-GFP expression pulse (blue, 1013 cycles), cell cycles that contain a PrecA-GFP expression pulse with amplitude > 2000 a.u. (orange, 102 cycles). Percentage of cell cycles with duration > 60 min shown for each category (dashed line). 3 repeats. d, PrecA-GFP pulse amplitude plotted versus the duration of the cell cycle that contained the pulse (3 repeats, 1013 pulses). Pulse amplitude and cell cycle duration are correlated, R: Pearsson’s correlation coefficient. Moving average curve (blue line) shows a minor cell cycle delay for small PrecA-GFP pulses, but a strong delay for pulses with amplitude > 2000 a.u.
Extended Data Fig. 10
Extended Data Fig. 10. No correlation between LexA variability and expression of a gene that is not part of the SOS regulon.
Imaging PpolA-GFP expression and tracking LexA-Halo diffusion in the same cells shows that there is no correlation between gene expression and the free LexA abundance per cell. Each dot represents a single cell. Black line shows linear fit; R: Pearsson’s correlation coefficient.
Fig. 1
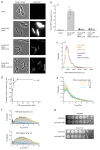
Fig. 1. Live-cell single-molecule tracking of LexA repressor.
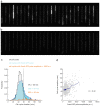
a, Schematic of LexA-Halo tracking approach. b, Transmitted light image of an example cell with LexA-Halo tracks coloured according to the diffusion coefficient per molecule. c, D distribution of LexA-Halo in untreated wild-type cells (9 repeats, 2528 cells, 384241 tracks). d, D distributions for pBAD-expressed LexA-Halo mutants with increased DNA-binding affinity, E71K (blue, 3 repeats, 896 cells, 88432 tracks), E45K (blue, 3 repeats, 887 cells, 70496 tracks), compared to pBAD-expressed wild-type LexA-Halo (grey, 5 repeats, 1265 cells, 99306 tracks). Distributions are combined data from all repeats. Insets: Mean Pbound ± SEM with p-values from two-sided t-tests and individual measurements of biologically independent repeats. e, D distributions for wild-type LexA-Halo in cells carrying empty pUC19 plasmid (grey 3 repeats) or pUC19 with LexA-regulated promoter PsulA (blue, 5 repeats). Inset: Mean Pbound ± SEM and individual measurements of 3 biologically independent repeats for cells with empty pUC19 (314 cells, 15314 tracks), pUC19 with LexA-independent promoter PpolA (806 cells, 27747 tracks), pUC19 with SOS promoters PdinG (504 cells, 20636 tracks), PsulA (5 repeats, 822 cells, 46802 tracks), PrecN (659 cells, 35285 tracks). Scale bar: 1 μm.
Fig. 2
Fig. 2. Dynamics of LexA cleavage and degradation in response to DNA damage.
a, D distributions for LexA-Halo in untreated cells and at indicated times post 50 J/m2 UV fitted with mixture model (dashed lines) of LexA populations Pbound (dark blue), Pfree (light blue), Pdegraded (yellow). Combined data from 3 repeats per time point. Untreated: 9 repeats, 2528 cells, 384241 tracks. 5 min: 280 cells, 23452 tracks. 30 min: 295 cells, 15408 tracks. 90 min: 333 cells, 18338 tracks. 180 min: 307 cells, 18391 tracks. b, D distribution for unconjugated HaloTag expressed in untreated cells (3 repeats, 314 cells, 84763 tracks). c, SDS-PAGE ingel TMR fluorescence from cells expressing LexA-Halo, unconjugated HaloTag, LexA-Halo at 120 min post 50 J/m2 UV exposure. The additional band for unconjugated HaloTag includes the protein linker. Representative gel from 3 biologically independent experiments. d, Average D of LexA-Halo after 50 J/m2 UV in wild-type (black) and ΔclpX Δlon (blue) strains with moving average curves (error bars: SEM, N = 3 biologically independent experiments, average numbers per time point WT: 304 cells, 15365 tracks; ΔclpX Δlon: 245 cells, 13216 tracks.). Average D ± SEM of unconjugated HaloTag in untreated cells shown for reference (N = 3, yellow line and shaded area). e, Decay of free LexA pool post UV exposure 5 J/m2 (blue, 77 cells, 2986 tracks), 20 J/m2 (orange, 44 cells, 2973 tracks), 50 J/m2 (black, 84 cells, 6757 tracks). Average numbers per time point; 1 repeat per condition. Inset: decay half-life from exponential fits; error bars: 95% CI. f, D distributions for pBAD-expressed LexAG124D-Halo mutant and wild-type LexA-Halo from untreated cells (WT: 735 cells, 32583 tracks; G124D: 460 cells, 27215 tracks), after 50 J/m2 UV at 60 min (WT: 595 cells, 30969 tracks; G124D: 736 cells, 13026 tracks) and 120 min (WT: 610 cells, 21528 tracks; G124D: 686 cells, 21724 tracks). Combined data from 3 repeats per time point. g, Decay of the bound LexA population post 50 J/m2 UV exposure for cells carrying empty pUC19 plasmid, pUC19 with PdinG or PsulA (lines: moving average, error bars: SEM, N = 3 biologically independent experiments. Average numbers per time point: pUC19 empty: 232 cells, 5669 tracks; PdinG: 273 cells, 13186 tracks; PsulA: 290 cells, 18724 tracks) h, Schematic for SOS induction via LexA degradation.
Fig. 3
Fig. 3. Spontaneous LexA degradation in untreated cells is highly heterogeneous.
a, Abundance of degraded LexA-Halo population per cell in wild-type (14 repeats, 2756 cells), Δdam (3 repeats, 889 cells), recA- (3 repeats, 640 cells) strains. pBAD-expressed wild-type LexA-Halo (5 repeats, 977 cells), LexAK156A-Halo (3 repeats, 268 cells), wild-type LexA-Halo in recA- strain (3 repeats, 1294 cells), LexAV82S-Halo (3 repeats, 916 cells). Boxes: 25-75% percentile, blue dots: averages, lines: medians, grey dots: individual cells, p-values from two-sided t-tests of biologically independent experiments. b, In-gel fluorescence from pBAD-expressed LexA-Halo wild-type, LexAK156A-Halo, LexA-Halo wild-type in recA- strain, LexAV82S-Halo. Representative gels from 3 biologically independent experiments. c, Transmitted light image of untreated wild-type cells with LexA-Halo tracks coloured according to the diffusion coefficient per molecule. Scale bar: 2 μm. D distributions of example cells with mixture model for Pbound, Pfree, Pdegraded populations. d, e, f, Abundance of free LexA-Halo population per cell for wild-type (14 repeats, 2756 cells), Δdam strains (3 repeats, 889 cells), pBAD-expressed wild-type (5 repeats, 977 cells), LexAK156A-Halo (3 repeats, 268 cells), and for wild-type LexA-Halo at 30 min (3 repeats, 220 cells) and 180 min (3 repeats, 248 cells) post 50 J/m2 UV.
Fig. 4
Fig. 4. Variability in LexA degradation underlies spontaneous SOS induction and expression heterogeneity.
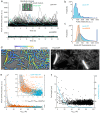
a, Mothermachine microfluidic data showing single-cell dynamics of PrecA-GFP fluorescence for cells expressing wild-type LexA (3 repeats, 1095 cells), LexAG85D (2 repeats, 769 cells). Example cell traces highlighted. b, Distribution of PrecA-GFP pulse amplitudes (3 repeats, 1095 cells, 1136 pulses). c, Distributions of PrecA-GFP fluorescence for wild-type (3 repeats, 1095 cells) and LexAG85D (2 repeats, 774 cells) strains (vertical lines: distribution modes). d, LexA-Halo tracks on transmitted light image and PrecA-GFP fluorescence in single cells. Scale bars: 2 μm. Representative image from 3 biologically independent experiments. e, PrecA-GFP versus free LexA abundance per cell for wild-type (blue dots, 3 repeats, 832 cells), Δdam (orange dots, 3 repeats, 521 cells) strains. Grey area: Gene regulatory function for PrecA (I) controlled by Pfree with total concentration of LexA dimers = 650 nM and PrecA affinity kD between 2-10 nM. Inset: expanded section indicated by arrow. f, Left axis: Cell length versus free LexA abundance per cell (black dots, 9 repeats, 2504 cells). Right axis: Percentage of filamentous cells (length > 5μm) across a moving average of free LexA abundance per cell (blue line).

References

    1. Baharoglu Z, Mazel D. SOS, the formidable strategy of bacteria against aggressions. FEMS Microbiol Rev. 2014;38:1126–1145. - PubMed
    1. Courcelle J, Khodursky A, Peter B, Brown PO, Hanawalt PC. Comparative gene expression profiles following UV exposure in wild-type and SOS-deficient Escherichia coli. Genetics. 2001;158:41–64. - PMC - PubMed
    1. Schlacher K, Goodman MF. Lessons from 50 years of SOS DNA-damage-induced mutagenesis. Nat Rev Mol Cell Biol. 2007;8:587–594. - PubMed
    1. Uphoff S. Real-time dynamics of mutagenesis reveal the chronology of DNA repair and damage tolerance responses in single cells. Proc Natl Acad Sci. 2018;115:E6516–E6525. - PMC - PubMed
    1. Beaber JW, Hochhut B, Waldor MK. SOS response promotes horizontal dissemination of antibiotic resistance genes. Nature. 2004;427:72–74. - PubMed

Publication types

MeSH terms