. 2021 Jul;13(7):626-633.
doi: 10.1038/s41557-021-00736-9. Epub 2021 Jun 28.

Chemical profiling of DNA G-quadruplex-interacting proteins in live cells

Affiliations

Chemical profiling of DNA G-quadruplex-interacting proteins in live cells

Xiaoyun Zhang et al. Nat Chem. 2021 Jul.

Abstract

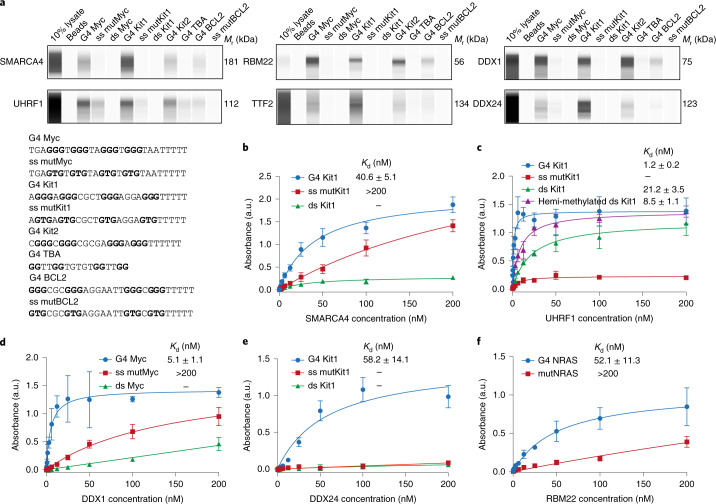
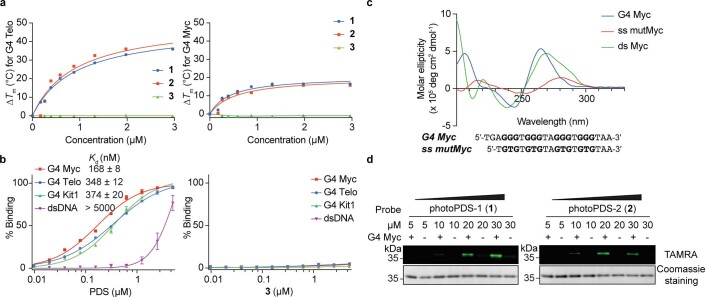
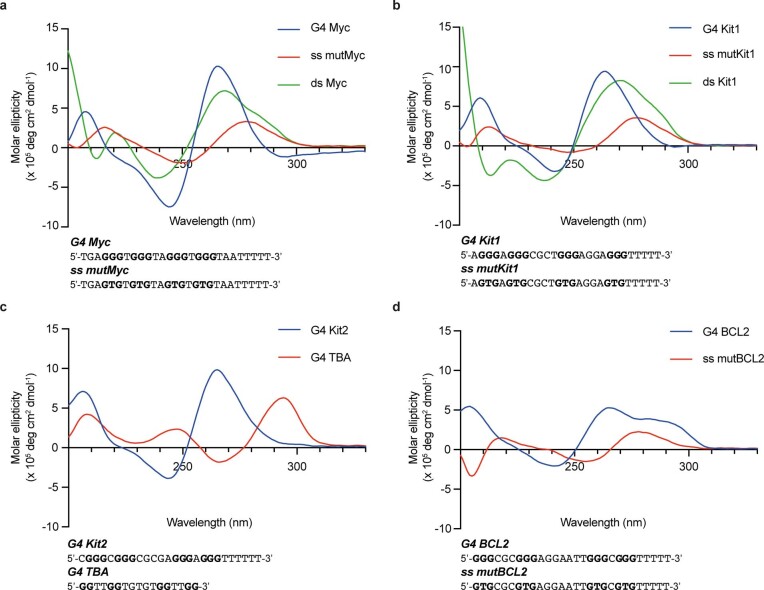
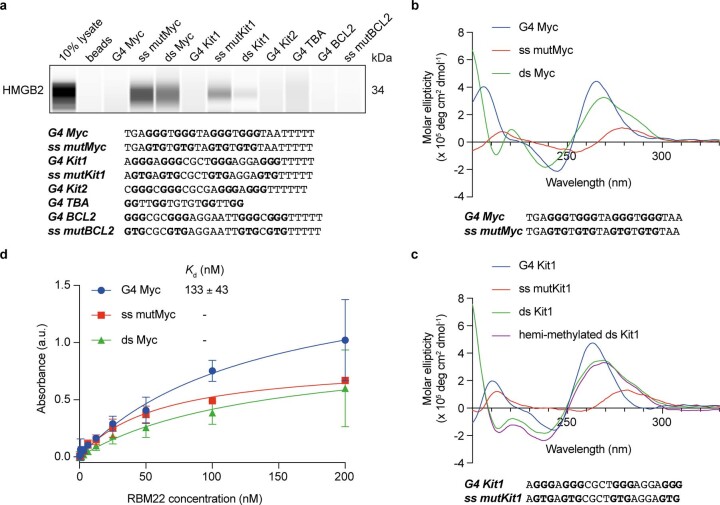
DNA-protein interactions regulate critical biological processes. Identifying proteins that bind to specific, functional genomic loci is essential to understand the underlying regulatory mechanisms on a molecular level. Here we describe a co-binding-mediated protein profiling (CMPP) strategy to investigate the interactome of DNA G-quadruplexes (G4s) in native chromatin. CMPP involves cell-permeable, functionalized G4-ligand probes that bind endogenous G4s and subsequently crosslink to co-binding G4-interacting proteins in situ. We first showed the robustness of CMPP by proximity labelling of a G4 binding protein in vitro. Employing this approach in live cells, we then identified hundreds of putative G4-interacting proteins from various functional classes. Next, we confirmed a high G4-binding affinity and selectivity for several newly discovered G4 interactors in vitro, and we validated direct G4 interactions for a functionally important candidate in cellular chromatin using an independent approach. Our studies provide a chemical strategy to map protein interactions of specific nucleic acid features in living cells.


Conflict of interest statement

S.B. is a founder and shareholder of Cambridge Epigenetix Ltd. S.M.C. and S.A. are now employees of AstraZeneca. All the other authors have no competing interests.

Figures

Fig. 1
Fig. 1. Schematic for CMPP.
a, A G-tetrad stabilized by Hoogsteen base pairing and a monovalent cation (top), and an intramolecular G4 structure formed by the stacking of G-tetrads (bottom). b, Schematic representation of the CMPP concept. Cells are treated with G4-ligand probes that are functionalized with a photoreactive diazirine group and a click alkyne handle. The probes are recruited to endogenous G4 binding sites, where ultraviolet irradiation triggers the proximity capture of co-binding G4-interacting proteins.
Fig. 2
Fig. 2. Co-binding-mediated proximity capture of a G4 binding protein in vitro.
a, Chemical structures of G4-ligand probes photoPDS-1 (1), photoPDS-2 (2) and the control probe 3. b, Thermal melting shifts of G4 Kit1 (left) and dsDNA (right) induced by increasing concentrations of 1, 2 and 3. The increase in melting temperature (ΔTm) was measured by a fluorescence resonance energy transfer melting assay. The mean is from two independent experiments (n = 2). c, Fluorescence quenching induced by increasing the concentrations of probes 1, 2 and 3 bound to different G4 structures (G4 Myc, G4 Kit1 and G4 Telo) and dsDNA. The apparent Kd values are shown. Mean and error (± standard deviation (s.d.)) are from four independent experiments (n = 4). d, Schematic representation of the co-binding-mediated proximity capture of BG4 in vitro. e, Gel scans (probe, 10 μM) showing fluorescence images of co-binding-mediated proximity labelling of BG4 (molecular mass ~31 kDa) by 1, 2 and 3. Representative images from three independent experiments with similar results are shown. Source data
Fig. 3
Fig. 3. Profiling of G4 interactomes in human cells.
a, Schematic workflow of the in situ mapping of G4-interacting proteins in HEK293T cells. b, Gel-based global profiling of G4-interacting proteins using probes (20 μM) 1 and 2 versus 3. TAMRA and Coomassie staining represent probe-specific labelling and total loading proteins, respectively. A representative image from three independent experiments with similar results is shown. c, Volcano plot displaying enriched proteins (highlighted in green and orange, respectively) for probe 1 versus 3 (n = 248). d, Volcano plot displaying enriched proteins (highlighted in green and orange, respectively) for probe 2 versus 3 (n = 209). Proteins were considered enriched with a >2-fold signal over control and a FDR <0.05. e, Overlap between enriched proteins in c and d in comparison with the known G4-associated proteins as available in G4IPDB. Orange dots in c and d represent the enriched known G4-associated proteins. f,g, Distribution of the top UniprotKB keywords for biological process (f) and molecular function (g) of all the enriched proteins (256). DMSO, dimethylsulfoxide. Source data
Fig. 4
Fig. 4. Validation of novel nuclear G4-selective binding proteins.
a, Affinity enrichment coupled with western blot analysis of selected candidates for different topologies of G4 structures and control oligonucleotides (G-runs are highlighted in bold). A representative blot from two independent experiments with similar results is shown. be, Binding curves (the indicated Kd values were generated by ELISA) for the human recombinant full-length SMARCA4 protein to G4 Kit1, the single-stranded mutant (ss mutKit1) and double-stranded Kit1 (ds Kt1) (b), UHRF1 protein to G4 Kit1, ss mutKit1, Kit1 hemi-methylated dsDNA and ds Kit1 (c), DDX1 protein to G4 Myc, ss mutMyc and ds Myc (d), DDX24 protein to G4 Kit1, ss mutKit1 and ds Kit1 (e) and RBM22 protein to G4 NRAS and its mutant (mutNRAS) (f). Mean and error (± s.d.) are from three independent experiments (n = 3). a.u., arbitrary units. Source data
Fig. 5
Fig. 5. SMARCA4 is enriched at endogenous G4s.
a, Example genome browser view for XYLB, TMCC6 and LARP1. Signal tracks from ChIP-seq and control input as well as consensus peaks are shown for SMARCA4 (black) and G4s (blue). Sequences that have the biophysical potential to form G4s are shown for plus and minus strands (potential G4s, grey). b, Overlap of SMARCA4 and endogenous G4 high-confidence peaks. c, Occupancy profiles of SMARCA4 endogenous G4 sites (left) and potential G4s (right). d, Proportion of SMARCA4 and G4 ChIP-seq peaks across different genomic features. TSS, transcription start site; UTR, untranslated region; TES, transcription end site; Rep, replicate. Source data
Extended Data Fig. 1
Extended Data Fig. 1. Probes for co-binding-mediated proximity labelling of BG4 in vitro.
a, Assessment of G4-ligand probes (1-3) of inducing thermal stabilization (ΔTm) on G4 Telo and G4 Myc using FRET melting assay. ΔTm of 1 and 2 at 1 μM on G4 Telo are 25 °C and 27 °C, respectively. ΔTm of 1 and 2 at 1 μM on G4 Myc, are 14 °C and 13 °C, respectively. While ΔTm of 3 at 1 μM is 0. Mean is represented from two independent experiments (n = 2). b, Assessment of G4-binding affinity of PDS and 3 using fluorescence titration binding assay by measuring apparent Kd values. Mean and error (± S.D.) are represented from four independent experiments (n = 4). c, Structure verification of G4 Myc, single-stranded mutMyc and double-stranded Myc with circular dichroism (G-runs are highlighted in bold). Mean of three independent experiments (n = 3) is represented. d, Dose-dependent of CMPP of BG4 by 1 and 2. Signals from TAMRA and Coomassie staining represent probe-specific labelling and loading input, respectively. Representative images from three independent experiments with similar results are shown. Source data
Extended Data Fig. 2
Extended Data Fig. 2. Gel-based mapping of DNA G4-interacting proteins in human cells.
a, Probe 1 and b, probe 2 display dose-depend protein labelling of nuclear proteomes in HEK293T cells. Representative gel images from three independent experiments with similar results are shown. c, CellTiter-Glo luminescent cell viability assay on probe treatment for 75 min to HEK293T cells under all conditions used in this study. Mean and error (± S.D.) are represented from four independent experiments (n = 4). Source data
Extended Data Fig. 3
Extended Data Fig. 3. Structure verification of oligonucleotides.
CD spectra obtained here match previously reported spectra of the well-characterized DNA G4 sequences (G-runs are highlighted in bold, see Supplementary Table 3) with different topologies showing distinct bands,, including parallel a,G4 Myc b, G4 Kit1 and c, G4 Kit2 by positive at ~260 nm and negative at ~240 nm; anti-parallel G4 TBA by positive at ~290 nm and ~240 nm, and negative at ~260 nm; d, hybrid G4 BCL2 by positive at ~290 nm and ~260 nm, and negative at ~240 nm. All G4 structures also share a positive band at ~210 nm. While the corresponding single-stranded mutant and duplex controls have lost these features. Mean of three independent experiments (n = 3) is represented. Source data
Extended Data Fig. 4
Extended Data Fig. 4. Protein validation by affinity enrichment coupled with western blot analysis and ELISA.
a, Affinity enrichment coupled with western blot analysis of HMGB2 for different topologies of G4 structures and control oligonucleotides. A representative blot from two independent experiments with similar results is shown. Structure verification of G4 Myc (b) and G4 Kit1 (c) and the indicated control oligonucleotides with CD spectroscopy. Curves are plotted by mean values of three independent experiments (n = 3). d, Binding curves with indicated dissociation constants (Kd) generated by ELISA for human recombinant full-length RBM22 protein to DNA G4 Myc, single-stranded mutant and Myc duplex DNA. Mean and error (± S.D.) are represented from three independent experiments (n = 3). G-runs are highlighted in bold. Source data
Extended Data Fig. 5
Extended Data Fig. 5. Properties of SMARCA4 binding sites.
a, Overlap of binding sites identified by SMARCA4 ChIP-seq in K562 chromatin across three biological replicates. Binding sites identified in at least two replicates were considered as high confidence binding sites. b, Binding motifs identified in SMARCA4 binding sites that are marked by or lack and endogenous G4. The top3 motifs identified by EM for Motif Elicitation (MEME) analysis are shown.

Comment in

  • Deciphering nucleic acid knots.
    Fleming AM, Burrows CJ. Fleming AM, et al. Nat Chem. 2021 Jul;13(7):618-619. doi: 10.1038/s41557-021-00739-6. Nat Chem. 2021. PMID: 34183816 No abstract available.

References

    1. Hudson WH, Ortlund EA. The structure, function and evolution of proteins that bind DNA and RNA. Nat. Rev. Mol. Cell Biol. 2014;15:749–760. doi: 10.1038/nrm3884. - DOI - PMC - PubMed
    1. Aebersold R, Mann M. Mass-spectrometric exploration of proteome structure and function. Nature. 2016;537:347–355. doi: 10.1038/nature19949. - DOI - PubMed
    1. Ummethum H, Hamperl S. Proximity labeling techniques to study chromatin. Front. Genet. 2020;11:450. doi: 10.3389/fgene.2020.00450. - DOI - PMC - PubMed
    1. Mohammed H, et al. Rapid immunoprecipitation mass spectrometry of endogenous proteins (RIME) for analysis of chromatin complexes. Nat. Protoc. 2016;11:316–326. doi: 10.1038/nprot.2016.020. - DOI - PubMed
    1. Rafiee M-R, Girardot C, Sigismondo G, Krijgsveld J. Expanding the circuitry of pluripotency by selective isolation of chromatin-associated proteins. Mol. Cell. 2016;64:624–635. doi: 10.1016/j.molcel.2016.09.019. - DOI - PMC - PubMed

Publication types