. 2021 Aug;16(8):3874-3900.
doi: 10.1038/s41596-021-00562-w. Epub 2021 Jun 28.

Coculture of primary human colon monolayer with human gut bacteria

Affiliations

Coculture of primary human colon monolayer with human gut bacteria

Jianbo Zhang et al. Nat Protoc. 2021 Aug.

Abstract

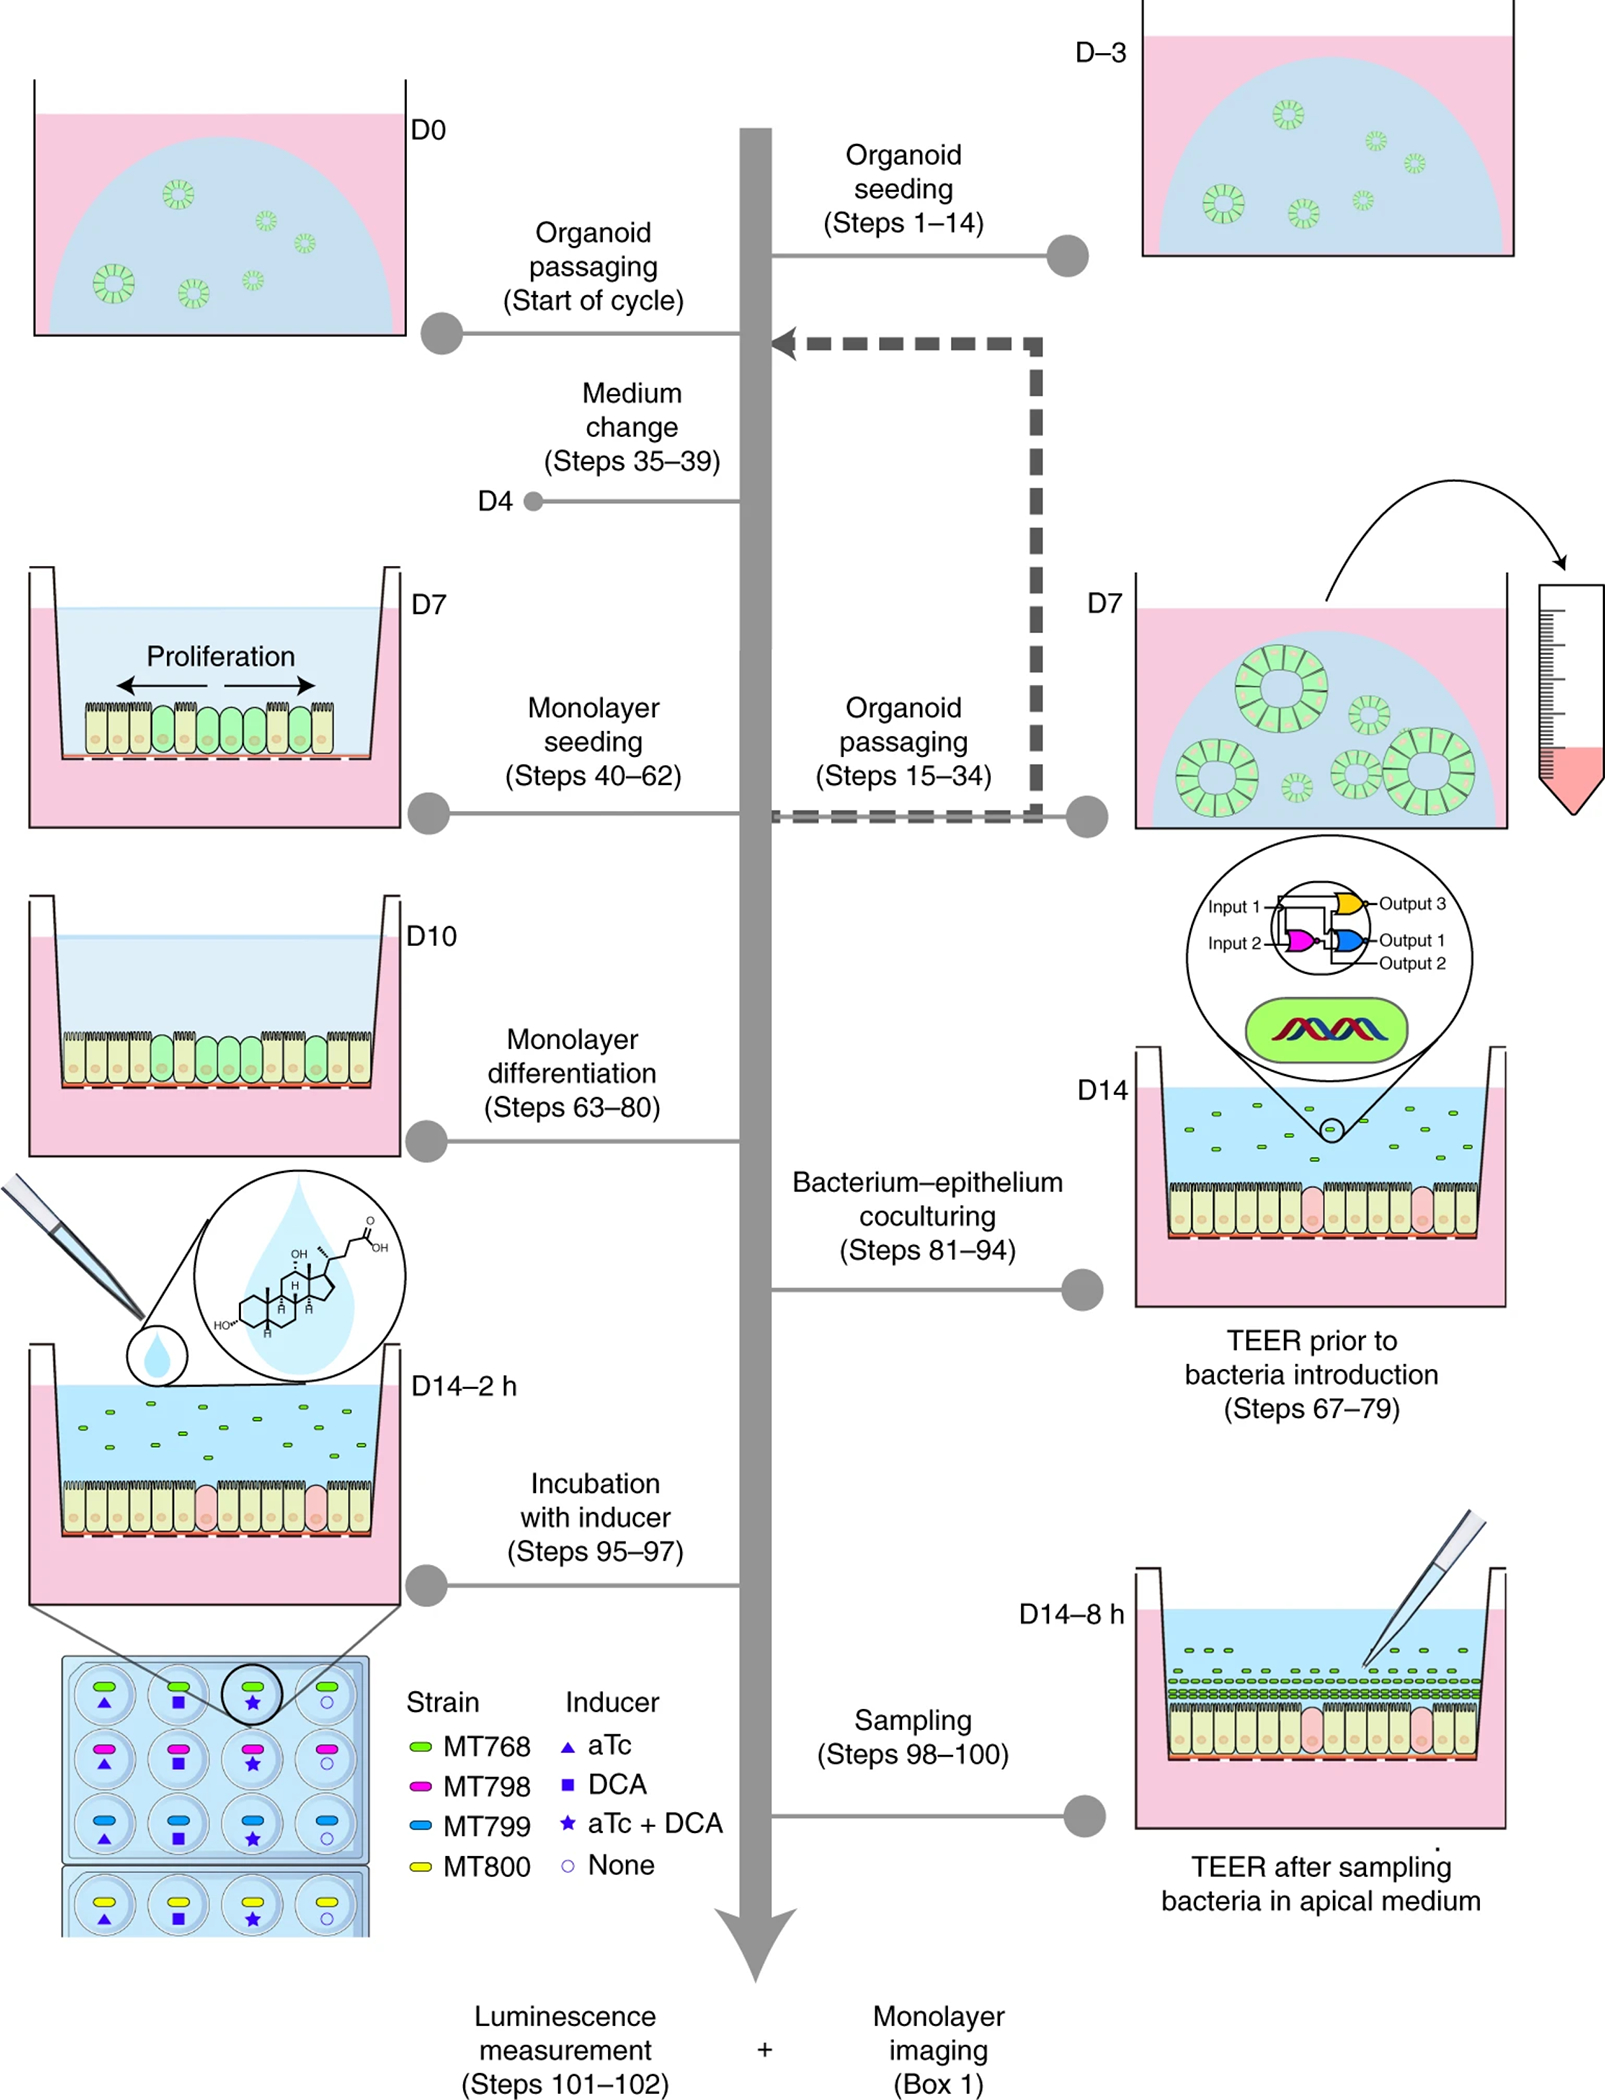
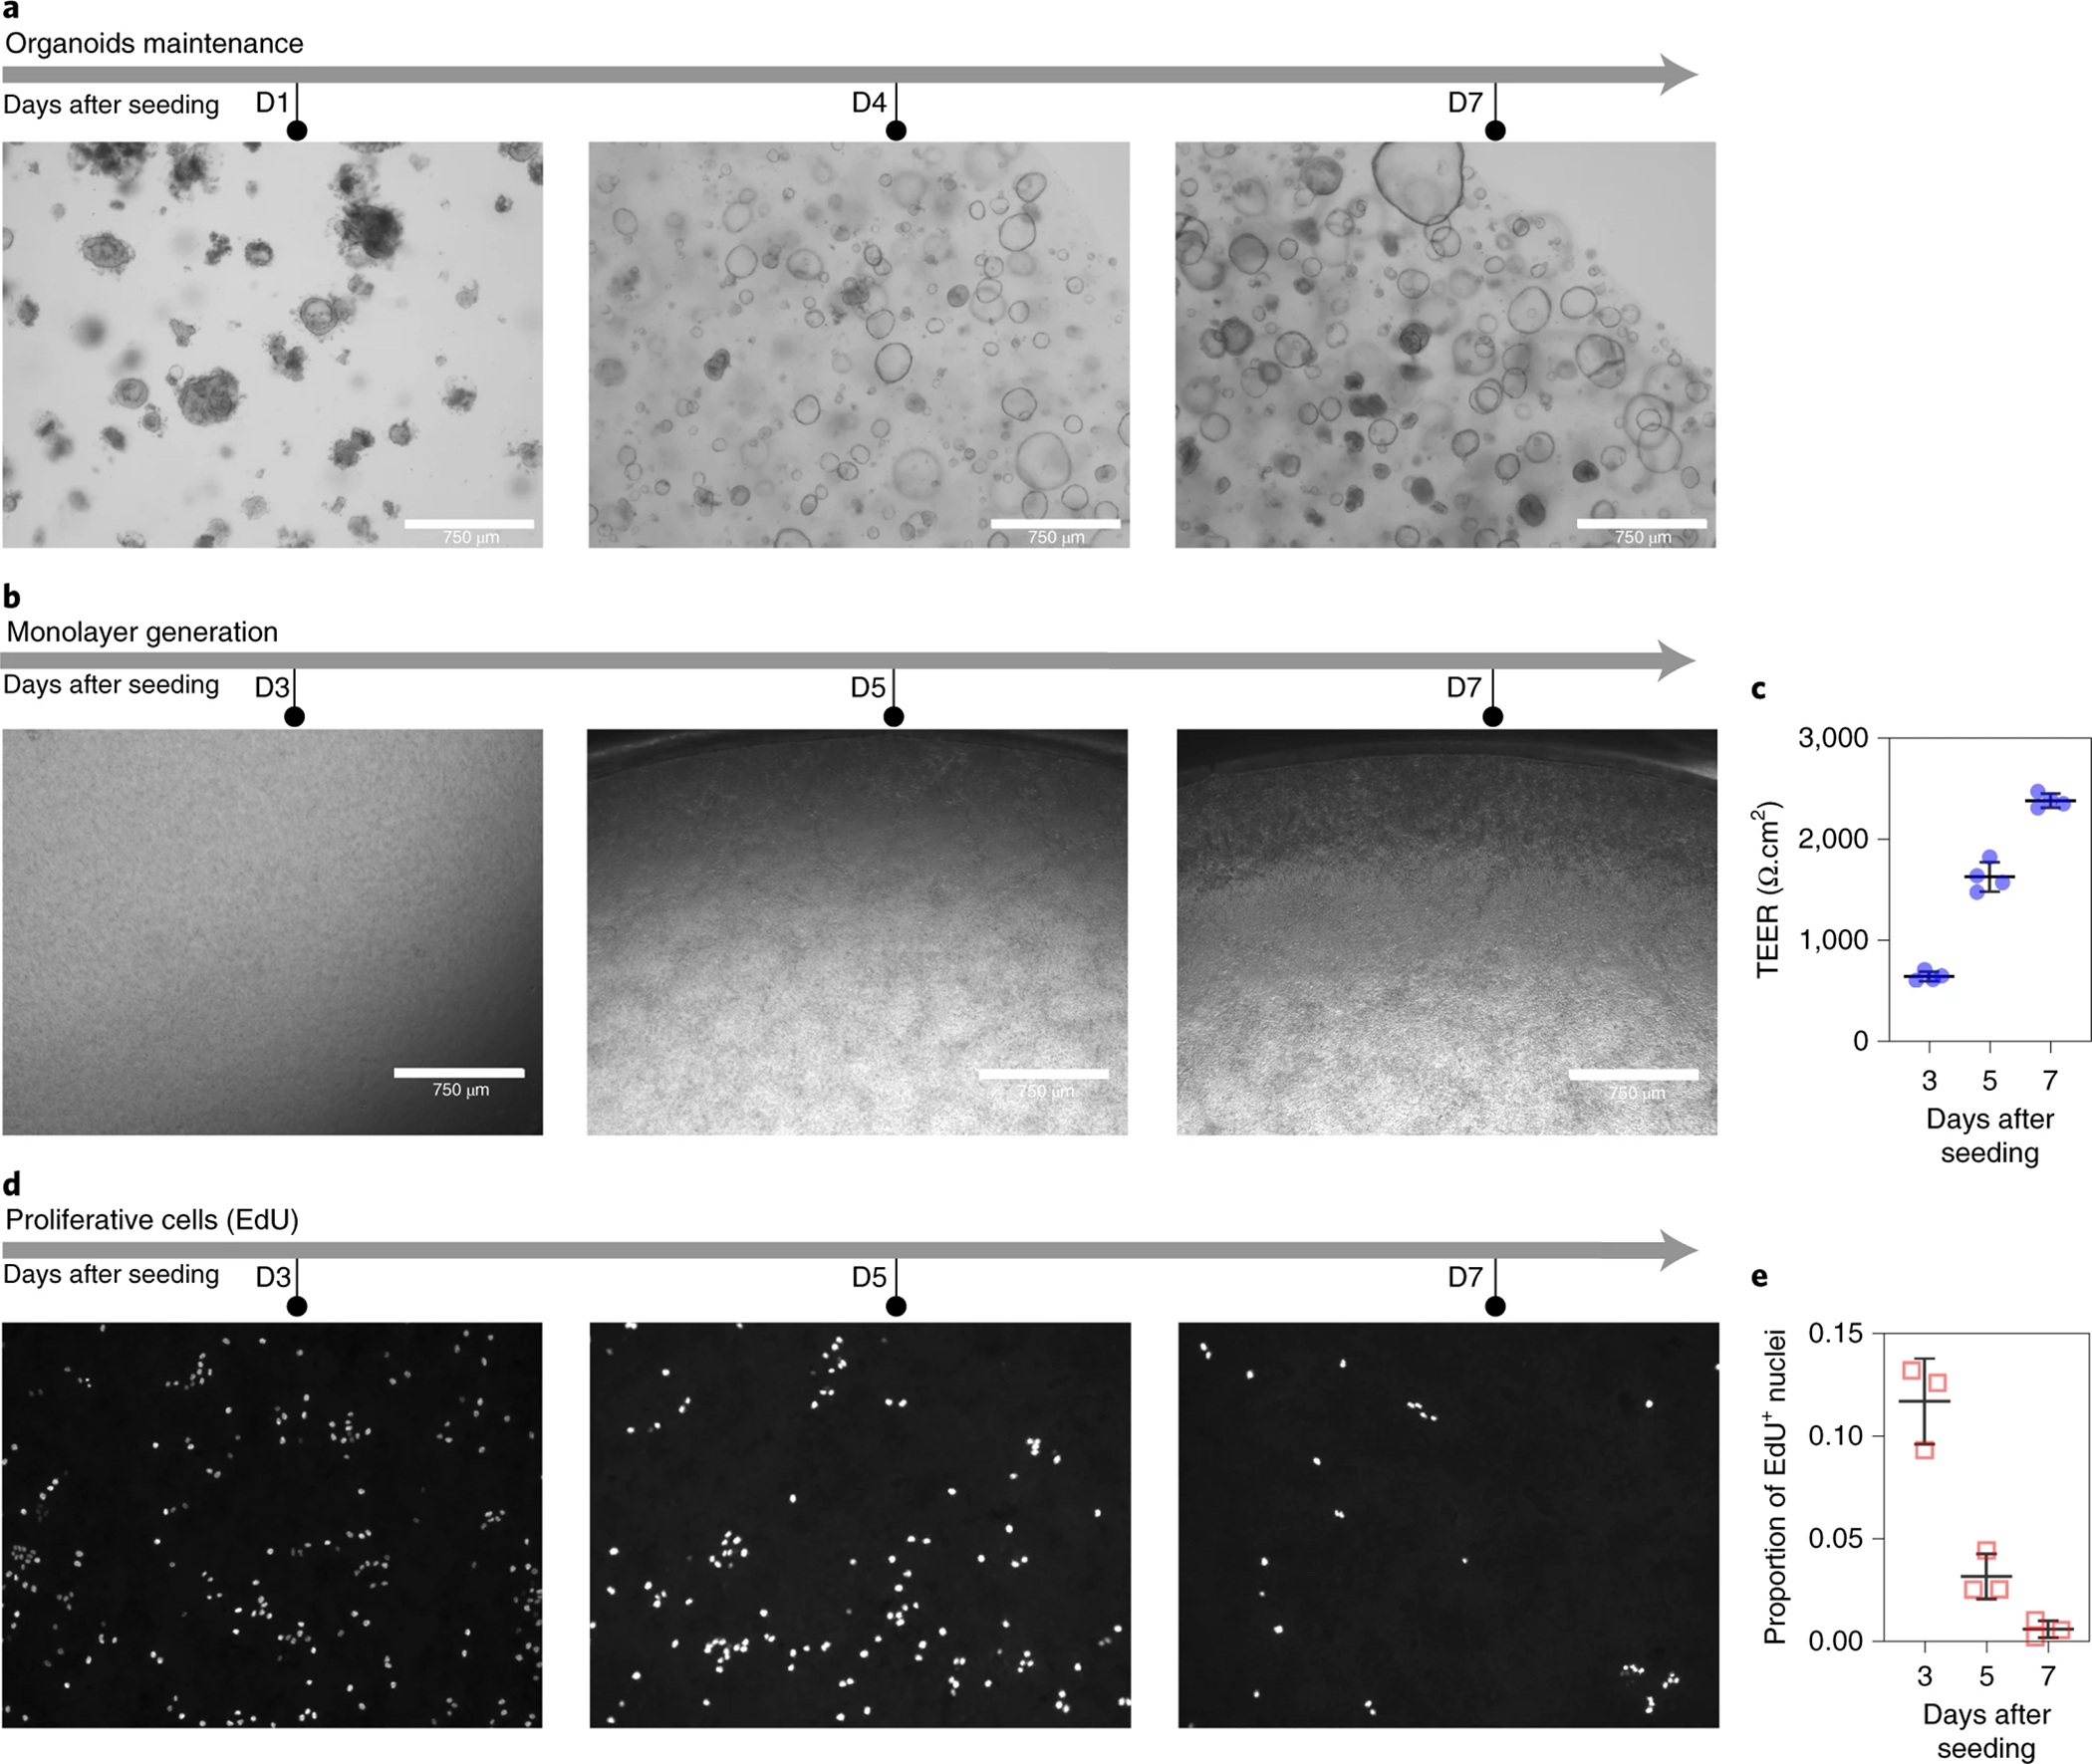
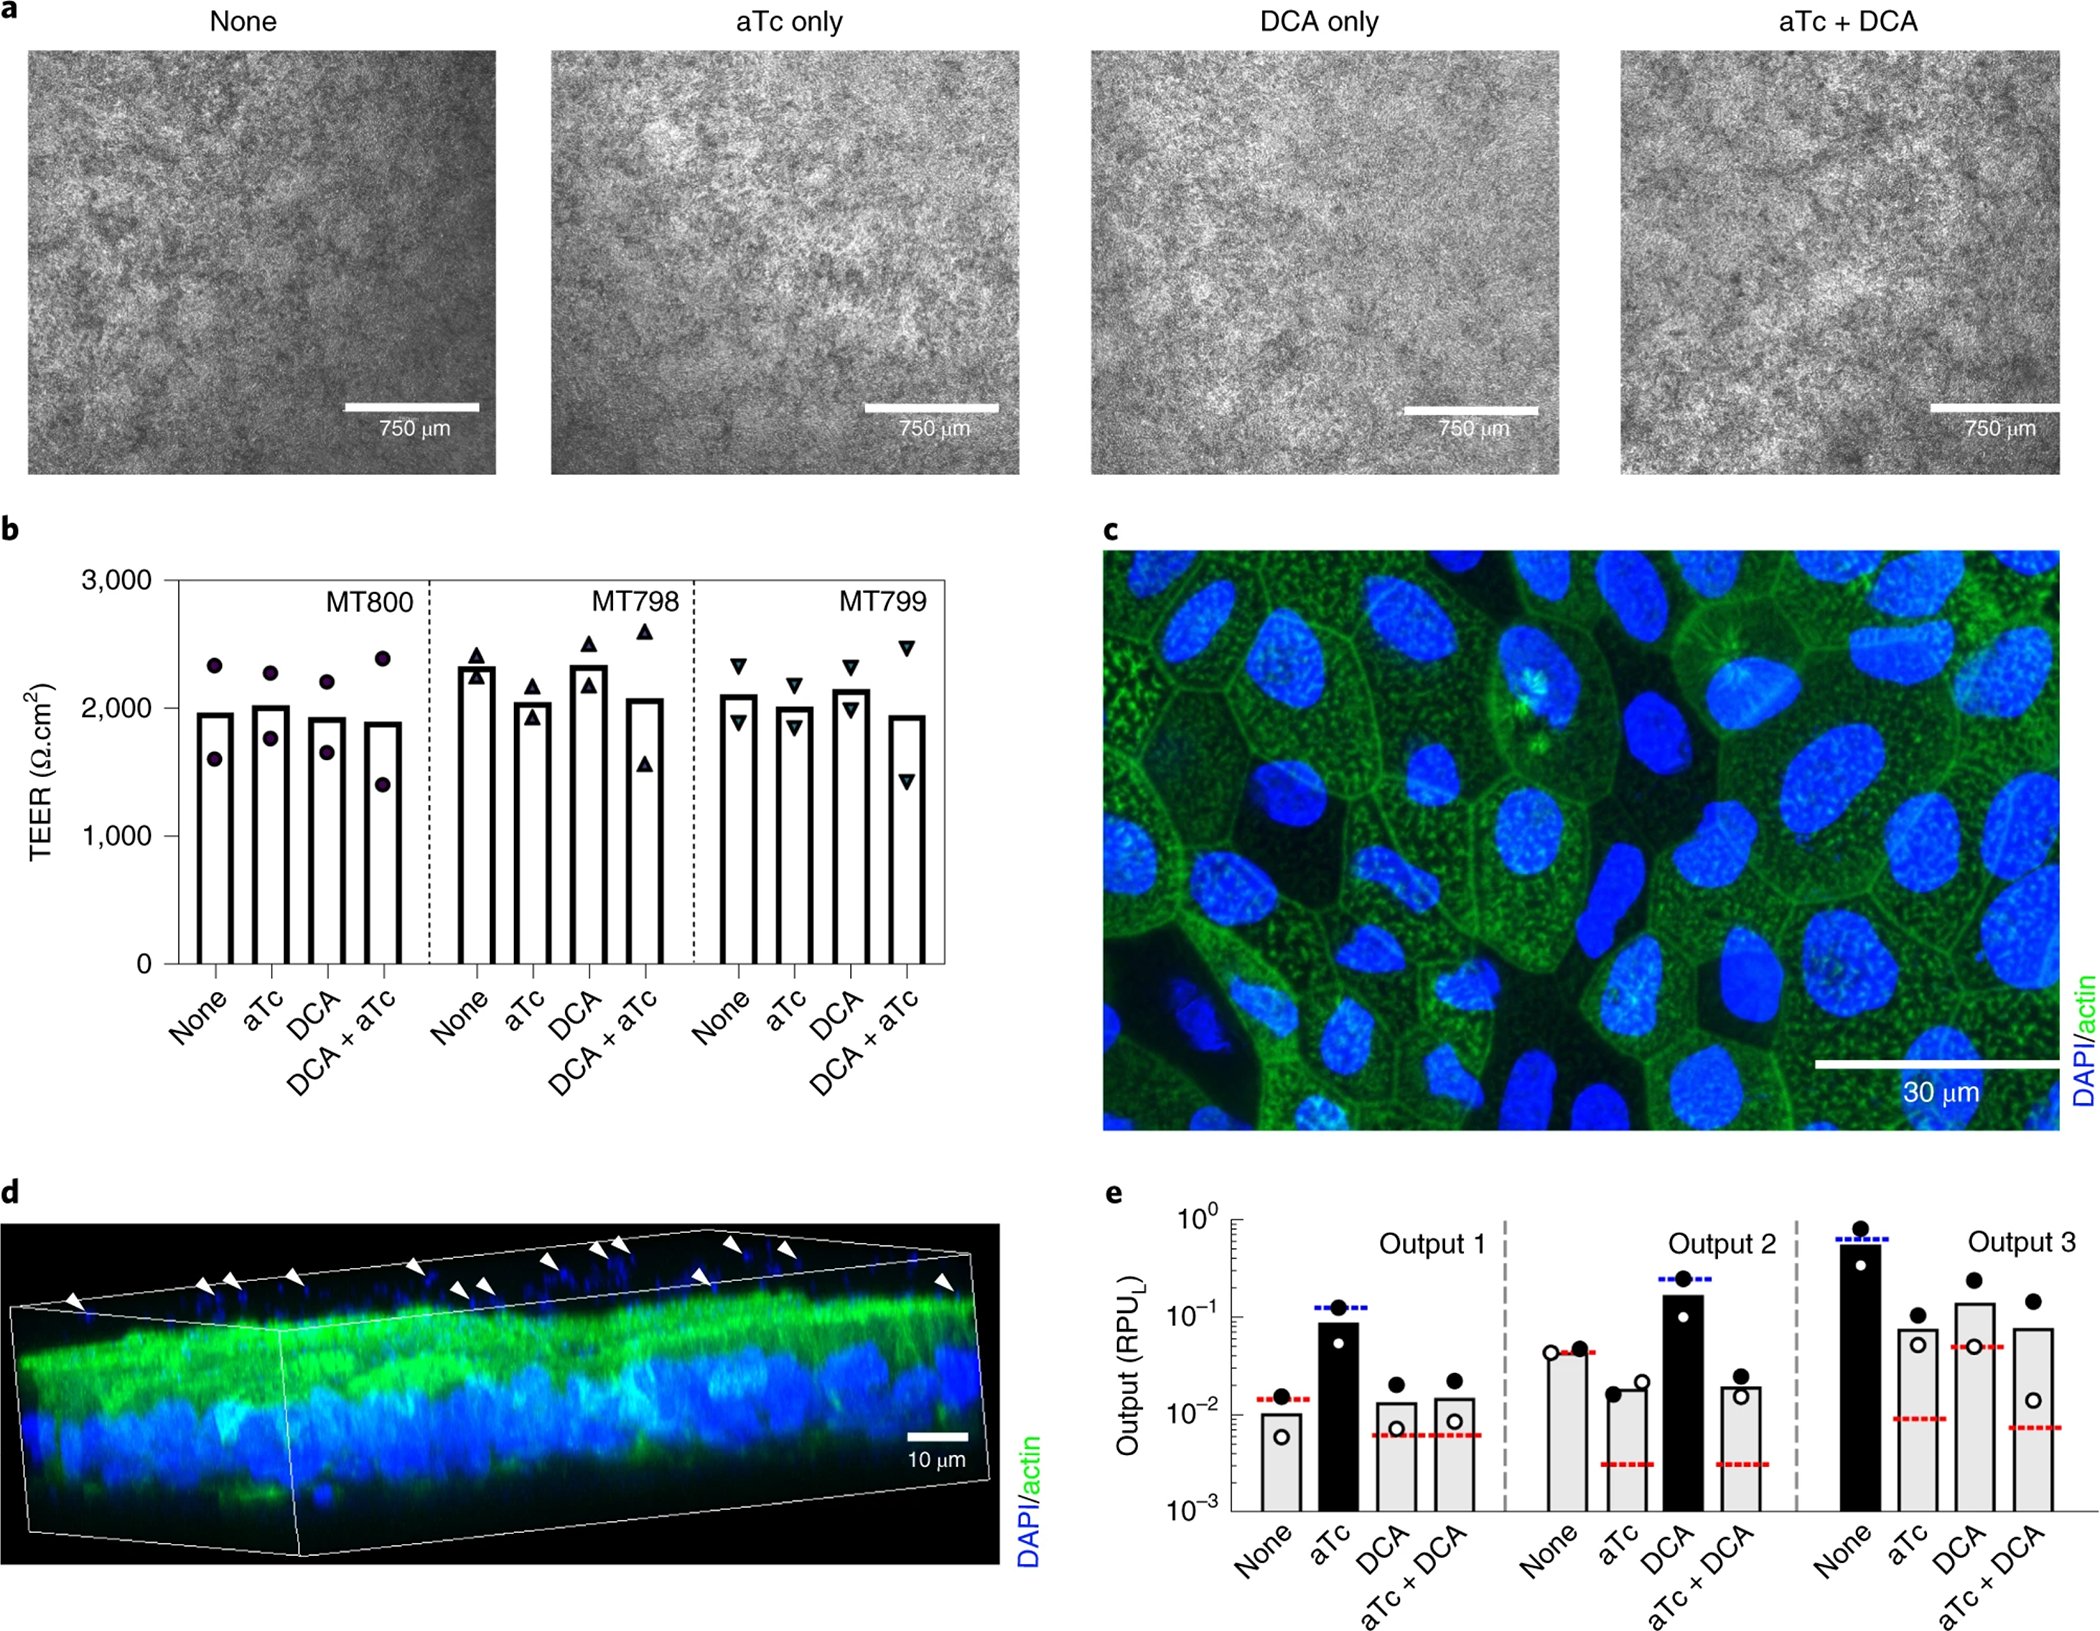
The presence of microbes in the colon impacts host physiology. Therefore, microbes are being evaluated as potential treatments for colorectal diseases. Humanized model systems that enable robust culture of primary human intestinal cells with bacteria facilitate evaluation of potential treatments. Here, we describe a protocol that can be used to coculture a primary human colon monolayer with aerotolerant bacteria. Primary human colon cells maintained as organoids are dispersed into single-cell suspensions and then seeded on collagen-coated Transwell inserts, where they attach and proliferate to form confluent monolayers within days of seeding. The confluent monolayers are differentiated for an additional 4 d and then cocultured with bacteria. As an example application, we describe how to coculture differentiated colon cells for 8 h with four strains of Bacteroides thetaiotaomicron, each engineered to detect different colonic microenvironments via genetically embedded logic circuits incorporating deoxycholic acid and anhydrotetracycline sensors. Characterization of this coculture system reveals that barrier function remains intact in the presence of engineered B. thetaiotaomicron. The bacteria stay close to the mucus layer and respond in a microenvironment-specific manner to the inducers (deoxycholic acid and anhydrotetracycline) of the genetic circuits. This protocol thus provides a useful mucosal barrier system to assess the effects of bacterial cells that respond to the colonic microenvironment, and may also be useful in other contexts to model human intestinal barrier properties and microbiota-host interactions.


Conflict of interest statement

Competing interests

C.A.V. and M.T. have filed a provisional patent based on this work. All other authors have no competing interests.

Figures

Figure 1.
Figure 1.. Schematic workflow to generate differentiated colon epithelial monolayers and co-culture with engineered B. thetaiotaomicron.
The workflow includes initial organoid seeding (steps 1–14), organoid passaging (steps 15–34), organoid medium change (steps 35–39), organoid processing for monolayer seeding (steps 40–62), monolayer differentiation (steps 63–80), bacteria-monolayer co-culture (steps 81–94), introduction of inducers (steps 95–97), and sampling for downstream analysis (steps 98102). Sampling refers to the collection of apical media containing bacteria as described in detail in steps 98–100 and in the original publication. In the co-culture experiments we previously conducted, engineered B. thetaiotaomicron MT798, MT799, and MT800 were used. Each strain carried a genetic circuit with designed response to inducers anhydrotetracycline (aTc, an antibiotic analog) and/or deoxycholic acid (DCA, a secondary bile acid in human colon). As a control, B. thetaiotaomicron (MT768) engineered with constant expression of luminescence was used. TEER measurement is optional but we recommend it be performed at key timepoints (e.g. D7, D10, and D14), particularly prior to coculture with bacteria at D14 and after media collection at D14. The procedure for TEER measurement is described in steps 67–79.
Figure 2.
Figure 2.. The success rate of generating usable monolayers and the cell viability of single cells from dissociated organoids used for monolayer seeding.
(a) The success rate in generating usable monolayers varied among three donors. n represents the number of attempts (weeks) to generate monolayer in the year 2019. (b) The viability of single cells obtained after processing organoids. In most cases the cell viability reached above 80%. Source Data Figure 2.
Figure 3.
Figure 3.. Morphology of primary human colon organoids.
(a) representative images of a panel of organoids showing different morphologies when undergoing differentiation (thick/folded edges [a1-a4], dark lumen [a2-a3], and non-cyst-like shape [a3-a4]). (b) a representative image of un-differentiated, cystlike colon organoid. (c) a side-by-side comparison of differentiated and un-differentiated organoids within the same Matrigel droplet. Note the relatively large and un-differentiated organoids (highlighted with a yellow asterisk) that show an empty lumen, and compare them to differentiated organoids that show thick-edges, budding, and a dark lumen (highlighted with a red rectangle)
Figure 4.
Figure 4.. Example of organoid expansion after each passaging.
At the first passage after thawing, there is a low number of organoids. Some organoids display a thick layer of cells with dark lumens (highlighted with white triangles). Following subsequent passages, the number of organoids with a thin layer of cells and well-defined and clear lumen increases (highlighted by yellow asterisks). After the third passage, the number of undifferentiated organoids with thin layer of cells and clear lumen increases (yellow asterisk) and the number of differentiated organoids showing a thick layer and darker lumen decreases (white arrow). Dashed line indicates the approximate boundary of the Matrigel droplet edge.
Figure 5.
Figure 5.. Representative images of failed monolayers that show regions with holes or the presence of excessive dead cells after exposure to bacterial medium
(a) Example of monolayers showing holes at the edge of the transwells after induction of differentiation. Note that monolayers with holes have relatively high TEER values (depending on the donor, TEER > 500 Ω cm2), therefore, we recommend that every monolayer be inspected under an inverted microscope prior to the addition of bacteria. (b) A monolayer that was exposed to bacterial medium (tryptone yeast extract glucose [TYG]) for 6 h. The arrows point to regions in the monolayer where epithelial cells lifted from the transwell membrane, indicating they were dying after exposure to the TYG medium alone. Scale bar = 300 μm.
Figure 6.
Figure 6.. Representative images of organoids, monolayers and proliferative cells in those monolayers.
(a) Time course organoid growth at days one (D1), four (D4), and seven (D7) in Matrigel. (b) Bright field images of colon monolayers after three (D3), five (D5), and seven (D7) days post seeding. (c) Transepithelial electrical resistance (TEER) of monolayers at three (D3), five (D5), and seven (D7) days post seeding (n=4). Source Data Figure 6. (d) EdU staining of the cells in monolayer at three (D3), five (D5), and seven (D7) days post seeding. (e) The decrease in the proportion of EdU-positive cells 1316 upon differentiation, suggest a decrease of proliferative cells (n = 3). Source Data Figure 6. Data in (c) 1317 and (e) are presented as mean and standard deviation.
Figure 7.
Figure 7.. Evaluation on the integrity of monolayers and response of B. thetaiotaomicron to inducers 1320 after co-culture.
(a) representative brightfield images of monolayers after 8 h co-culture with B. thetaiotaomicron MT798 with inclusion of indicated inducers for the last 6 h of culture. Scale bar = 750μm. (b) TEER values of the monolayers co-cultured with B. thetaiotaomicron MT800 (circle), MT798 (upward triangle), and MT799 (downward triangle) at four different conditions (n=2), corresponding to the outputs in (e). Two independent experiments are depicted in the plot. Raw data can be found in Source Data Figure 7. (c) Epithelial cells in the monolayer with nuclear (blue) and beta-actin (green) staining. Scale bar =30 μm. (d) Three-dimensional rendering of the monolayer stained with DAPI (blue) and beta-actin (green), bacteria is present above the green actin layer of epithelial cells (see white arrows). Note that the scale bar in 3D rendered image is an approximation of the precise scale. (e) Luminescent output of B. thetaiotaomicron MT800 (Output 1), MT798 (Output 2), and MT799 (Output 3) in response to four different conditions (n=2). Dots indicate the values from two independent experiments. Figure 7b, 7d, and 7e were published previously. Raw data and the calculation of RPUL can be found in Supplementary Table S3.

References

    1. Molly K, Vande Woestyne M & Verstraete W Development of a 5-step multi-chamber reactor as a simulation of the human intestinal microbial ecosystem. Applied Microbiology and Biotechnology 39, 254–258, doi:10.1007/BF00228615 (1993). - DOI - PubMed
    1. Venema K & van den Abbeele P Experimental models of the gut microbiome. Best Pract Res Cl Ga 27, 115–126, doi:10.1016/j.bpg.2013.03.002 (2013). - DOI - PubMed
    1. Molly K, Woestyne MV, Smet ID & Verstraete W Validation of the Simulator of the Human Intestinal Microbial Ecosystem (SHIME) Reactor Using Microorganism-associated Activities. Microbial Ecology in Health and Disease 7, 191–200, doi:10.3109/08910609409141354 (1994). - DOI
    1. Cinquin C, Le Blay G, Fliss I & Lacroix C New three-stage in vitro model for infant colonic fermentation with immobilized fecal microbiota. FEMS Microbiology Ecology 57, 324–336, doi:10.1111/j.1574-6941.2006.00117.x (2006). - DOI - PubMed
    1. Trapecar M, Goropevsek A, Gorenjak M, Gradisnik L & Slak Rupnik M A co-culture model of the developing small intestine offers new insight in the early immunomodulation of enterocytes and macrophages by Lactobacillus spp. through STAT1 and NF-kB p65 translocation. PLoS One 9, e86297, doi:10.1371/journal.pone.0086297 (2014). - DOI - PMC - PubMed

Publication types