. 2022 May;530(7):963-977.
doi: 10.1002/cne.25203. Epub 2021 Jul 5.

Molecular cell identities in the mediodorsal thalamus of infant mice and marmoset

Affiliations

Molecular cell identities in the mediodorsal thalamus of infant mice and marmoset

Kohei Onishi et al. J Comp Neurol. 2022 May.

Abstract

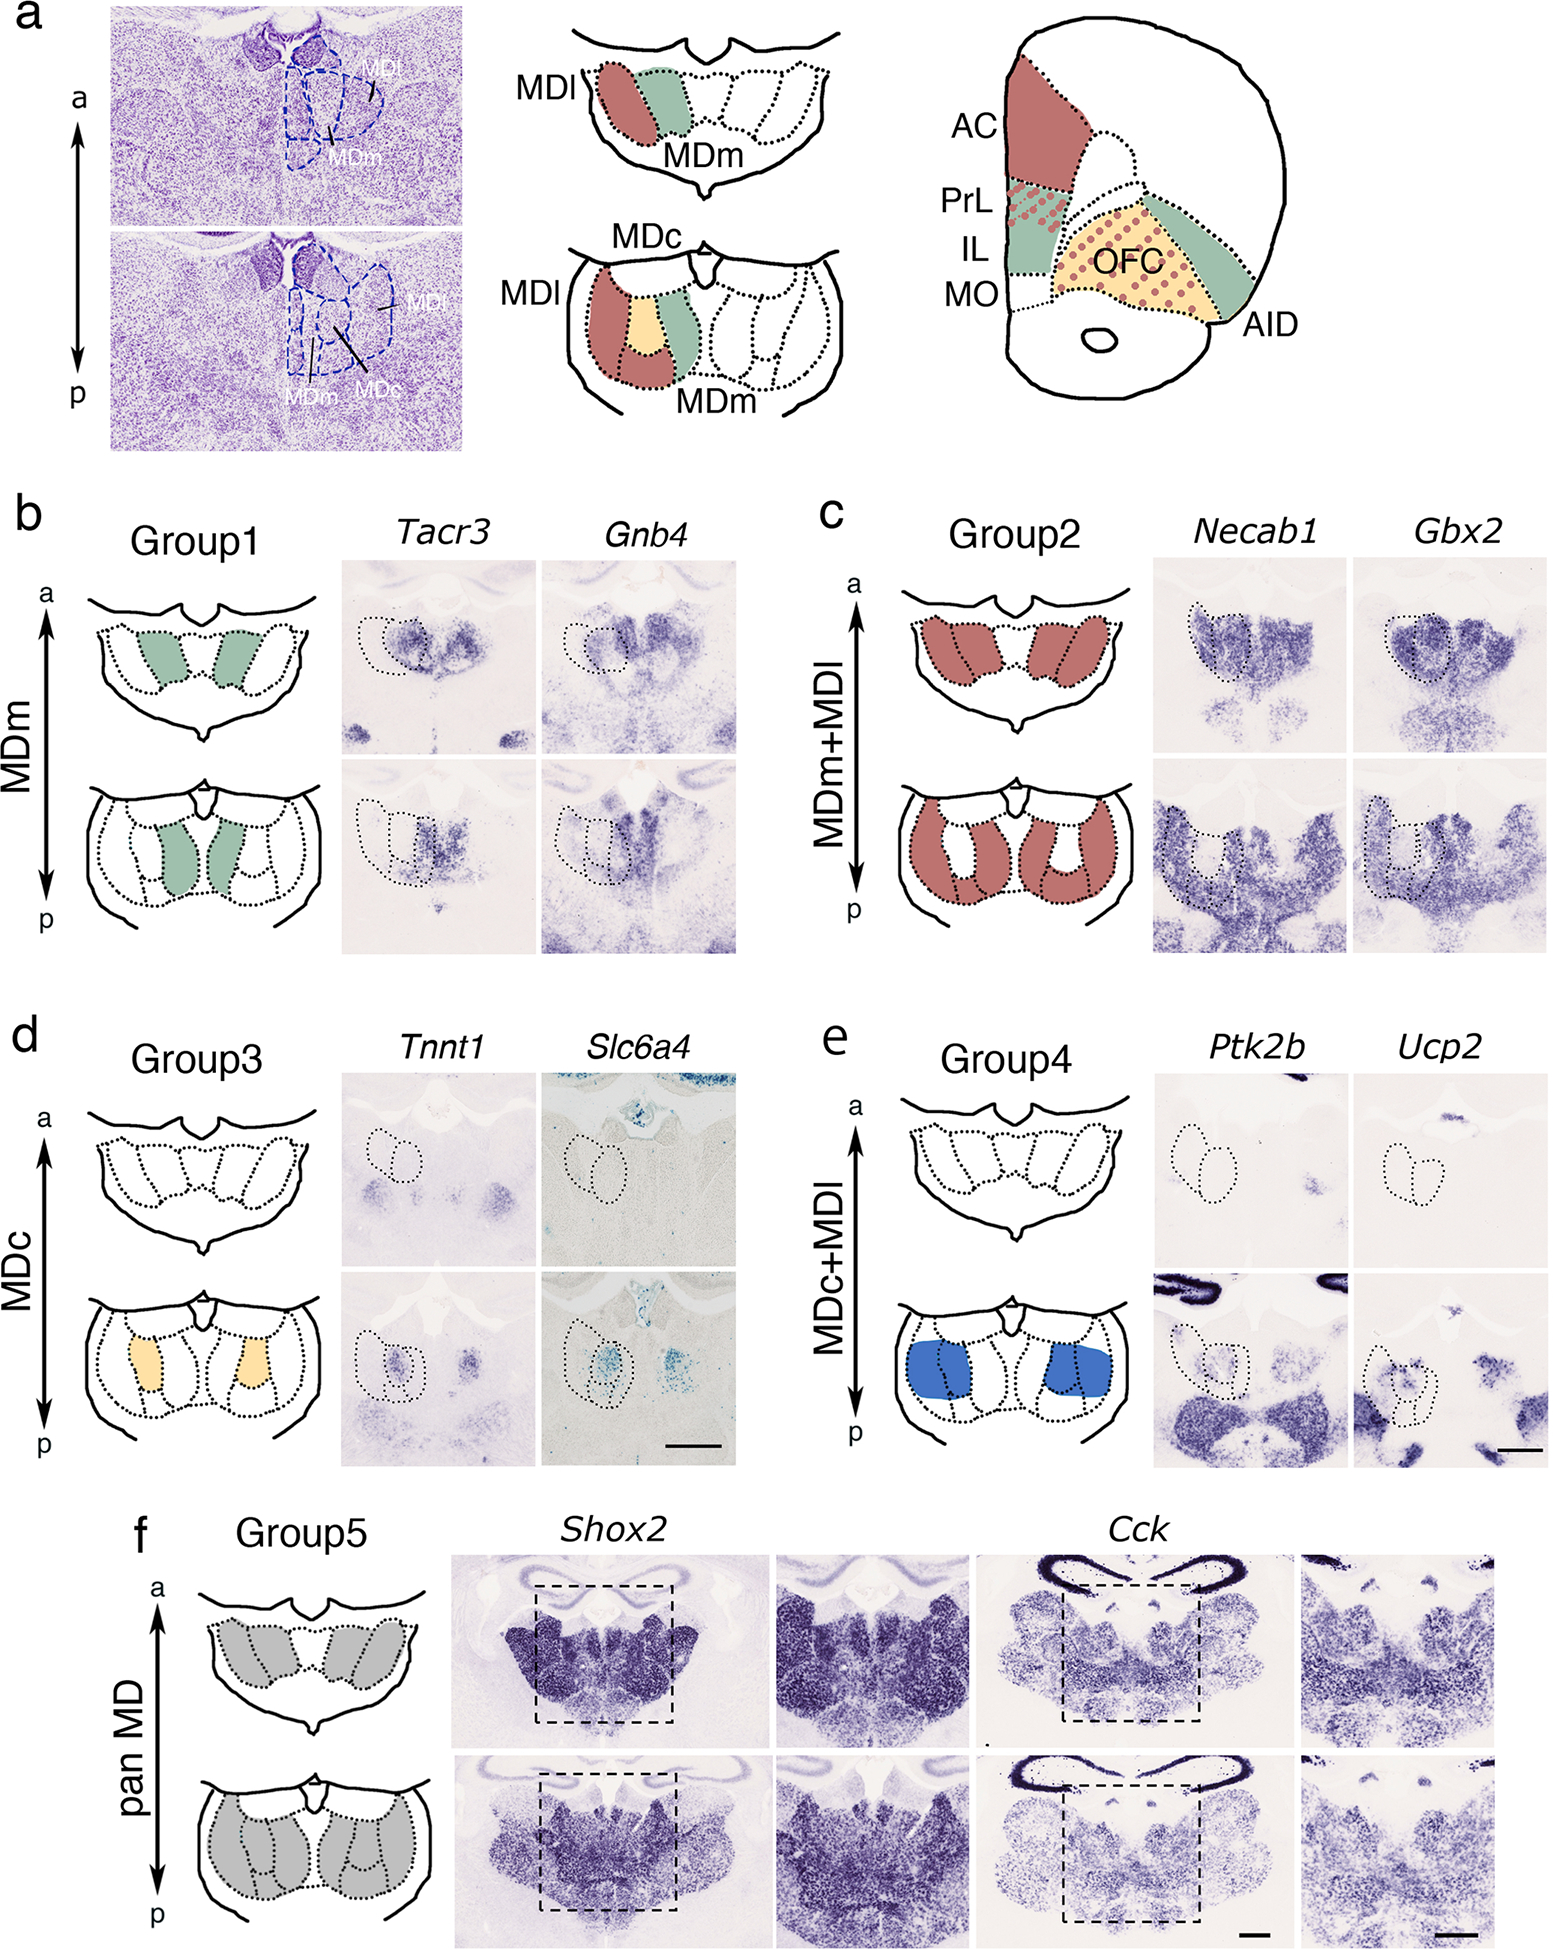
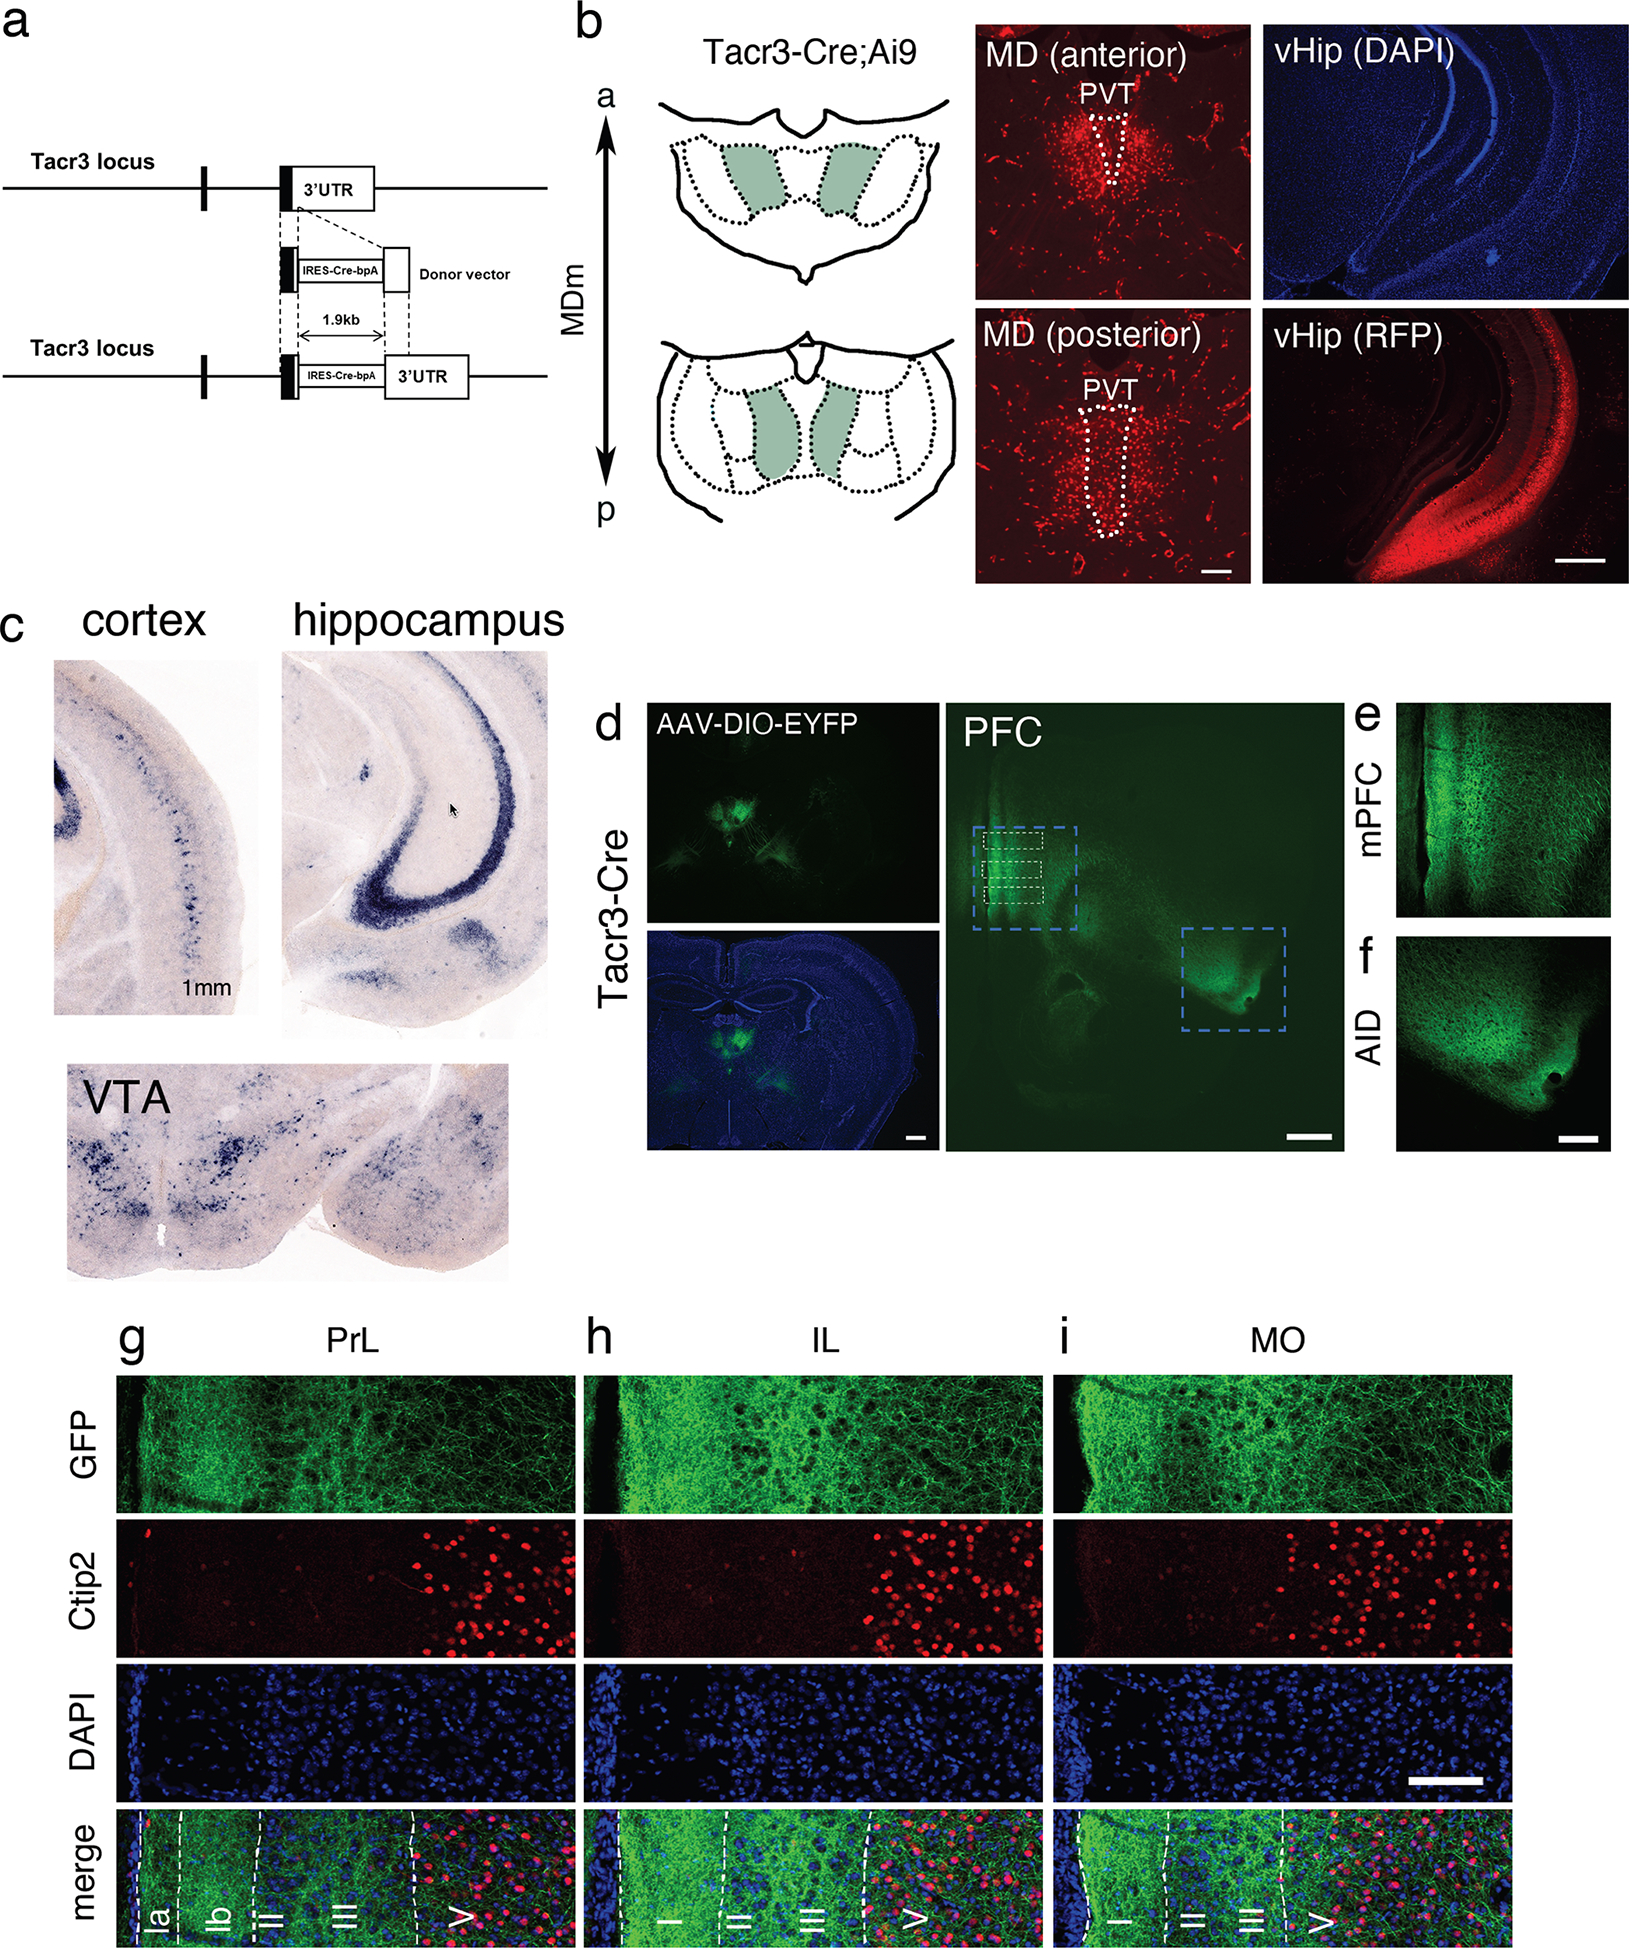
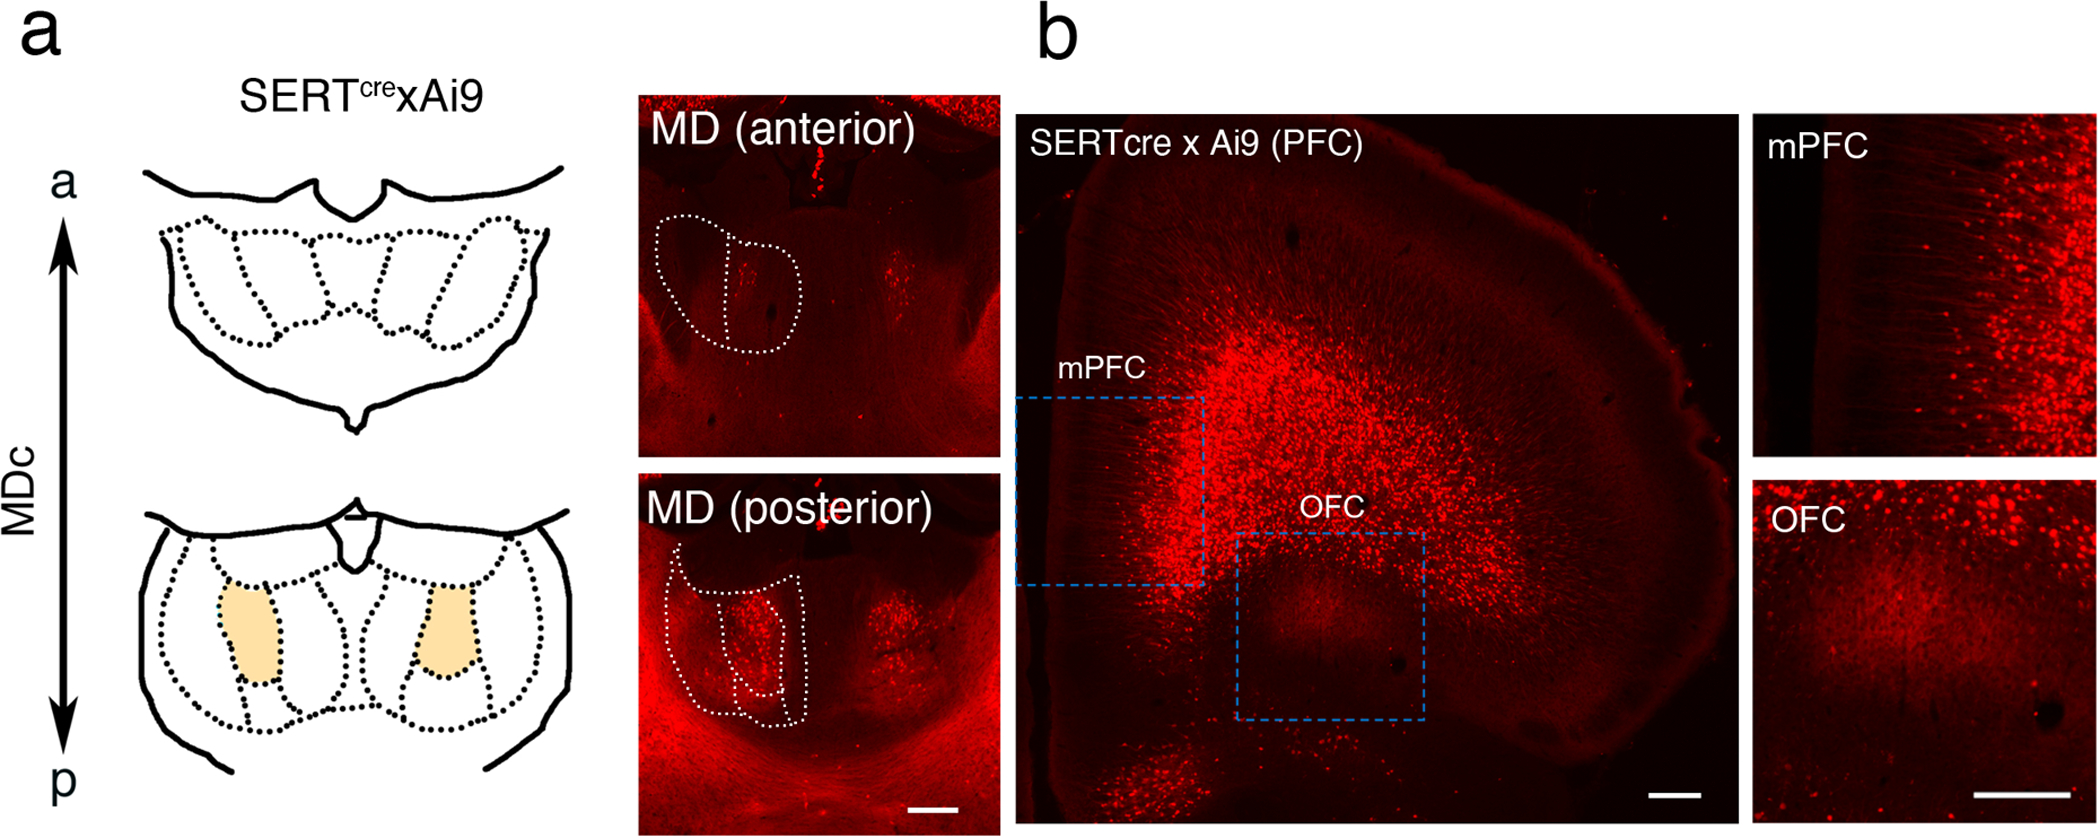
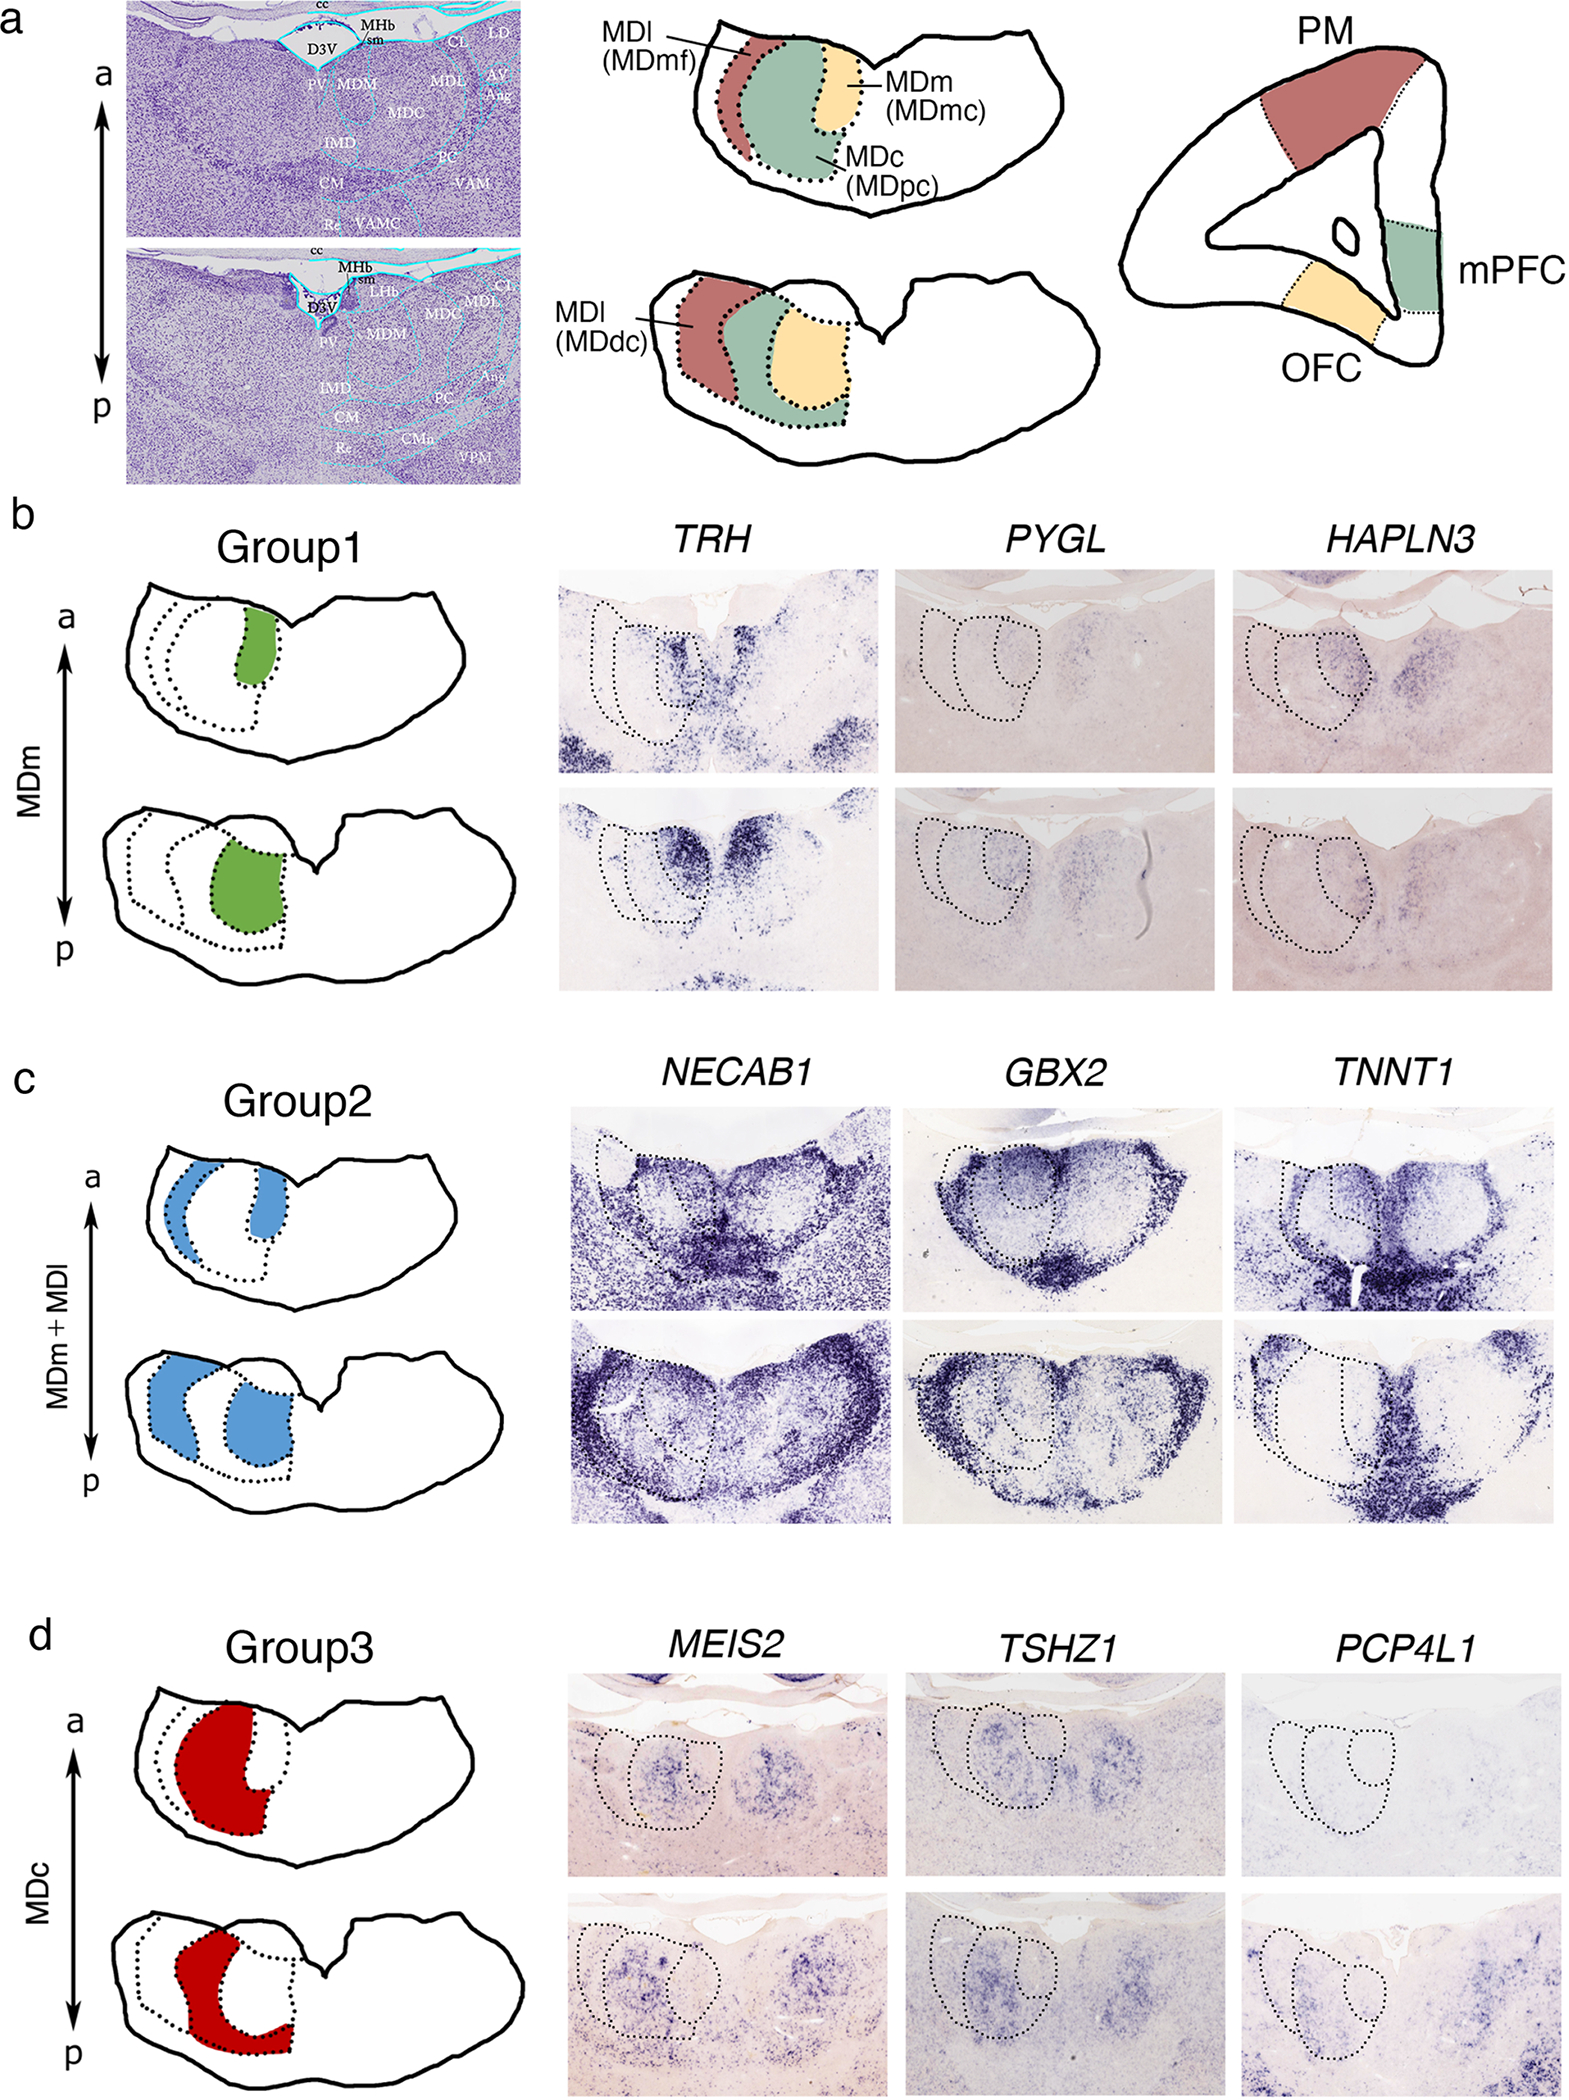
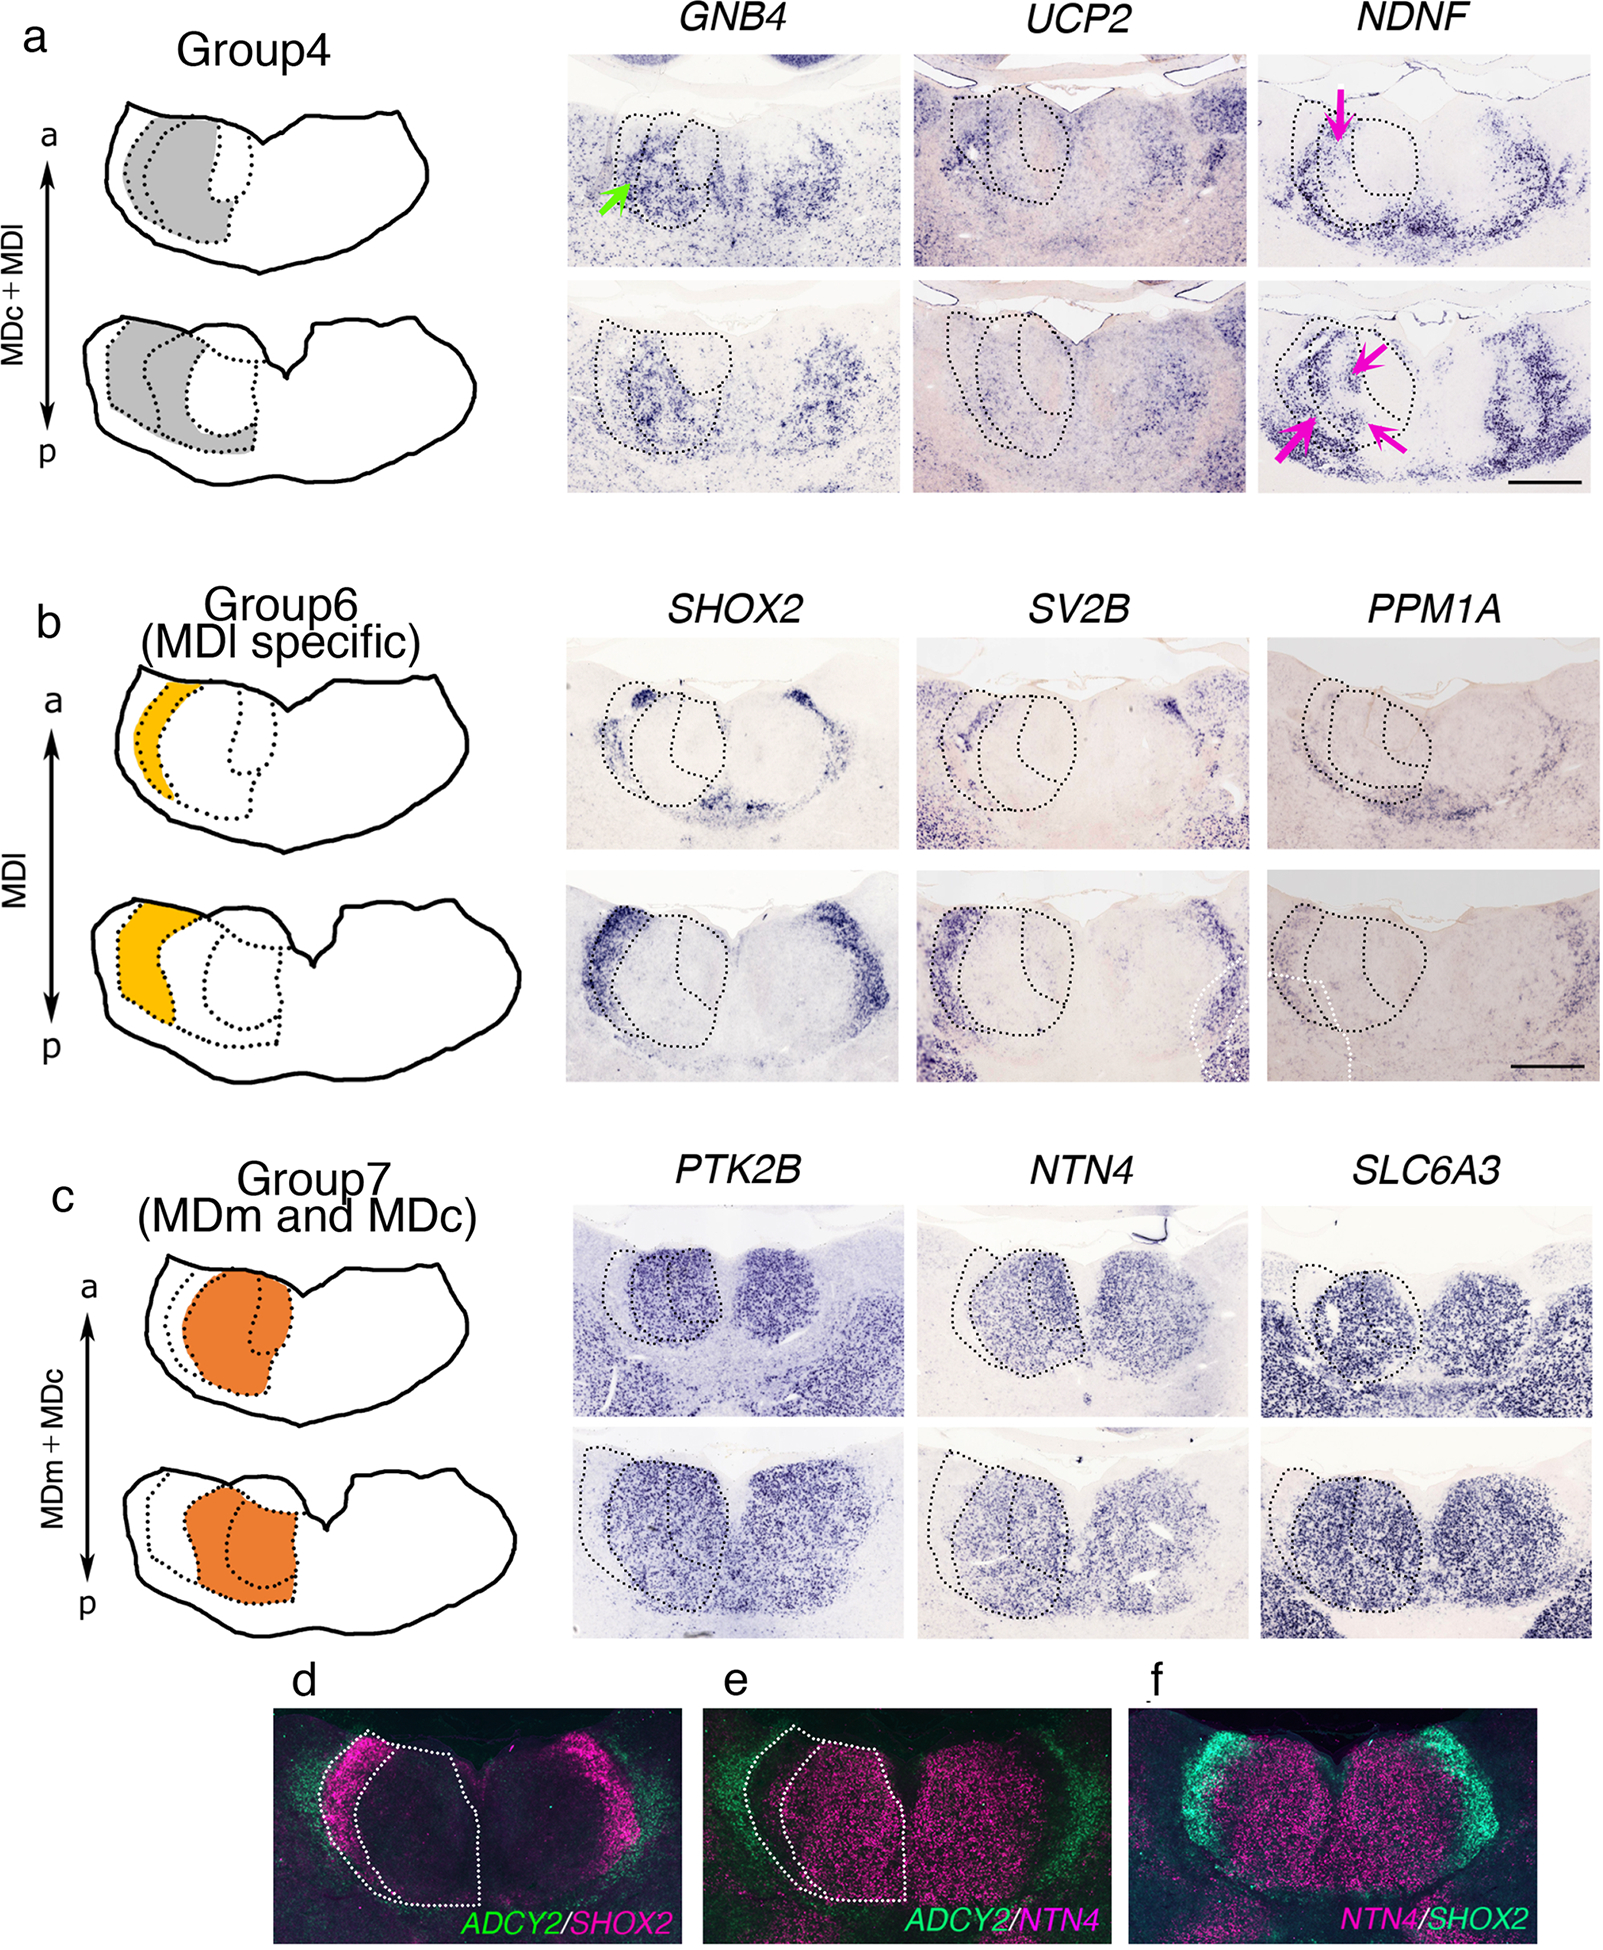
The mediodorsal thalamus (MD) is a higher-order nucleus located within the central thalamus in many mammalian species. Emerging evidence from MD lesions and tracer injections suggests that the MD is reciprocally connected to the prefrontal cortex (PFC) and plays an essential role in specific cognitive processes and tasks. MD subdivisions (medial, central, and lateral) are poorly segregated at the molecular level in rodents, leading to a lack of MD subdivision-specific Cre driver mice. Moreover, this lack of molecular identifiers hinders MD subdivision- and cell-type-specific circuit formation and function analysis. Therefore, using publicly available databases, we explored molecules separately expressed in MD subdivisions. In addition to MD subdivision markers, we identified several genes expressed in a subdivision-specific combination and classified them. Furthermore, after developing medial MD (MDm) or central MD (MDc) region-specific Cre mouse lines, we identified diverse region- and layer-specific PFC projection patterns. Comparison between classified MD marker genes in mice and common marmosets, a nonhuman primate model, revealed diverging gene expression patterns. These results highlight the species-specific organization of cell types and their projections in the MD thalamus.

Keywords: cognition; evolution; mediodorsal thalamus; nonhuman primate; prefrontal cortex.


Conflict of interest statement

DECLARATION OF INTERESTS

The authors declare no competing financial interests.

Figures

Figure 1
Figure 1
(a) Nissl staining in P15 mouse brain and schematic of the projection patterns from each MD subdivision (MDm, MDc, and MDl) to the PFC as based on a previous study (Alcaraz et al., 2016). AC, anterior cingulate cortex; PrL, prelimbic cortex; IL, infralimbic cortex; OFC orbitofrontal cortex; AID, agranular insular cortex. (b-f) Representative images of in situ hybridization revealed expression patterns in mice MD subdivisions at P15. Five groups were categorized based on the expression patterns in MD subdivisions. (b) Group 1: Tacr3 and Gnb4 were expressed in the anterior and posterior MDm. (c) Group 2: Tnnt1 in the MDc. X-gal staining revealed Cre-mediated recombination in the MDc of SERTCre;R26R mice at P6. (d) Group 3: Necab1 and Gbx2 were expressed in the anterior and posterior MDm and MDl. (e) Group 4: Ptk2 and Ucp2 were expressed in the MDc and in a subregion of the posterior MDl. (f) Group 5: Shox2 and Cck were broadly expressed throughout the entire MD.
Figure 2
Figure 2
(a) Scheme of the targeting strategy for Tacr3-IRES-Cre mice. The guide RNA was designed based on the 3’UTR of the Tacr3 gene locus. The IRES-Cre-bpA cassette was inserted into the 3’UTR of the Tacr3 gene locus. (b) Representative immunohistochemistry images with anti-RFP antibody in Tacr3Cre;Ai9 at P16. Cre-mediated recombination confirmed by crossing Tacr3Cre with Ai9 mice. tdTomato-positive neurons observed in the anterior and posterior MDm and ventral hippocampus of Tacr3Cre;Ai9 mice. Sections counterstained with DAPI. Scale bars, 200 μm and 500 μm. (c) Tacr3 expression in cortex, hippocampus and ventral tegmental area (VTA) at P10, as revealed by ISH. (d–i) Stereotaxic injection of AAV-DIO-EYFP into MD of Tacr3Cre at P2 revealing the projection from Tacr3-positivie MD neurons to the PFC. Representative immunohistochemistry images with anti-GFP and anti-Ctip2 antibodies in virus-injected-Tacr3Cre at P14. Projections from the MDm to the PFC. Scale bars, 500 μm. Strong projections observed in the mPFC (ventral part of the PrL and IL) (e) and agranular insular cortex (AID) (f) depicted in high magnification images. Scale bar, 200 μm. (g–i) High magnification images in the PrL (g), IL (h), and MO (i) revealed differentially distributed GFP-positive axon terminals in the cortical layers of each region. Cortical layers were identified based on immunohistochemistry with anti-Ctip2 antibody and DAPI staining patterns. MO, medial orbital cortex. Scale bar, 100 μm.
Figure 3
Figure 3
(a, b) Representative immunohistochemistry images with anti-RFP antibody in SertCre;Ai9 mice at P9. Scale bars, 200 μm. (a) Cre-mediated recombination confirmed by crossing SertCre mice with Ai9 mice. tdTomato-positive neurons observed in the MDc of Sert-Cre;Ai9 mice. (b) Projections from the MDc to PFC in SertCre;Ai9 mice. Strong projections were observed in the OFC but not in the mPFC, and depicted in high magnification images.
Figure 4
Figure 4
(a) Nissl staining in the neonate marmoset brain and schematic of the projection patterns from each MD subdivision (MDmc, MDpc, MDmf, and MDdc) to the PFC. Projections from the MDmc to the OFC, the MDpc to the mediodorsal PFC, and the MDmf and MDdc to premotor cortical areas. (b–d) Representative in situ hybridization images against genes expressed in marmoset MD subdivisions at P0. (b) Group 1: TRH, PYGL, and HAPLN3 expressed in the MDm. (c) Group 2: NECAB1, GBX2, and TNNT1 expressed in the MDm and MDl. (d) Group 3: MEIS2, PCP4L1, and TSHZ1 expressed in the MDc.
Figure 5
Figure 5
(a–c) Representative in situ hybridization images against genes expressed in marmoset MD subdivisions at P0. Scale bar, 1 mm. (a) Group 4: GNB4, UCP2, and NDNF expressed in the MDc and MDl. Green and magenta arrows indicate subregional expression, respectively. (b) SHOX2, SV2B, and PPM1A expressed in the MDl. (c) PTK2B, NTN4, and SLC6A3 expressed in the MDm and MDc. (d–f) Pseudo-colored ISH images of ADCY2 (CL), SHOX2 (MDl), and NTN4 (MDm and MDc) revealing the MDl borders. Overlaid pseudo-colored ISH images revealing the border between MDl and adjacent regions.

Similar articles

Cited by

References

    1. Alcaraz F, Marchand AR, Courtand G, Coutureau E, & Wolff M (2016). Parallel inputs from the mediodorsal thalamus to the prefrontal cortex in the rat. Eur J Neurosci, 44(3), 1972–1986. doi:10.1111/ejn.13316 - DOI - PubMed
    1. Anastasiades PG, Collins DP, & Carter AG (2021). Mediodorsal and Ventromedial Thalamus Engage Distinct L1 Circuits in the Prefrontal Cortex. Neuron, 109(2), 314–330 e314. doi:10.1016/j.neuron.2020.10.031 - DOI - PMC - PubMed
    1. Anticevic A, Cole MW, Repovs G, Murray JD, Brumbaugh MS, Winkler AM, Savic A, Krystal JH, Pearlson GD, & Glahn DC (2014). Characterizing thalamo-cortical disturbances in schizophrenia and bipolar illness. Cereb Cortex, 24(12), 3116–3130. doi:10.1093/cercor/bht165 - DOI - PMC - PubMed
    1. Bailey KR, & Mair RG (2005). Lesions of specific and nonspecific thalamic nuclei affect prefrontal cortex-dependent aspects of spatial working memory. Behav Neurosci, 119(2), 410–419. doi:10.1037/0735-7044.119.2.410 - DOI - PubMed
    1. Barbas H, Henion TH, & Dermon CR (1991). Diverse thalamic projections to the prefrontal cortex in the rhesus monkey. J Comp Neurol, 313(1), 65–94. doi:10.1002/cne.903130106 - DOI - PubMed

Publication types