. 2021 Sep;11(9):2468-2489.
doi: 10.1002/2211-5463.13240. Epub 2021 Aug 12.

In vitro and in vivo safety studies indicate that R15, a synthetic polyarginine peptide, could safely reverse the effects of unfractionated heparin

Affiliations

In vitro and in vivo safety studies indicate that R15, a synthetic polyarginine peptide, could safely reverse the effects of unfractionated heparin

Tong Li et al. FEBS Open Bio. 2021 Sep.

Abstract

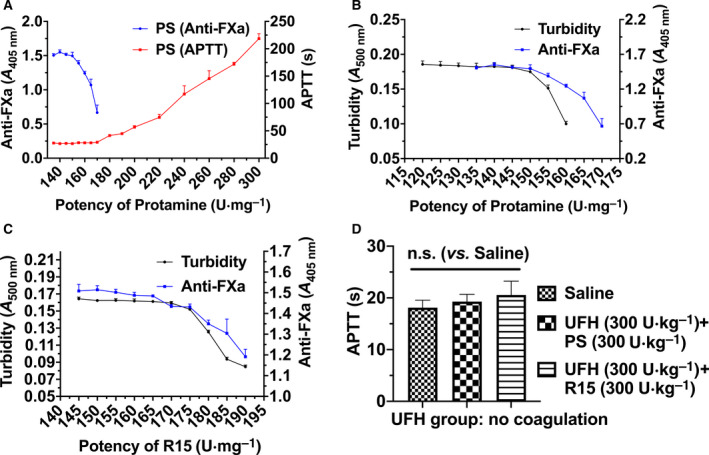
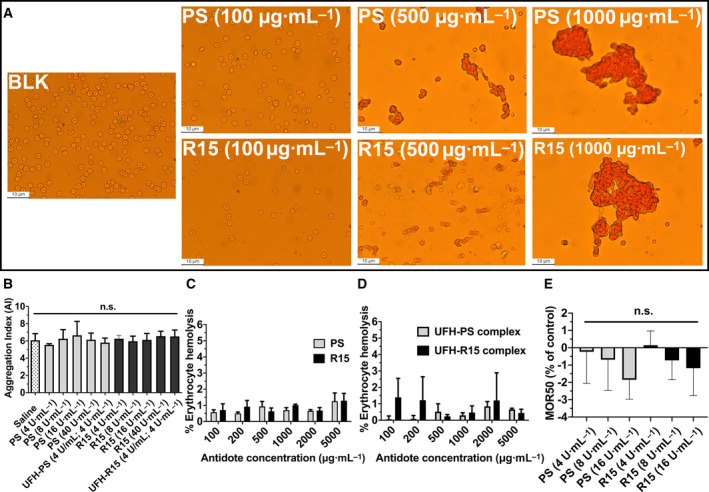
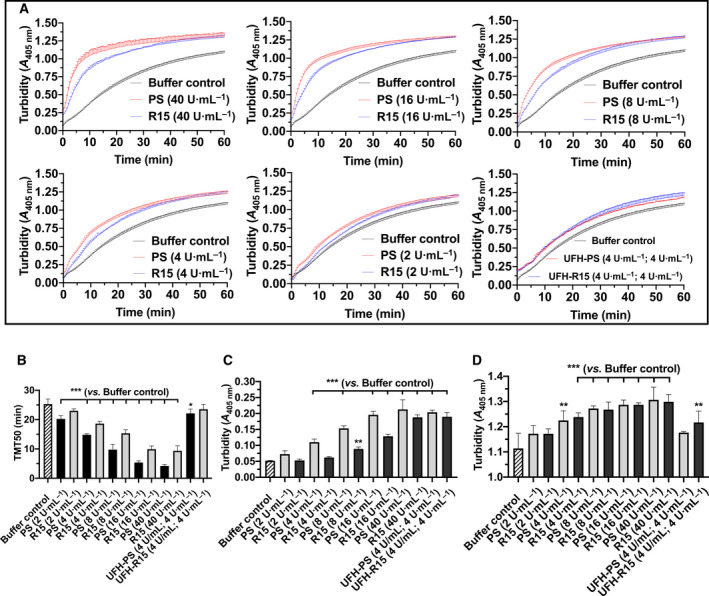
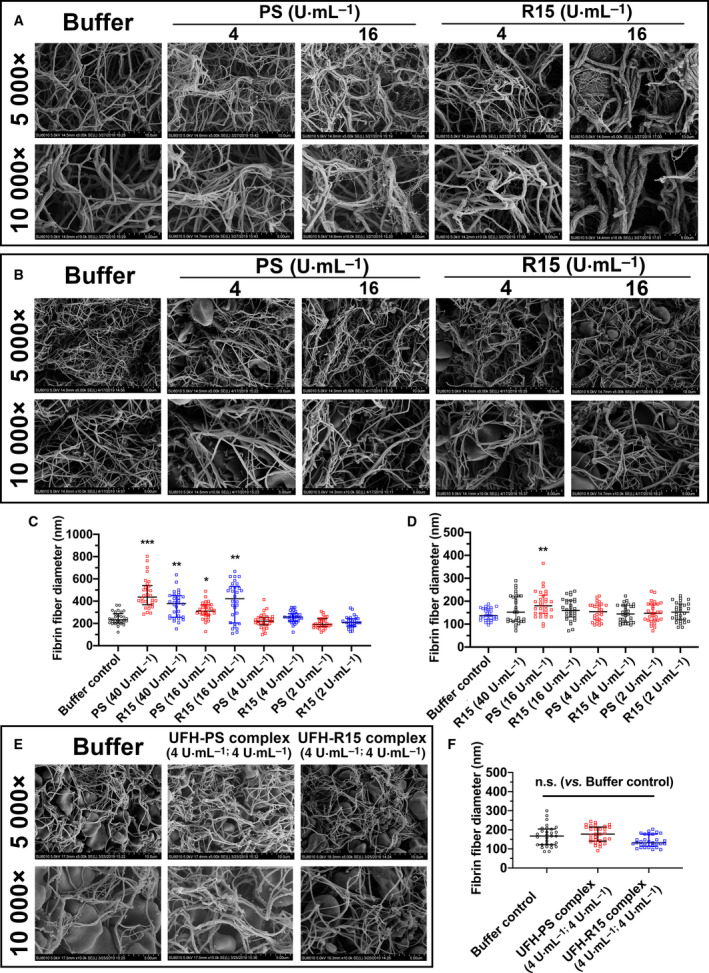
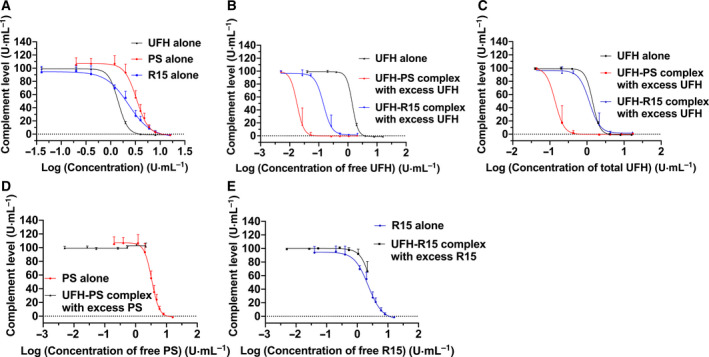
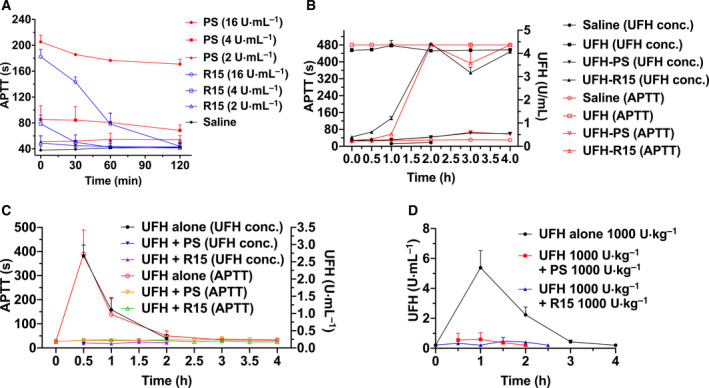
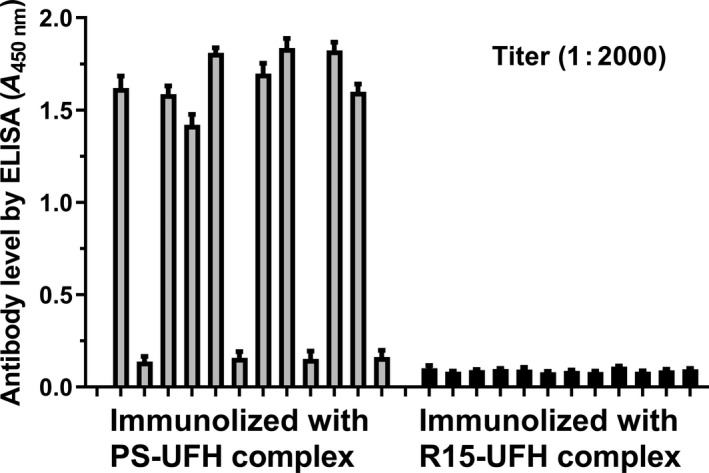
Unfractionated heparin (UFH) is an anionic glycosaminoglycan that is widely used to prevent blood clotting. However, in certain cases, unwanted side effects can require it to be neutralized. Protamine sulfate (PS), a basic peptide rich in arginine, is the only approved antagonist for UFH neutralization. Many adverse reactions occur with the clinical application of PS, including systemic hypotension, pulmonary hypertension, and anaphylaxis. We previously described R15, a linear peptide composed of 15 arginine molecules, as a potential UFH antagonist. In this study, the in-depth safety of R15 was explored to reveal its merits and associated risks in comparison with PS. In vitro safety studies investigated the interactions of R15 with erythrocytes, fibrin, complement, and rat plasma. In vivo safety studies explored potential toxicity and immunogenicity of R15 and the UFH-R15 complex. Results showed that both PS and R15 can induce erythrocyte aggregation, thicken fibrin fibers, activate complement, and cause anticoagulation in a concentration-dependent manner. However, those influences weakened in whole blood or in live animals and were avoided when R15 was in a complex with UFH. We found dramatically enhanced complement activation when there was excess UFH in analyses involving UFH-PS complexes, and a slight increase in those involving UFH-R15 complexes. Within 2 h, R15 was degraded in rat plasma in vitro, whereas PS was not. Enhanced creatinine was found after a single intravenous injection of PS or R15 (900 U·kg-1 , body weight), suggesting possible abnormal renal function. The UFH-PS complex, but not the UFH-R15 complex, exhibited obvious immunogenicity. In conclusion, R15 is nonimmunogenic and potentially safe at a therapeutic dose to reverse the effects of UFH.

Keywords: heparin reversal; heparin substitutes; immunogenicity; polyarginine; protamine.


Conflict of interest statement

The authors declare no conflict of interest.

Figures

Fig. 1
Fig. 1
Comparisons of three methods to measure the potency of PS and R15. (A) Comparison of PS potency determination between an active partial thromboplastin time (APTT) clotting assay and anti‐FXa assay. A fixed dose of UFH (APTT: 4 U·mL−1, final; anti‐FXa: 1 U·mL−1, final) was neutralized by the addition of PS with increasing concentrations. The y‐axis on the left represents changes of O.D. value of anti‐FXa assays, and the y‐axis on the right represents clotting times measured with APTT assays. (B, C) Potency determination of PS (B) and R15 (C) measured by both turbidity assays and anti‐FXa assays. Comparisons were made between anti‐FXa assays (UFH: 1 U·mL−1, final) and turbidity assays (4 U·mL−1, final). The x‐axis from (A–C) represents the supposed potency of either PS or R15. (D) APTT measurement of blood samples collected 3 min after UFH neutralization by PS and R15, respectively. The determined potency of PS and R15 was verified in Wistar rats in vivo aided by APTT assays (4 groups, n = 6 rats per group). Data are presented as mean ± SD. A one‐way ANOVA followed by Dunnett’s multiple comparisons test was used for the statistical analysis. n.s. represents P > 0.05. Tests of (A, B, and C) were performed in triplicate.
Fig. 2
Fig. 2
Interaction between PS and R15 on erythrocytes of Wistar rats. (A) Optical microphotographs of erythrocytes incubated with different concentrations of PS and R15 for 1 h at 37 °C, respectively. 50, 100, 500, 1000, and 5000 μg·mL−1 of PS and R15 were tested, and only 100, 500, and 1000 μg·mL−1 are depicted. BLK represents PBS‐treated erythrocytes taken as the control. There was no sign of aggregation in PS‐ and R15‐treated erythrocytes at concentrations of 50 and 100 μg·mL−1. The tendency of erythrocyte aggregation induced by PS and R15 was observed at a concentration of 500 μg·mL−1. Bulk aggregates of erythrocytes were seen at concentrations of 1000 and 5000 μg·mL−1. All images are at 400× magnification. The scale bar is 10 μm. The whole blood drawn from 3 rats through heart was mixed before the test. (B) The degree of erythrocyte aggregation measured with a viscosity conversion method. Erythrocytes were incubated with PS and R15 at 37 °C for 1 h, followed by the measurement of high and low shear rates. The aggregation index (AI) was calculated from the ratio of the low shear rate (1 s−1) to the high shear rate (200 s−1). The data are expressed as the mean ± SD, analyzed with a one‐way ANOVA and Dunnett’s multiple comparisons test. The whole blood collected from 6 rats through heart was mixed before the test. (C, D) The degree of hemolysis of erythrocytes incubated with PS, R15 (C), UFH–PS complex, and UFH–R15 complex (D) with varying concentrations for 1 h at 37 °C. PBS and 1% Triton were used as negative (0% of lysis) and positive controls (100% of lysis), respectively. The whole blood collected from 3 rats through heart was mixed before the test. (E) The mean osmotic resistance (MOR50) exposed to PS and R15. Increasing concentrations of NaCl in whole blood were incubated in the presence or absence (control) of different concentrations of PS and R15 at room temperature. MOR50 is the concentration of NaCl at which 50% of erythrocytes were lysed. Saline‐treated samples were set as a control (0%). Erythrocyte suspensions were centrifuged, and the degree of hemolysis was determined from the absorbance of supernatant at 540 nm. The whole blood collected from 3 rats through heart was mixed before the test. The results are expressed as the mean percentage of total hemolysis in comparison with controls ± SD. Kruskal–Wallis test, with Dunn’s multiple comparisons test. n.s. represents P > 0.05.
Fig. 3
Fig. 3
Impact of PS and R15 on pure fibrin formation. (A) Pure fibrin polymerization curves influenced by varying concentrations of PS, R15, UFH–PS complex, and UFH–R15 complex. Fibrinogen incubated with or without (control) PS and R15 for 10 min at 37 °C turned into fibrin after the addition of thrombin and CaCl2, resulting in enhanced turbidity at 405 nm. Turbidimetric changes in fibrin polymerization curves were recorded with microplate reader at 405 nm every 30 s for 60 min at 37 °C. (B) Time taken for half maximal turbidity (TMT50) calculated from fibrin polymerization curves. Turbidity was recorded before fibrin polymerization (C) and at the end of fibrin polymerization (D). (B) The addition of PS and R15 into fibrinogen increased the turbidity concentration‐dependently. (D) Turbidity at the end of fibrin polymerization. The data are expressed as the mean ± SD, analyzed with a one‐way ANOVA and Dunnett’s multiple comparisons test. *P < 0.05, **P < 0.01, and ***P < 0.001 vs. buffer control. Tests were performed in triplicate.
Fig. 4
Fig. 4
Morphology of fibrin strands formed in fibrinogen and whole blood of Wistar rats in the presence of PS, R15, and UFH–PS and UFH–R15 complexes with varying concentrations. The clot samples, whether pure fibrin fibers or whole blood fibrin fibers, were fixed with 2.5% glutaraldehyde for SEM observation. Images of all clots were captured from different areas at 5000× and 10 000× magnifications. The fiber diameters of 30 fibrin fibers from four separate areas of each image (prepared in a blinded fashion) were measured with imagej. (A) Characteristics of pure fibrin formed by adding thrombin and CaCl2 into fibrinogen in the presence of PS and R15 with increasing concentrations. PS and R15 at concentrations of 2, 4, 16, and 40 U·mL−1 were tested, and only 4 and 16 U·mL−1 are depicted. BLK represents HEPEs buffer‐treated fibrin taken as control. Both PS and R15 at a concentration of 16 U·mL−1 or greater thickened the fibrin fibers and twisted fibrin strands in an irregular manner, which was not found at a concentration of 4 U·mL−1 or lower. (B and E) Characteristics of whole blood fibrin of Wistar rats formed in blood in the presence of PS, R15 (B), UFH‐PS complex, and UFH–R15 complex (E). BLK represents HEPE buffer‐treated whole blood taken as control. (B) PS and R15 at concentrations of 2, 4, 16, and 40 U·mL−1 were tested, and only 4 and 16 U·mL−1 are depicted. (C) Fibrin fiber diameters measured from pure fibrin fibers in the presence of PS and R15. (D, F) Fibrin fiber diameters measured from whole blood clots in the presence of PS, R15 (D), UFH–PS complex, and UFH–R15 complex (F). No obvious changes in fibrin morphology or fibrin fiber diameters were found in the whole blood clots, except for PS‐treated fibrin at a concentration of 16 U·mL−1. In test (E), the whole blood was drawn from one rat through heart before the test. The scale bar of (A, B, E) is 10 μm (5000× magnification) and 5 μm (10 000× magnification), respectively. Data are presented as mean ± SD. Comparisons were made using Kruskal–Wallis test, with Dunn’s multiple comparisons test. *P < 0.05, **P < 0.01, and ***P < 0.001 vs. buffer control. n.s. represents P > 0.05.
Fig. 5
Fig. 5
Complement activation by PS, R15, and their UFH binding complexes. The complement activation assay was conducted with a hemolytic complement assay using sera of guinea pigs. The x‐axis represents the concentration of test substances in the form of a logarithm. The y‐axis represents the complement levels (%). Free UFH was theoretical unbound UFH when UFH was not fully neutralized by PS or R15. Free PS or free R15 was theoretical unbound PS or R15 when UFH was neutralized by overdosed PS or R15. Total UFH was the total amount of UFH, regardless of it being a binding antagonist. For a detailed description of this assay, please see Materials and methods. (A) Influence of UFH, PS, and R15 alone with varying concentrations of complement in the sera of guinea pigs. (B, C) Influence of UFH‐antagonist complex with excess UFH on complement in the sera of guinea pigs. Concentrations of free UFH (B) and total UFH (C) in the form of a logarithm are shown on x‐axis. (D, E) Influence of UFH‐antagonist complex with excess antagonist on complement in the sera of guinea pigs. Concentrations of free PS (D) and free R15 (E) in the form of a logarithm are shown on the x‐axis. Data are presented as mean ± SD. Tests were performed in triplicate.
Fig. 6
Fig. 6
Influence of PS and R15 on plasma of Wistar rats aided by APTT assays and anti‐FXa assays. (A) Incubation of PS and R15 with plasma of Wistar rats in vitro for 4 h. PS and R15 elevated APTT of rat plasma concentration‐dependently. The increased APTT induced by R15 declined to normal levels within 2 h, whereas the APTT of PS‐treated plasma was maintained. (B) Incubation of the UFH–PS and UFH–R15 complexes with the plasma of Wistar rats in vitro for 4 h. The release of UFH was detected after incubating UFH‐R15 complex with rat plasma aided by APTT assays and anti‐FXa assays. No detectable UFH release was found in the plasma treated with UFH‐PS complex. In test (A and B), the mixed rats’ plasma was prepared from whole blood of 3 rats. (C, D) UFH neutralization by PS and R15 in Wistar rats in vivo. Two doses of UFH (C: 300 U·kg−1 and D: 1000 U·kg−1) were injected into Wistar rats (4 groups, n = 6 rats per group), followed by PS or R15 reversal (C: 300 U·kg−1 and D: 1000 U·kg−1). Both PS and R15 completely neutralized the amount of UFH injected into Wistar rats without detectable UFH release. Data are presented as mean ± SD.
Fig. 7
Fig. 7
Detection of the UFH–PS and UFH–R15 complexes antibodies with enzyme‐linked immunosorbent assays (ELISA). Guinea pigs (n = 12) were immunized using the UFH–PS and UFH–R15 complexes (premixed before immunization). High‐affinity microplates coated with the UFH–PS and UFH–R15 complexes were used to detect antibody levels. Sera were diluted 2000 times with PBS buffer for detection. Data are presented as mean ± SD. The samples were measured with an ELISA method in triplicate.

Similar articles

References

    1. Ando T, Yamasaki M and Suzuki K (1973) Protamines. Isolation, characterization, structure and function. Mol Biol Biochem Biophys 12, 1–114. - PubMed
    1. Shapira N, Schaff HV, Piehler JM, White RD, Sill JC and Pluth JR (1982) Cardiovascular effects of protamine sulfate in man. J Thorac Cardiovasc Surg 84, 505–514. - PubMed
    1. Horrow JC (1985) Protamine: a review of its toxicity. Anesth Analg 64, 348–361. - PubMed
    1. Leung LWM, Gallagher MM, Evranos B, Bolten J, Madden BP, Wright S and Kaba RA (2019) Cardiac arrest following protamine administration: a case series. Europace 21, 886–892. - PubMed
    1. Zöllner H, Jouni R, Panzer S, Khadour A, Janzen L, Wesche J, ten Berg M, Schellong S, Heinken A, Greinacher Aet al. (2017) Platelet activation in the presence of neutral protamine Hagedorn insulin: a new feature of antibodies against protamine/heparin complexes. J Thromb Haemost 15, 176–184. - PubMed