. 2021 Jun 29:10:e65764.
doi: 10.7554/eLife.65764.

Specialized coding patterns among dorsomedial prefrontal neuronal ensembles predict conditioned reward seeking

Affiliations

Specialized coding patterns among dorsomedial prefrontal neuronal ensembles predict conditioned reward seeking

Roger I Grant et al. Elife. .

Abstract

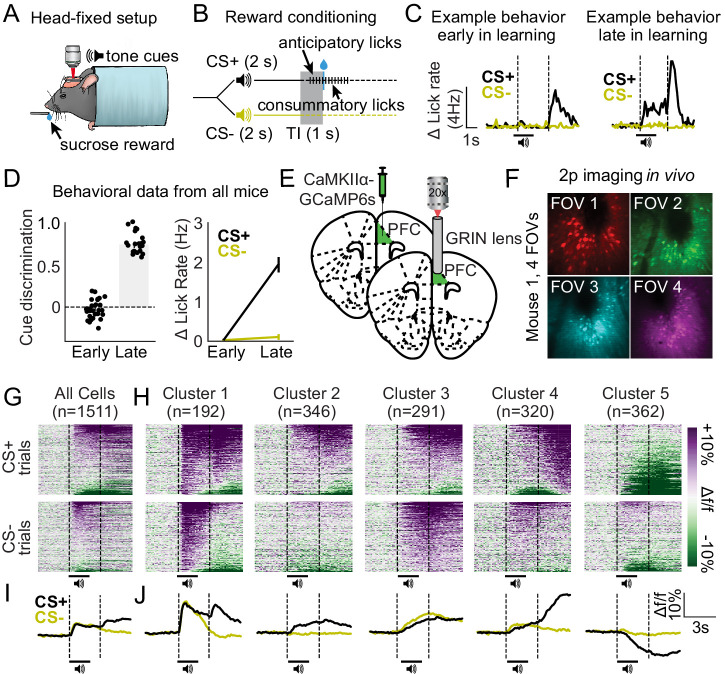
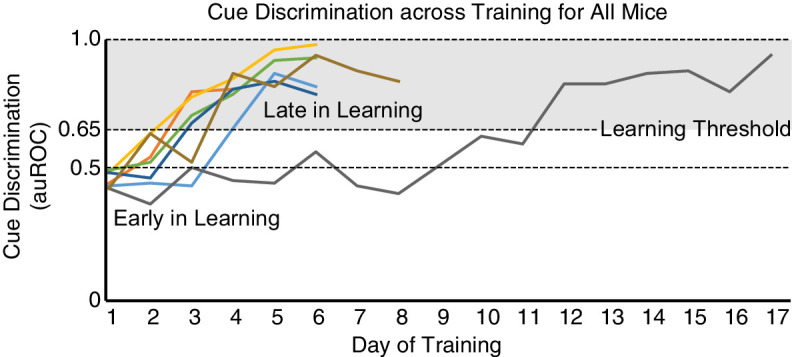
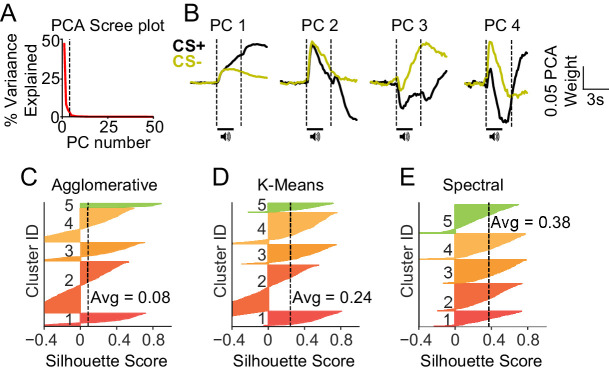
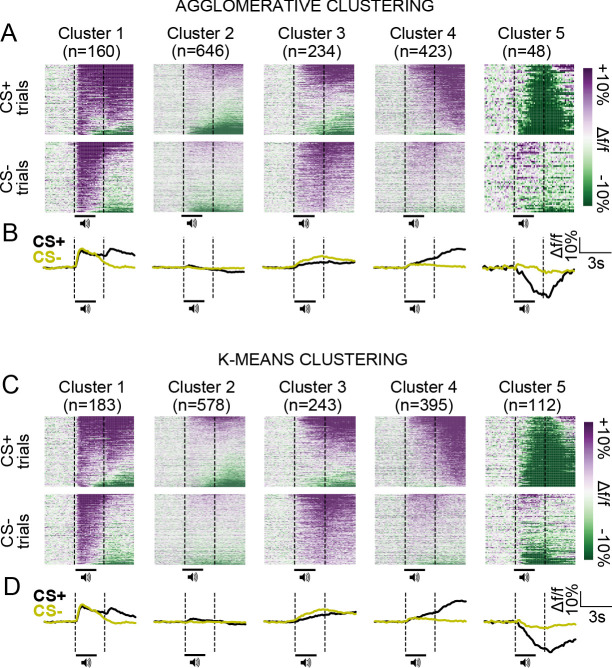
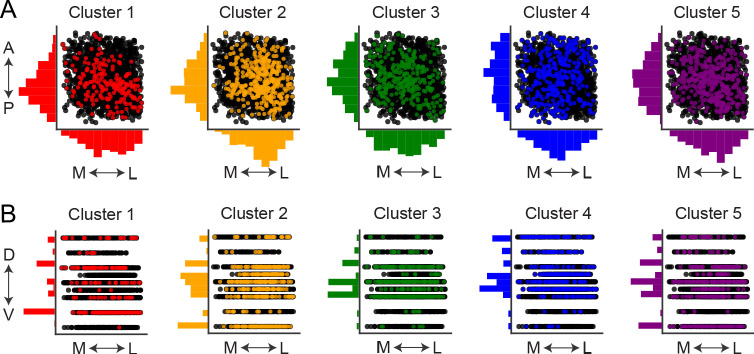
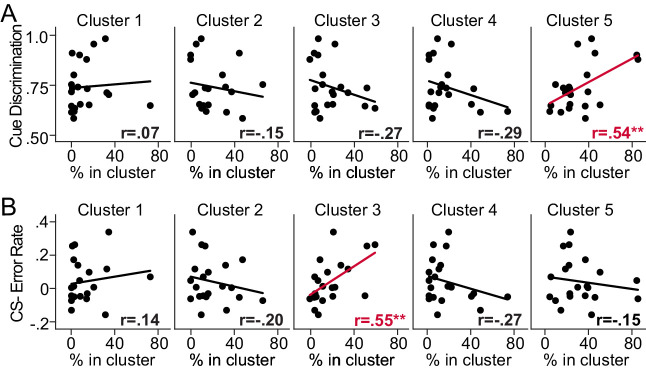
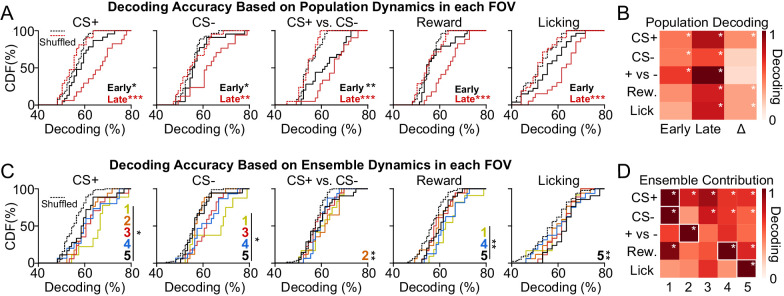
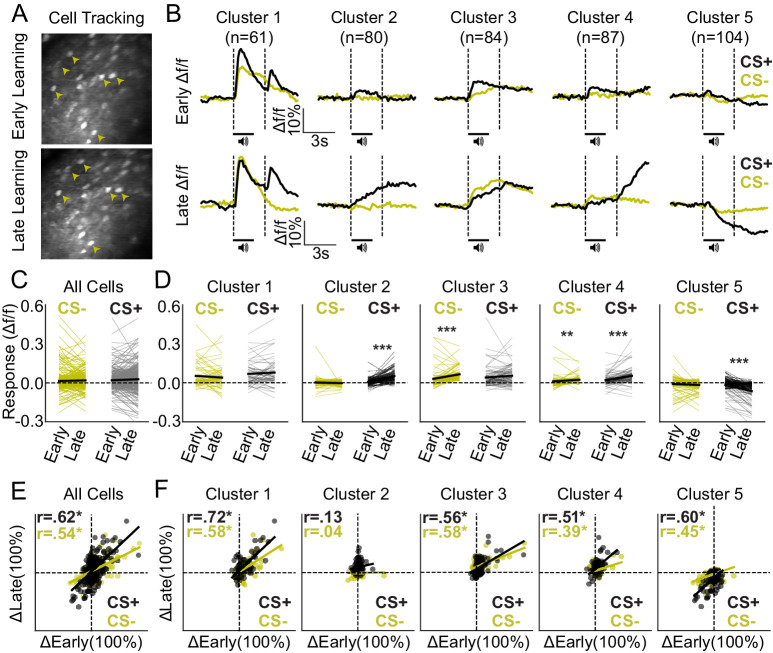
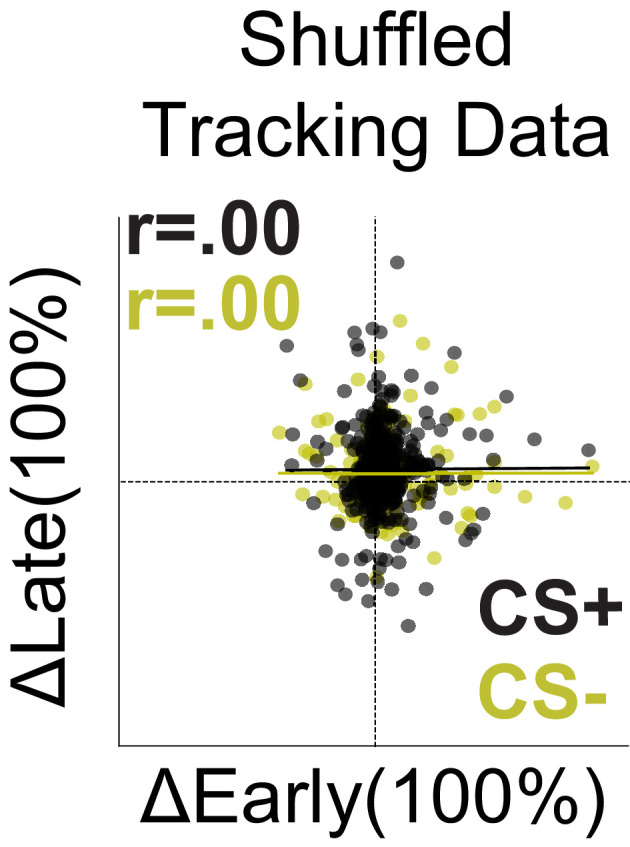
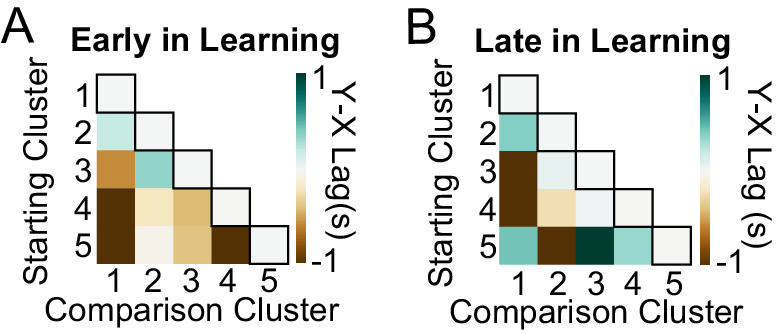
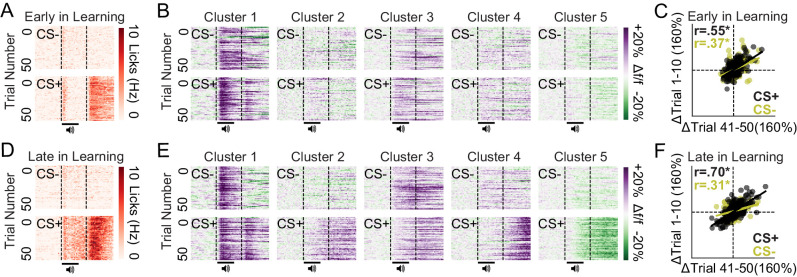
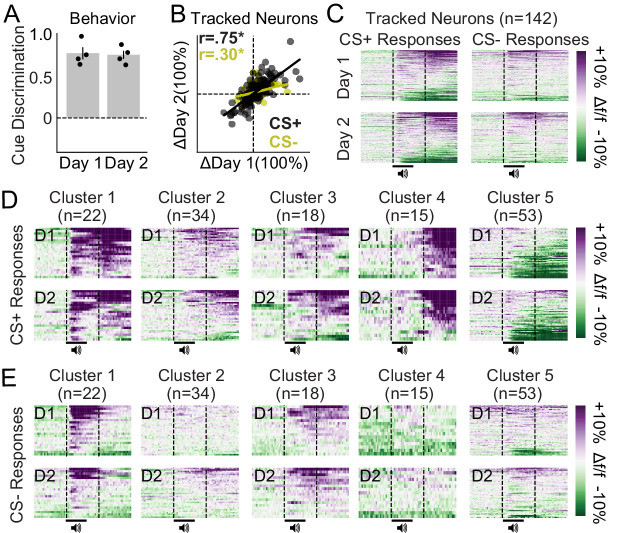
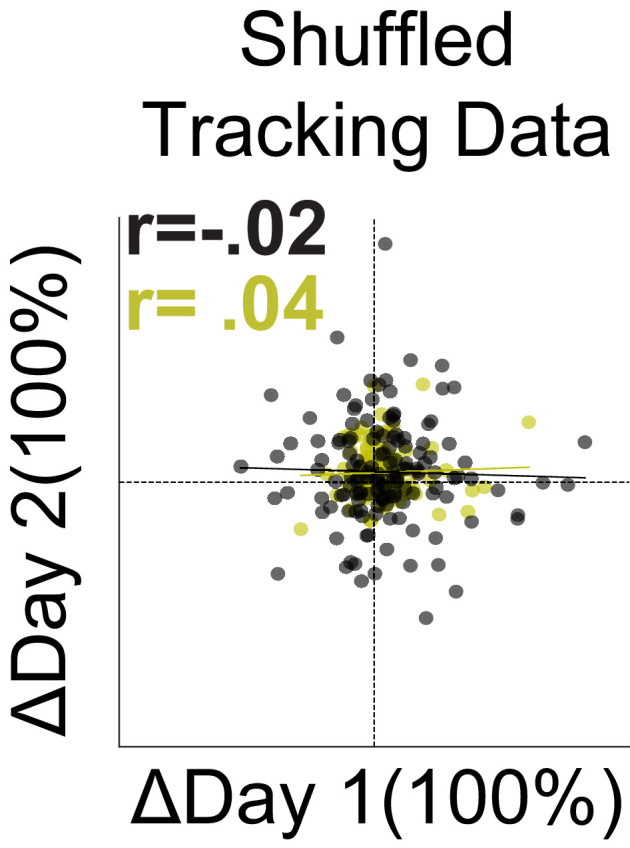
Non-overlapping cell populations within dorsomedial prefrontal cortex (dmPFC), defined by gene expression or projection target, control dissociable aspects of reward seeking through unique activity patterns. However, even within these defined cell populations, considerable cell-to-cell variability is found, suggesting that greater resolution is needed to understand information processing in dmPFC. Here, we use two-photon calcium imaging in awake, behaving mice to monitor the activity of dmPFC excitatory neurons throughout Pavlovian reward conditioning. We characterize five unique neuronal ensembles that each encodes specialized information related to a sucrose reward, reward-predictive cues, and behavioral responses to those cues. The ensembles differentially emerge across daily training sessions - and stabilize after learning - in a manner that improves the predictive validity of dmPFC activity dynamics for deciphering variables related to behavioral conditioning. Our results characterize the complex dmPFC neuronal ensemble dynamics that stably predict reward availability and initiation of conditioned reward seeking following cue-reward learning.

Keywords: addiction; circuits; cortical; memory; mouse; neuroscience; prelimbic; value.


Conflict of interest statement

RG, ED, KV, KW, ER, PS, HH, CB, JO No competing interests declared

Figures

Figure 1.
Figure 1.. Distinct excitatory neuronal ensembles revealed in dorsomedial prefrontal cortex (dmPFC) during head-fixed Pavlovian conditioning.
(A) Illustration of head fixation for reward conditioning experiments with concurrent two-photon imaging. (B) Schematic for reward conditioning experiments, in which the CS+ and CS- are presented in a random order 50 times each. The CS+ denotes the availability of a liquid sucrose reward following a 1 s trace interval (TI). Anticipatory licks are seen during the trace interval in well-trained mice. (C) Example behavior data during early in learning (left) vs. late in learning (right) behavioral sessions. (D) Cue discrimination scores (auROC; CS+ vs. CS-) and change in lick rate for each cue during early and late in learning behavioral sessions. Data presented as mean ± SEM. (E–F) Surgery schematic (E) allowing for in vivo imaging of GCaMP6s-expressing neurons (F). (G–H) Heat maps displaying the responses of all dmPFC neurons (G) and responses separated by cluster (H) aligned to the cues. (I–J) Line plots displaying the mean activity traces of all cells (I) and mean activity of all cells separated by cluster (J).
Figure 1—figure supplement 1.
Figure 1—figure supplement 1.. Behavioral task acquisition across days for each mouse.
Cue discrimination (CS+ vs. CS- trials; normalized auROC) scores for each mouse plotted across days. Early in learning is defined as any session before a score of 0.3 or above is reached. Late in learning is defined as any session on days thereafter, wherein a score above 0.31 is achieved.
Figure 1—figure supplement 2.
Figure 1—figure supplement 2.. Visualizing dorsomedial prefrontal cortex (dmPFC) excitatory neurons within unique fields of view (FOVs) in a single mouse.
(A–B) Images show GCaMP6s expression in dmPFC at multiple Z-planes, each separated by 50 µm along the Z-axis. Images are color coded red (left) or green (middle) to allow assessment of overlapping neurons (right). The lack of overlap in fluorescence between FOV 1 and FOV 2 (A), and between FOV 2 and FOV 3 (B) confirms visualization of unique neurons in each FOV.
Figure 1—figure supplement 3.
Figure 1—figure supplement 3.. Principal components analysis (PCA)-based clustering reveals unique silhouette scores for different clustering models.
(A–B) PCA scree plot shows variance explained by principal components (PCs) (A) and PCs formed prior to scree plot inflection point (n = 4 PCs; B). (C–E) Silhouette plots show the relative fit of each neuron for formed clusters based on agglomerative (C), K-means (D), and spectral (E) clustering models. Spectral clustering had improved average performance as compared with agglomerative and K-means models (see inset scores), and thus was used for clustering analyses as shown in Figure 1.
Figure 1—figure supplement 4.
Figure 1—figure supplement 4.. Similar neuronal ensembles defined by agglomerative and K-means clustering as compared with spectral clustering (see Figure 1).
(A) Heat maps displaying responses in dorsomedial prefrontal cortex (dmPFC) neurons separated by cluster formed by agglomerative clustering and aligned to cues. (B) Line plots displaying the mean activity traces of cells separated by agglomerative clustering. (C) Heat maps displaying responses in dmPFC neurons separated by cluster formed by K-means clustering and aligned to cues. (D) Line plots displaying the mean activity traces of cells separated by K-means clustering.
Figure 1—figure supplement 5.
Figure 1—figure supplement 5.. Estimated relative locations of each neuron across the anterior-posterior (A–P), medial-lateral (M–L), and dorsal-ventral (D–V) axes of dorsomedial prefrontal cortex (dmPFC).
(A) Estimated relative locations of all recorded neurons, grouped by cluster, late in learning across A–P and M–L axes. Colored circles represent neurons classified within each cell cluster, whereas black circles are neurons classified to be within other cell clusters. These approximated locations are based on the pixel-to-pixel positions of each neuron in each field of view (FOV), averaged across FOVs. A total of 512 pixels are included across the X and Y axes. (B) Estimated relative locations of all recorded neurons, grouped by cluster, late in learning across the D–V and M–L axes. These approximated locations are based on focal distance in the D–V axis from the bottom of the GRIN lens (anywhere from 0 to 300 µm of objective movement) and pixel-to-pixel positions of each neuron in the M–L axis (including a total of 512 pixels), averaged across FOVs. Histograms along the outside of each axis represent the kernel density estimations (along 10 or fewer bins) for cell locations along each plane, normalized for each cluster. Measurements are not to scale as locations are approximate and relative (see Materials and methods).
Figure 2.
Figure 2.. Behavioral performance is predicted by the relative percentage of dorsomedial prefrontal cortex (dmPFC) excitatory neurons within select ensembles.
(A) Correlation plots separated by cluster displaying the relationship between cue discrimination behavioral scores after learning (auROCs: CS+ vs. CS- licking) and the percentage of detected neurons in a cluster during that behavioral session. The relative percentage of neurons in Cluster 5 positively predicted behavioral performance (**p-value = 0.012). (B) Correlation plots separated by cluster displaying the relationship between CS- licking error rate after learning (auROC: CS- vs. baseline licking) and the percentage of neurons in a cluster during that behavioral session. The percentage of neurons in Cluster 3 positively predicted CS- licking error rate (**p-value = 0.009).
Figure 3.
Figure 3.. Activity of dorsomedial prefrontal cortex (dmPFC) excitatory neuronal ensembles can decode specialized information related to reward seeking.
(A) Cumulative distribution frequency (CDF) plots illustrating the population decoding accuracy for variables related to conditioned reward seeking (CS+, CS-, CS+ vs. CS-, reward, and licking). Dotted lines refer to shuffled control data for early and late in learning. (B) Heat maps depicting population decoding accuracy early in learning (first column), late in learning (second column), and the change across learning (third column). Data have been normalized to CS+ vs. CS- late in learning to provide comparison of decoding strength across variables. (C) CDF plots illustrating the decoding accuracy of specific ensembles for variables related to conditioned reward seeking. Dotted lines refer to shuffled control data for all ensembles. (D) Heat maps depicting the contribution of each ensemble to decoding, with each column corresponding to a different ensemble. Data have been normalized to the maximum decoding strength by an ensemble for each variable to allow comparison of ensemble decoding strength across each variable. *p-value < 0.05; **p-value < 0.01; ***p-value < 0.001 for post hoc comparisons.
Figure 4.
Figure 4.. Ensemble-specific activity dynamics differentially evolve across learning.
(A) Example field of view (FOV) showing the same neurons (arrowheads) from early (top) and late (bottom) in learning sessions, tracked across days. (B) Mean activity traces during CS+ and CS- trials for each ensemble early (top row) and late (bottom row) in learning. (C) Mean responses of all tracked neurons during CS+ and CS- trials early and late in learning. (D) Responses separated by cluster reveal adaptations in CS+ and/or CS- encoding for Clusters 2–5, but no significant changes for Cluster 1. ***p-value < 0.001; **p-values = 0.01. (E) Correlation plot displaying mean responses (baseline vs. cue/reward period) of all tracked neurons during CS+ and CS- trials early and late in learning. (F) Correlation plots separated by cluster displaying the mean response of each neuron early and late in learning. Pearson-R values are displayed in the top left corner for all cells and for each ensemble (E–F). *p-value < 0.05.
Figure 4—figure supplement 1.
Figure 4—figure supplement 1.. Correlations in activity from early to late in learning are not due to similarities in activity across neurons within each field of view (FOV).
Correlation plot displaying mean responses (baseline vs. cue/reward period) of all tracked neurons during CS+ and CS- trials early and late in learning, but with tracking IDs shuffled within each FOV to cause inaccurate cell tracking. Lack of correlation (as compared to Figure 4E) suggests neuron-to-neuron correlations in activity were present, rather than general correlations in activity across neurons within each FOV.
Figure 4—figure supplement 2.
Figure 4—figure supplement 2.. Average neuron-to-neuron lags reveal signal coherence between neurons of the same cluster both early and late in learning.
(A–B) Heat maps showing average lag of all tracked neurons early in learning (A) and late in learning (B). Data reveals that there was no lag between neurons of the same cluster (bordered boxes show within-cluster lags) both early in learning and late in learning. Lag was common between neurons of different clusters as can be seen in the brown boxes and teal boxes.
Figure 5.
Figure 5.. Stable conditioned licking and ensemble-specific cue responses within early and late in learning behavioral sessions.
(A) Licking heat maps from sessions early in learning averaged across mice reveal stable licking across CS+ but not CS- trials, specifically during the 3 s reward epoch. (B) Activity heat maps from sessions early in learning averaged across neurons reveal consistent activity patterns across CS+ and CS- trials for each cluster. (C) Mean cue responses of all neurons in the first 10 trials during early in learning sessions were correlated with mean cue responses during the last 10 trials during early in learning sessions. (E) Licking heat maps from sessions late in learning averaged across mice reveal stable licking across CS+ but not CS- trials, specifically during CS+ delivery and subsequent 3 s reward epoch. (F) Activity heat maps from sessions late in learning averaged across neurons reveal consistent activity patterns across CS+ and CS- trials for each cluster. (G) Mean cue responses of all neurons in the first 10 trials during late in learning sessions were correlated with mean cue responses during the last 10 trials during late in learning sessions. *p-values < 0.001.
Figure 6.
Figure 6.. Ensemble-specific activity dynamics are maintained across days after learning.
(A) Cue discrimination scores (auROC; CS+ vs. CS-) showing similar behavior across days after learning. Data presented as mean ± SEM. (B) Correlation plots displaying the change in activity during CS+ and CS- trials for all tracked neurons during two imaging sessions late in learning. These responses were highly correlated (*p-values < 0.001). (C) Activity heat maps for all tracked neurons separated by cue (columns) and day (rows) reveal similar population dynamics across days after learning. (D–E) Activity heat maps for each ensemble separated into CS+ trials (D) and CS- trials (E) confirm similar activity patterns across days after learning.
Figure 6—figure supplement 1.
Figure 6—figure supplement 1.. Correlations in activity across sessions after learning are not due to similarities in activity across neurons within each field of view (FOV).
Correlation plot displaying mean responses (baseline vs. cue/reward period) of all tracked neurons during CS+ and CS- trials across two sessions after learning, but with tracking IDs shuffled within each FOV to cause inaccurate cell tracking. Lack of correlation (as compared to Figure 6B) suggests neuron-to-neuron correlations in activity were present within the dataset rather than general correlations in activity within each FOV.

References

    1. Bissonette GB, Roesch MR. Neural correlates of rules and conflict in medial prefrontal cortex during decision and feedback epochs. Frontiers in Behavioral Neuroscience. 2015;9:266. doi: 10.3389/fnbeh.2015.00266. - DOI - PMC - PubMed
    1. Brebner LS, Ziminski JJ, Margetts-Smith G, Sieburg MC, Reeve HM, Nowotny T, Hirrlinger J, Heintz TG, Lagnado L, Kato S, Kobayashi K, Ramsey LA, Hall CN, Crombag HS, Koya E. The emergence of a stable neuronal ensemble from a wider pool of activated neurons in the dorsal medial prefrontal cortex during appetitive learning in mice. The Journal of Neuroscience. 2020;40:395–410. doi: 10.1523/JNEUROSCI.1496-19.2019. - DOI - PMC - PubMed
    1. Cadwell CR, Palasantza A, Jiang X, Berens P, Deng Q, Yilmaz M, Reimer J, Shen S, Bethge M, Tolias KF, Sandberg R, Tolias AS. Electrophysiological, transcriptomic and morphologic profiling of single neurons using Patch-seq. Nature Biotechnology. 2016;34:199–203. doi: 10.1038/nbt.3445. - DOI - PMC - PubMed
    1. Cadwell CR, Scala F, Li S, Livrizzi G, Shen S, Sandberg R, Jiang X, Tolias AS. Multimodal profiling of single-cell morphology, electrophysiology, and gene expression using Patch-seq. Nature Protocols. 2017;12:2531–2553. doi: 10.1038/nprot.2017.120. - DOI - PMC - PubMed
    1. Chen L, Wang Y, Niu C, Zhong S, Hu H, Chen P, Zhang S, Chen G, Deng F, Lai S, Wang J, Huang L, Huang R. Common and distinct abnormal frontal-limbic system structural and functional patterns in patients with major depression and bipolar disorder. NeuroImage: Clinical. 2018;20:42–50. doi: 10.1016/j.nicl.2018.07.002. - DOI - PMC - PubMed

Publication types