. 2021 May 15;10(5):bio057729.
doi: 10.1242/bio.057729. Epub 2021 May 26.

KDM5A and KDM5B histone-demethylases contribute to HU-induced replication stress response and tolerance

Affiliations

KDM5A and KDM5B histone-demethylases contribute to HU-induced replication stress response and tolerance

Solenne Gaillard et al. Biol Open. .

Abstract

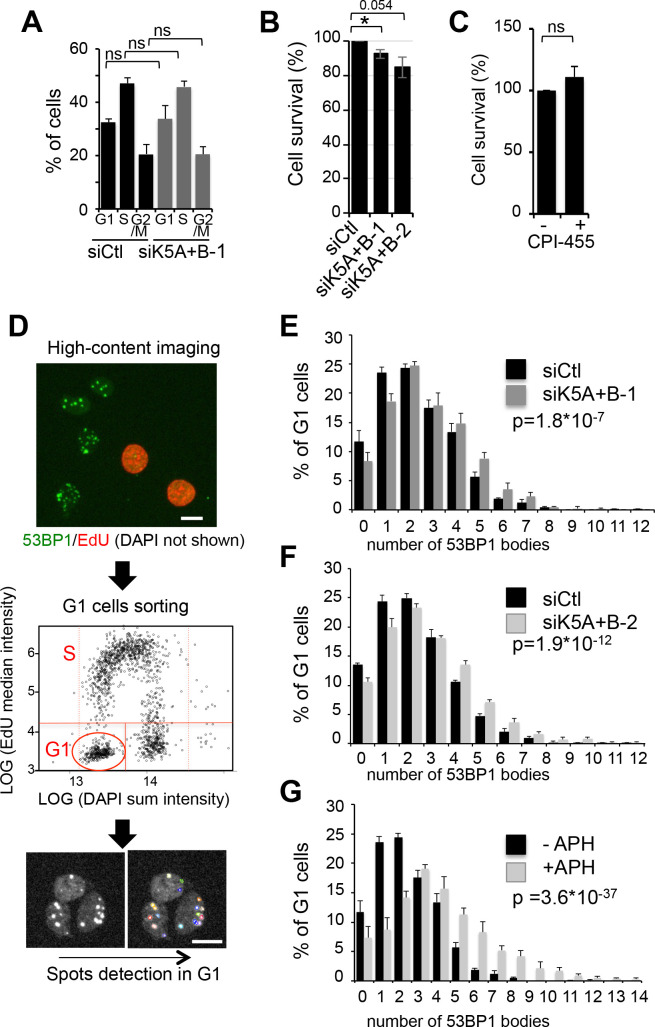
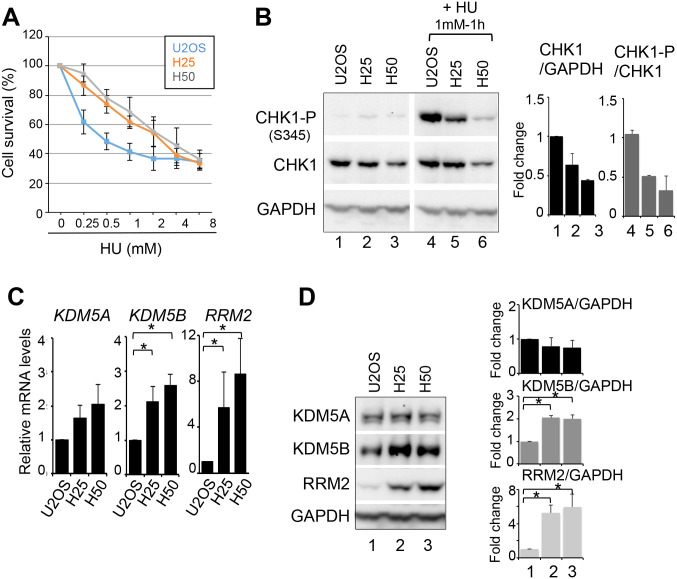
KDM5A and KDM5B histone-demethylases are overexpressed in many cancers and have been involved in drug tolerance. Here, we describe that KDM5A, together with KDM5B, contribute to replication stress (RS) response and tolerance. First, they positively regulate RRM2, the regulatory subunit of ribonucleotide reductase. Second, they are required for optimal levels of activated Chk1, a major player of the intra-S phase checkpoint that protects cells from RS. We also found that KDM5A is enriched at ongoing replication forks and associates with both PCNA and Chk1. Because RRM2 is a major determinant of replication stress tolerance, we developed cells resistant to HU, and show that KDM5A/B proteins are required for both RRM2 overexpression and tolerance to HU. Altogether, our results indicate that KDM5A/B are major players of RS management. They also show that drugs targeting the enzymatic activity of KDM5 proteins may not affect all cancer-related consequences of KDM5A/B overexpression.

Keywords: Chromatin; Drug tolerance; Replication stress.


Conflict of interest statement

Competing interests The authors declare no competing or financial interests.

Figures

Fig. 1.
Fig. 1.
KDM5A/B positively regulates RRM2 expression. (A) Relative mRNA expression levels of KDM5A, KDM5B, RRM2, CDC6, CCNE1 and CHK1 upon transfection of the indicated siRNA in U2OS cells (siCtl corresponds to a non-targeting pool of siRNA). Expression levels were normalized to the reference gene P0 (ribosomal phosphoprotein P0) and calculated relative to 1 for the siCtl sample. mean±s.d., n=3 *P<0.05 (paired t-test) (B) Same as in A with another couple of KDM5A and KDM5B siRNAs. *P<0.05 (paired t-test). (C) Western blot analysis of KDM5A, KDM5B, RRM2 and GAPDH as a loading control from U2OS cells transfected with siRNA directed against KDM5A and KDM5B. Two distinct couples of siRNA (siK5A+B-1 and −2) were used. Quantification is shown in the right panel, following normalization to 1 for siCtl treated cells. mean±s.e.m., n=3. *P<0.05 (paired t-test). (D) ChIP analysis of KDM5A presence on the RRM2, CDC6 and CHK1 promoters (Prom.) and coding (Cod.) regions. The myogenin gene (MYOG) is not expressed in U2OS cells and its promoter serves as a negative control. A representative experiment out of three is shown. (E) Experimental design for CPI-455 treatments in panels F, G and H. (F) Western blot analysis of H3K4me3 and total H3 from U2OS cells treated with CPI-455 (+) or DMSO (−). A quantification of H3K4me3/H3 is shown in the right panel following normalization to 1 for siCtl cells. mean±s.e.m., n=3. *P<0.05 (paired t-test). (G) Relative mRNA expression levels of KDM5A, KDM5B and RRM2 in cells treated as in F. Expression levels were normalized to the reference gene P0 and calculated relative to 1 for the siCtl sample. mean±s.e.m., n=3. A paired t-test indicated no significant difference between CPI treated and untreated cells for the three genes. (H) Western blot analysis of KDM5A, KDM5B, RRM2 and GAPDH from U2OS cells treated as in F. Quantification is shown in the right panel following normalization to 1 for DMSO treated cells. mean±s.e.m., n=3. *P<0.05 (paired t-test).
Fig. 2.
Fig. 2.
KDM5A and KDM5B inhibition induces replicative stress. (A) Cell cycle distribution of U2OS cells depleted for KDM5A and KDM5B using siK5A+B-1 compared to siCtl treated cells, analysed by the high content imaging system Operetta following EdU labelling and DAPI staining. mean±s.d., n=3. ns, non-significant (paired t-test). (B) Percentage of living cells following depletion of KDM5A and KDM5B using siK5A+B-1 or siK5A+B-2 siRNAs, following normalization to 100 for siCtl treated cells. mean±s.d., n=3. *P<0.05 or=0.054 (paired t-test). (C) Percentage of living cells following treatment each 24 h with CPI-455 (+) or DMSO (−) for 72 h and following normalization to 100 for DMSO treated cells. mean±s.d., n=3. ns, non-significant (paired t-test). (D) Schematic representation of the analysis used in E, F and G. (E) U2OS cells were transfected with siRNA directed against KDM5A and KDM5B (siK5A+B-1), or a non-targeting siRNA pool as control (siCtl) and stained for 53BP1, EdU (added in the medium 30 min before fixation) and DAPI. Images were acquired with the Operetta device and 53BP1 bodies were counted in G1 cells nuclei (sorted by EdU/DAPI staining), using the Colombus software. Number of G1 cells analysed was >700 for each condition. P-values of the difference to the control sample are indicated (Wilcoxon test). (F) Same as in E, except that another couple of KDM5A and KDM5B siRNAs was used. (G) Same as in E, except that cells were treated or not with 0.2 µM aphidicholin rather than transfected with siRNAs.
Fig. 3.
Fig. 3.
KDM5A/B protect cells from HU-induced replication stress. (A) Clonogenic assay of cells treated with siRNA directed against KDM5A-1 and KDM5B-1 or a non-targeting siRNA pool as control (siCtl), and exposed for 24 h to 50 µM HU, before allowing clones to grow for 10 days more. The number of clones was normalized to 100 for untreated siCtl cells. mean±s.e.m., n=3. *P<0.05 (paired t-test). (B) U2OS cells were electroporated with the indicated siRNA (siK5A-4 targets the 5′UTR of KDM5A) and 24 h later transfected with the indicated expression vector coding for wild-type KDM5A (pKDM5A WT) or a histone demethylase-defective mutant (MUT). To ensure efficient knockdown of KDM5A and KDM5B throughout the time course of the experiment, cells were transfected once more with siRNA 24 h following plasmids transfection, and cells were harvested and counted 24 h following this second siRNA transfection. The percentage of viable cells following normalization to 100 for untreated cells is represented. mean±s.e.m., n=4. *P<0.05 (paired t-test). ns, non-significant. (C) U2OS cells were electroporated with the indicated siRNA. 24 h later, they were incubated with 50 µM HU for further 24 h or left untreated. Cells were labelled with EdU during 30 min before fixation, stained for EdU and DAPI, and images were acquired using the operetta device. Cell cycle distribution was analysed thanks to the Colombus software. A representative experiment is shown. (D) Cells were transfected as in C, and treated with 50 µM HU for 24 h or left untreated. Cells were labelled with EdU during 30 min before fixation and stained for γ-H2AX, EdU incorporation, and DNA content by DAPI. Images were acquired using the high-content imaging device Operetta. Representative images from the experiment quantified in E and F are shown. Scale bar: 5 µM. (E) Cells were transfected by the indicated siRNA and treated or not with 50 µM HU, as indicated in C. γH2AX staining was quantified in the nuclei (spots total intensity) of S phase cells (sorted according to EdU/DAPI staining). A representative experiment out of three is shown. Results are presented as box-plots showing the median, the 25% and 75% quantiles and extrema. Number of S phase cells is >650 cells for each point. P-values are indicated (Wilcoxon). ns, non-significant. (F) Cells were transfected as in E, and EdU staining in S phase nuclei was measured. The median intensity of EdU per nucleus is represented as box-plots. Number of S phase cells >1000 for each point. P-values are indicated (Wilcoxon). (G) As in D, except that cells were treated with 1 mM HU for 0, 30, or 60 min as indicated. Cells were stained for γ-H2AX and DNA content by DAPI. Images were acquired using the operetta device. Representative images of cells from the 60 min point from the experiment quantified in H are shown. Scale bar: 5 µM. (H) Cells were treated as in G. Total nuclear intensity of γ-H2AX was quantified in nuclei of S phase U2OS cells, sorted according to DAPI staining, and presented as box-plots. A representative experiment out of three is shown. Number of S phase cells examined >1200 for each point. P-values are indicated (Wilcoxon).
Fig. 4.
Fig. 4.
KDM5A and B depletion affects the ATR-CHK1 pathway. (A) Relative mRNA expression of several components of the ATR-CHK1 pathway (CHK1 is presented in Fig. 1A) in U2OS cells treated with siRNA directed against KDM5A or/and KDM5B or a non-targeting siRNA as control (siCtl). mRNA expression is normalized with the reference gene P0, and calculated relative to 1 for the siCtl. mean±s.d., n=3. *P<0.05 (paired t-test). (B) U2OS cells were transfected by the indicated siRNA, treated or not with 1 mM of HU for the indicated time and subjected to western blot analysis of KDM5A, KDM5B, CHK1 and S345-phospho CHK1 (CHK1-P) expression. GAPDH is used as a loading control. A representative western blot out of three is shown. (C) Quantifications of panel B for CHK1 normalized with GAPDH and CHK1-P normalized with CHK1, mean±s.e.m., n=3. *P<0.05 (paired t-test). Note that the same quantification is shown in Fig. S3 with individual siRNA transfection included. (D) U2OS cells were transfected by the indicated siRNA, treated or not with 1 mM of HU for the indicated time and subjected to western blot analysis of ATR, Ser1989-phospho ATR (ATR-P), S33-phospho RPA (RPA-P), and RPA expression levels. GAPDH serves as a loading control. A representative experiment is shown. (E,F) Quantifications of panel D for RPA-P relative to GAPDH (E), and for ATR relative to GAPDH and ATR-P relative to ATR (F), in untreated and after 4 h of treatment with 1 mM HU, respectively. mean±s.e.m., n=3. *P<0.05, ns, non-significant (paired t-test).
Fig. 5.
Fig. 5.
KDM5A is recruited at replication forks in proximity with PCNA and Chk1. (A) Schematic description of the iPOND experiment. Active forks are labelled with EdU (1). Upon thymidine chase, labelled DNA is not associated with a fork (2). Upon HU treatment labelled forks are stalled (3). More details can be found in the Materials and Methods section. (B) HeLa S3 cells were labelled with EdU for 15 min (EdU). For thymidine chase experiment, cells were labelled with EdU for 15 min, then washed and 10 mM Thymidine was added for 120 min (Thym 120′). For HU treatment cells were labelled with EdU for 15 min, then washed and 1 mM HU was added for 120 min (HU 120′). EdU labelled DNA fragments were precipitated and co-precipitated proteins analysed by western blot for the presence of PCNA, KDM5A, KDM5B, RAD51 and H3 as a loading control. For the control, the click-it reaction was performed for all samples (+) except for the control (−). (C) Quantification of iPOND experiments. Bar plots indicate the mean and s.e.m. from two independent experiments for PCNA, KDM5B, KDM5A following normalization to 1 for EdU and for RAD51 following normalization to 1 for HU. (D) PLA between KDM5A and PCNA in U2OS cells. Antibodies directed against KDM5A and PCNA were used either separately or together, as indicated. Representative images are shown in the left panel. The number of dots per nucleus was counted in each condition using the Colombus software. Results are presented in the right panel as box-plots showing the median, the 25% and 75% quantiles and extrema below the images, number of counted cells is >100 cells for each point. * indicates a P-value <10−35. (E) As in D, except that KDM5A antibodies and Chk1 antibodies were used. * indicates a P-value<10−37. (F) PLA between KDM5A and PCNA as in D, following treatment of cells with 1 mM HU for 1 h (+) or left untreated. The median number of dots was calculated relative to 100 for the sample with the two antibodies together and without HU. n=3. mean±s.e.m. *<0.05 (paired t-test). (G) PLA between KDM5A and CHK1 as in E, following treatment of cells with 1 mM HU for 1 h (+) or left untreated (−). The median number of dots was calculated relative to 100 for the sample with the two antibodies together and without HU. n=3. mean±s.e.m. The P-value (paired t-test) is indicated.
Fig. 6.
Fig. 6.
HU tolerant cells overexpress RRM2 and KDM5B. (A) Viability of U2OS, H25 and H50, measured by WST assay, 72 h following treatment with increasing doses of HU, as indicated. mean±s.e.m., n=3. (B) Left panel: western blot analysis of CHK1 and S345-phospho CHK1 (CHK1-P) expression, in U2OS, H25 and H50 cells before and following 1 h treatment with 1 mM HU. Right panel: quantification following normalization to 1 for U2OS cells. mean±s.e.m., n=2. (C) Relative mRNA expression levels of KDM5A, KDM5B, and RRM2 in U2OS, H25 and H50 cells. Expression levels were normalized to the reference gene P0 (ribosomal phosphoprotein P0) and calculated relative to 1 for the siCtl sample. mean±s.d., n=3, *P<0.05 (paired t-test). (D) Left panel: levels of KDM5A, KDM5B and RRM2 expression levels were analysed by western blot in the parental U2OS cells and its HU tolerant derivatives H25 and H50 grown in 0.25 mM and 0.5 mM HU, respectively. GAPDH is used as a loading control. Right panel: quantification following normalization to 1 for U2OS cells. mean±s.e.m., n=3. *P<0.05 (paired t-test). For panels B to D, note that H25 and H50 are routinely grown in medium containing 0.25 mM or 0.5 mM, respectively.
Fig. 7.
Fig. 7.
KDM5A/B are required for replication stress tolerance through regulation of RRM2. (A) H50 cells grown either in the absence (−HU) or presence of 0.5 mM HU (+HU) were transfected with the indicated siRNA twice in a 48 h interval, and viable cells, excluding Trypan Blue, were counted 96 h after the first transfection. Viability was calculated relative to 100 for si Ctl cells without HU. mean±s.e.m., n=3, *P<0.05, ns, non-significant (paired t-test). For panels B to I, H50 cells were grown in 0.5 mM HU. (B) Viability of H50 cells grown in 0.5 mM HU upon transfection of the indicated siRNA as described in A, following normalization to 100 for siCtl treated cells. mean±s.e.m, n=3. * P<0.05 (paired t-test). (C) Relative mRNA expression levels of KDM5A, KDM5B, and RRM2, upon transfection of the indicated siRNA in H50 cells. Expression levels were normalized to the reference gene P0 and calculated relative to 1 for the siCtl. mean±s.d., n=3. *P<0.05 (paired t-test). (D) Western blot analysis of KDM5A, KDM5B, RRM2 and GAPDH as a loading control from H50 cells transfected with the indicated siRNA. Quantification is shown in the right panel with RRM2/GAPDH set to 1 for siCtl. mean±s.e.m., n=3. * P<0.05 (paired t-test). (E) H50 cells were transfected by the indicated siRNA, and re-transfected 24 h later with the indicated expression vector coding for wild-type KDM5A (pKDM5AWT) or a histone demethylase-defective mutant (pKDM5AMUT). 24 h following plasmids transfection, cells were transfected once more with siRNA. Cells were harvested and counted 24 h after this second siRNA transfection. Bar-plot following normalization to 100 for siCtl+pcDNA3 transfected cells. mean±s.e.m., n=3. *P<0.05 (paired t-test). (F) Western blot analysis of H3K4me3 and histone H3 from H50 cells treated each 24 h with 12.5 µM KDM5 inhibitor CPI-455 (+) or DMSO (−) for 48 h. A quantification of H3K4me3/H3 is shown on the right with DMSO treated cells set to 1. mean±s.e.m., n=3 *P<0.05 (paired t-test). (G) Relative mRNA expression levels of KDM5A, KDM5B and RRM2 in H50 cells treated with CPI-455 (+) or DMSO (−) as in F. Expression levels were normalized to the reference gene P0 and calculated relative to 1 for the siCtl sample. mean±s.d., n=3. *P<0.05 (paired t-test). (H) Western blot analysis of KDM5A, KDM5B, RRM2 and GAPDH from H50 cells treated with CPI-455 (+) or DMSO (−) as in F. Quantification is shown on the right with DMSO treated cells set to 1. mean±s.e.m., n=3. *P<0.05 (paired t-test). (I) Percentage of living cells following treatment of H50 cells each 24 h with 12.5 µM CPI-455 for 72 h (+) or DMSO (−) following normalization to 100 for DMSO-treated cells. mean±s.e.m., n=3. (J) H50 cells were treated with the indicated siRNA (d0) and 24 h (d1) later transfected with pcDNA3-RRM2 (pRRM2) (+) or the empty vector (−). A second siRNA transfection was performed at 48 h (d2) and cells were collected 24 h later (d3). Expression of KDM5A, KDM5B, RRM2 and GAPDH were analysed by western blot (left panel). Note the appearance of a band corresponding to the exogenous tagged RRM2 indicated by a star. Viability was estimated by counting (right panel). siCtl/pcDNA3 transfected cells were set to 100. mean±s.e.m., n=4, * P<0.05 (paired t-test).

References

    1. Aye, Y., Li, M., Long, M. J. C. and Weiss, R. S. (2015). Ribonucleotide reductase and cancer: biological mechanisms and targeted therapies. Oncogene 34, 2011-2021. 10.1038/onc.2014.155 - DOI - PubMed
    1. Bayo, J., Tran, T. A., Wang, L., Peña-Llopis, S., Das, A. K. and Martinez, E. D. (2018). Jumonji inhibitors overcome radioresistance in cancer through changes in H3K4 methylation at double-strand breaks. Cell Rep. 25, 1040-1050.e5. 10.1016/j.celrep.2018.09.081 - DOI - PMC - PubMed
    1. Beshiri, M. L., Islam, A., DeWaal, D. C., Richter, W. F., Love, J., Lopez-Bigas, N. and Benevolenskaya, E. V. (2010). Genome-wide analysis using ChIP to identify isoform-specific gene targets. J. Vis. Exp. 41, 2101. 10.3791/2101 - DOI - PMC - PubMed
    1. Beshiri, M. L., Holmes, K. B., Richter, W. F., Hess, S., Islam, A. B. M. M. K., Yan, Q., Plante, L., Litovchick, L., Gévry, N., Lopez-Bigas, N.et al. (2012). Coordinated repression of cell cycle genes by KDM5A and E2F4 during differentiation. Proc. Natl. Acad. Sci. USA 109, 18499-18504. 10.1073/pnas.1216724109 - DOI - PMC - PubMed
    1. Blair, L. P., Cao, J., Zou, M. R., Sayegh, J. and Yan, Q. (2011). Epigenetic regulation by lysine demethylase 5 (KDM5) enzymes in cancer. Cancers 3, 1383-1404. 10.3390/cancers3011383 - DOI - PMC - PubMed

Publication types

MeSH terms