

Methods for the Analysis of 26 Million VOC Area Measurements during the Deepwater Horizon Oil Spill Clean-up
- PMID: 34184747
- PMCID: PMC8989035
- DOI: 10.1093/annweh/wxab038
Methods for the Analysis of 26 Million VOC Area Measurements during the Deepwater Horizon Oil Spill Clean-up
Erratum in
-
Correction to: The 2010 Deepwater Horizon Oil Spill: Exposure Assessment of Response and Clean-up Workers.Ann Work Expo Health. 2022 Apr 7;66(Supplement_1):i247-i249. doi: 10.1093/annweh/wxac018. Ann Work Expo Health. 2022. PMID: 35390132 Free PMC article. No abstract available.
Abstract
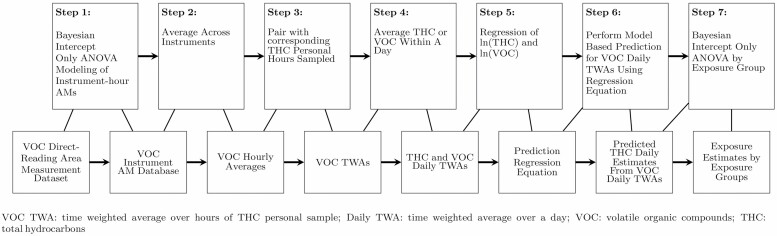
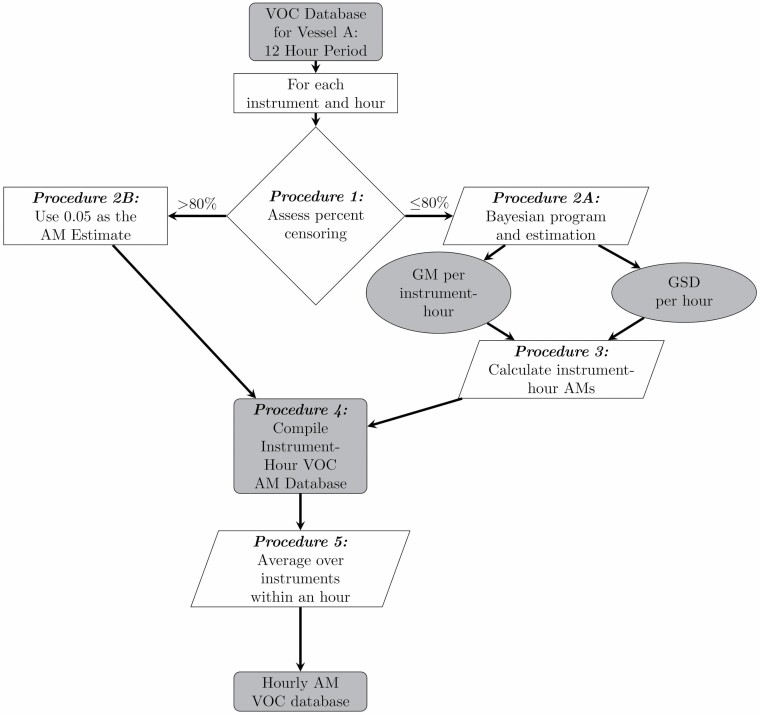
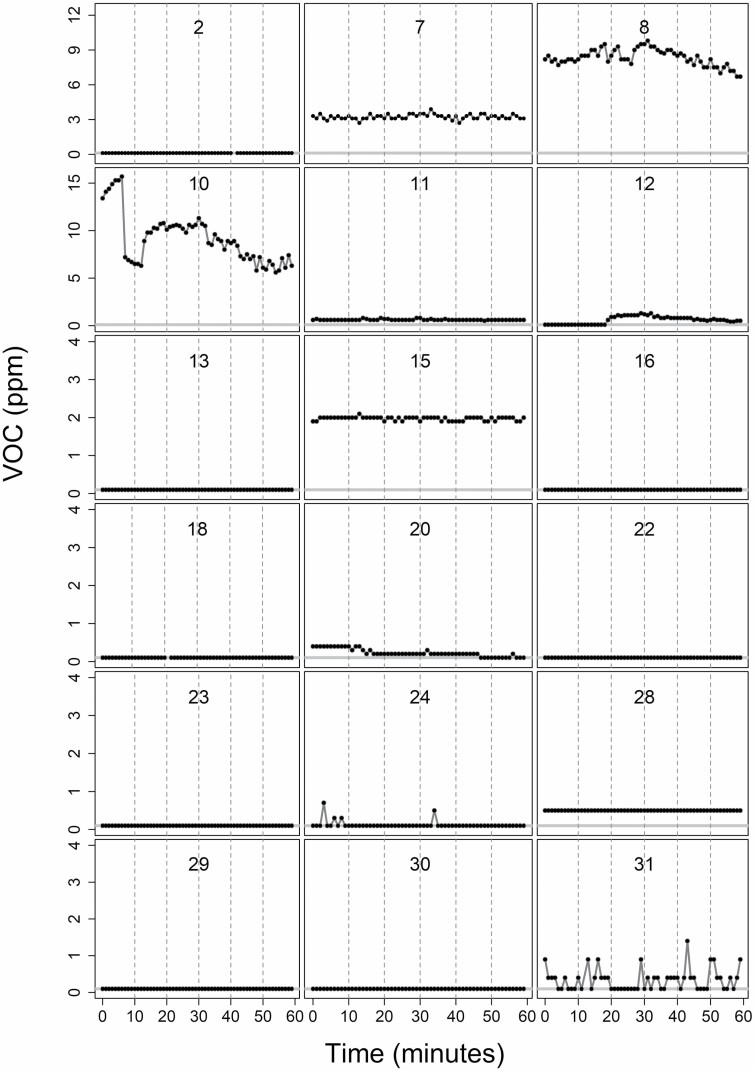
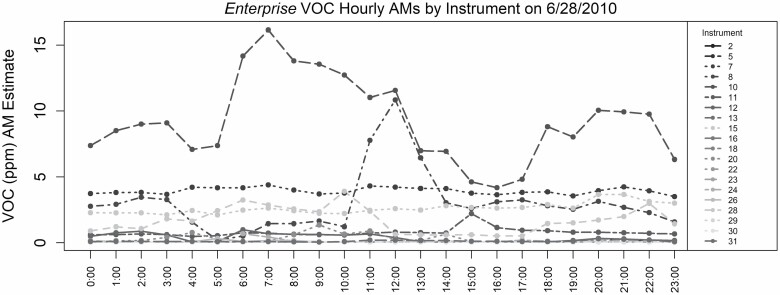
The NIEHS GuLF STUDY is an epidemiologic study of the health of workers who participated in the 2010 Deepwater Horizon oil spill response and clean-up effort. Even with a large database of approximately 28 000 personal samples that were analyzed for total hydrocarbons (THCs) and other oil-related chemicals, resulting in nearly 160 000 full-shift personal measurements, there were still exposure scenarios where the number of measurements was too limited to rigorously assess exposures. Also available were over 26 million volatile organic compounds (VOCs) area air measurements of approximately 1-min duration, collected from direct-reading instruments on 38 large vessels generally located near the leaking well. This paper presents a strategy for converting the VOC database into hourly average air concentrations by vessel as the first step of a larger process designed to use these data to supplement full-shift THC personal exposure measurements. We applied a Bayesian method to account for measurements with values below the analytic instrument's limit of detection while processing the large database into average instrument-hour concentrations and then hourly concentrations across instruments on each day of measurement on each of the vessels. To illustrate this process, we present results on the drilling rig ship, the Discoverer Enterprise. The methods reduced the 26 million measurements to 21 900 hourly averages, which later contributed to the development of additional full-shift THC observations. The approach used here can be applied by occupational health professionals with large datasets of direct-reading instruments to better understand workplace exposures.
Keywords: Deepwater Horizon oil spill; direct-reading instruments; high volume data; volatile organic compounds.
© The Author(s) 2021. Published by Oxford University Press on behalf of the British Occupational Hygiene Society.
Figures
References
-
- BP Gulf Science Data. 2016. Monitoring of the Personal Breathing Zone of Response workers for chemicals and oil mists from April 2010 to January 2012. Distributed by: Gulf of Mexico Research Initiative Information and Data Cooperative (GRIIDC), Harte Research Institute, Texas A&M University–Corpus Christi. BP Science, SRN-2001.1-WorkPlan.pdf. Data. doi: 10.7266/N71G0JQK UDI: BP.x750.000:0007 - DOI
-
- Gelman A, Carlin B, Stern HSet al. (2013) Bayesian data analysis. 3rd edn. Boca Raton, FL: CRC Press. ISBN 1439840954.