. 2021 Oct 1;42(14):4597-4610.
doi: 10.1002/hbm.25569. Epub 2021 Jun 29.

R2* and quantitative susceptibility mapping in deep gray matter of 498 healthy controls from 5 to 90 years

Affiliations

R2* and quantitative susceptibility mapping in deep gray matter of 498 healthy controls from 5 to 90 years

Sarah Treit et al. Hum Brain Mapp. .

Abstract

Putative MRI markers of iron in deep gray matter have demonstrated age related changes during discrete periods of healthy childhood or adulthood, but few studies have included subjects across the lifespan. This study reports both transverse relaxation rate (R2*) and quantitative susceptibility mapping (QSM) of four primary deep gray matter regions (thalamus, putamen, caudate, and globus pallidus) in 498 healthy individuals aged 5-90 years. In the caudate, putamen, and globus pallidus, increases of QSM and R2* were steepest during childhood continuing gradually throughout adulthood, except caudate susceptibility which reached a plateau in the late 30s. The thalamus had a unique profile with steeper changes of R2* (reflecting additive effects of myelin and iron) than QSM during childhood, both reaching a plateau in the mid-30s to early 40s and decreasing thereafter. There were no hemispheric or sex differences for any region. Notably, both R2* and QSM values showed more inter-subject variability with increasing age from 5 to 90 years, potentially reflecting a common starting point in iron/myelination during childhood that diverges as a result of lifestyle and genetic factors that accumulate with age.

Keywords: R2*; aging; brain iron; deep gray matter; development; lifespan; susceptibility.


Figures

FIGURE 1
FIGURE 1
Best‐fit curves across 5–90 year lifespan in 286 females and 212 males for (a) volume, (b) R2*, and (c) QSM of the thalamus, putamen, caudate and globus pallidus, separated by sex (different shade of each color) and hemisphere (solid vs. dashed lines). Volume decreased with age in all four structures, while R2* and QSM followed either quadratic or cubic curves that increased across the lifespan for all structures except the thalamus, which increased, reached a peak and then declined. R2* and QSM were highest in the globus pallidus across all ages. R2* and QSM in the other three structures were similar to each other at the youngest ages, but progressively deviated with increasing age, particularly after 45–50 years. Curves within each structure were remarkably similar between males and females as well as between the left and right hemispheres
FIGURE 2
FIGURE 2
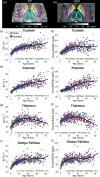
Raw data (left and right hemispheres averaged; males and females colored separately) and best fit curves for R2* and QSM of the caudate, putamen, thalamus, and globus pallidus. VolBrain ROIs of the caudate (yellow), putamen (pink), globus pallidus (green), and thalamus (teal) are overlaid on (a) R2* and (b) QSM of a 53 year old female. (c–j) R2* and QSM showed robust nonlinear changes with age with large overlap between males and females. Both R2* and susceptibility of the putamen and globus pallidus increased over the lifespan, following similar trajectories. For the caudate, R2* increased across the lifespan while susceptibility increased until mid‐adulthood and plateaued thereafter, increasing very little for the remainder of the lifespan. The thalamus was the only structure shown to increase in childhood, reach a peak in adulthood and decline thereafter for both measures
FIGURE 3
FIGURE 3
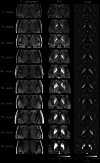
Examples of T1‐weighted MPRAGE, R2*, and QSM susceptibility maps from one subject per decade across the lifespan. T1 contrast is similar across subjects while both R2* and QSM change visibly within the first two decades continuing until the 90s. Although R2* changes visibly across the lifespan, QSM appears to provide more contrast between structures (e.g., putamen vs. globus pallidus, which are less distinguishable on R2* by 90 years of age), as well as heterogeneity within structures, for example, the pulvinar of the thalamus (posterior bright region on QSM)
FIGURE 4
FIGURE 4
(a) Susceptibility maps from childhood to early adulthood for example subjects ranging from 5 to 25 years old, along with plots for (b) globus pallidus and (c) thalamus with example subjects from (a) identified by colored dots. In the globus pallidus, susceptibility increased rapidly within the 5–10 years range, evident both visually in the first four subjects as well as in the plots. In addition, there appears to be an anterior‐to‐posterior gradient with the anterior portion increasing first as only appreciated by examining the maps. Conversely, susceptibility in the thalamus increased slowly over 5–25 years, with much less visible change overall. However, the pulvinar (posterior nucleus of the thalamus) susceptibility is shown to increase substantially between 20 and 25 years on the actual susceptibility maps which indicates regional heterogeneity that is not appreciated by whole structure measurements
FIGURE 5
FIGURE 5
Susceptibility maps from 10 females aged 68–90 years, showing substantially elevated values in the globus pallidus relative to the other three deep gray matter regions, as well as the in the pulvinar relative to the rest of the thalamus. However, in these older females there is also marked inter‐subject variability in both structures (e.g., globus pallidus susceptibility much higher in the 75 year old versus 76 year old, pulvinar not visible in the 75 year old; barely visible in the first 81 year old or 85 year old, yet very clear in most other subjects). In addition, the ability to visually distinguish the caudate from the putamen appears to be lost around approximately 80 years of age
FIGURE 6
FIGURE 6
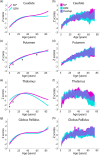
R2* and QSM values converted to Z scores to permit comparison on the same scale. The left column (a,c,e,g) show curve fits for structure, with arrows indicating statistically significant differences in parameter values between R2* and QSM. The right column (b,d,f,h) show ±1SD of the moving average of each measure (average of 20 consecutive subjects, window shifted every 1 subject). R2* and QSM curves overlaped substantially, with a few notable exceptions (e.g., the thalamus). Moving average curves provide additional visualization of the overlap between R2* and QSM curves (overlap shown in purple), while also highlighting places where the curves differ, for example, youngest ages in the putamen. Furthermore, in all structures the SD of both Z scores increased with age, particularly for the caudate, putamen, and globus pallidus

Similar articles

Cited by

References

    1. Abdul‐Rahman, H. S., Gdeisat, M. A., Burton, D. R., Lalor, M. J., Lilley, F., & Moore, C. J. (2007). Fast and robust three‐dimensional best path phase unwrapping algorithm. Applied Optics, 46, 6623–6635. - PubMed
    1. Acosta‐Cabronero, J., Betts, M. J., Cardenas‐Blanco, A., Yang, S., & Nestor, P. J. (2016). In vivo MRI mapping of brain iron deposition across the adult lifespan. The Journal of Neuroscience: The Official Journal of the Society for Neuroscience, 36, 364–374. - PMC - PubMed
    1. Aquino, D., Bizzi, A., Grisoli, M., Garavaglia, B., Bruzzone, M. G., Nardocci, N., … Chiapparini, L. (2009). Age‐related iron deposition in the basal ganglia: Quantitative analysis in healthy subjects. Radiology, 252, 165–172. - PubMed
    1. Avants, B. B., Tustison, N. J., Song, G., Cook, P. A., Klein, A., & Gee, J. C. (2011). A reproducible evaluation of ANTs similarity metric performance in brain image registration. NeuroImage, 54, 2033–2044. - PMC - PubMed
    1. Beard, J. (2003). Iron deficiency alters brain development and functioning. Journal of Nutrition, 133, 1468s–1472s. - PubMed

Publication types

MeSH terms

Grants and funding