

Intermittent Hypoxia and Hypercapnia Alter Diurnal Rhythms of Luminal Gut Microbiome and Metabolome
- PMID: 34184915
- PMCID: PMC8269208
- DOI: 10.1128/mSystems.00116-21
Intermittent Hypoxia and Hypercapnia Alter Diurnal Rhythms of Luminal Gut Microbiome and Metabolome
Abstract
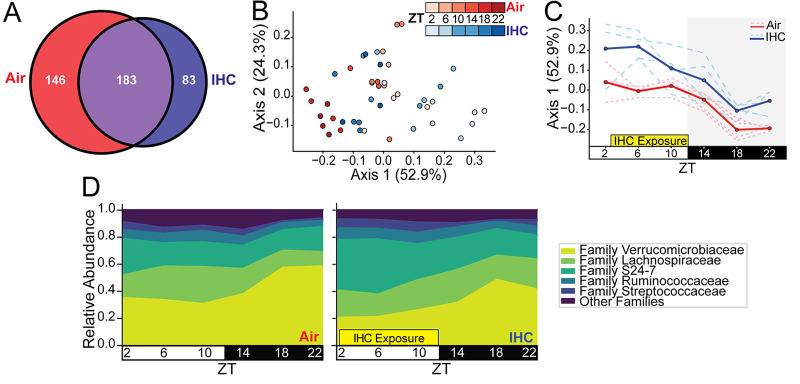
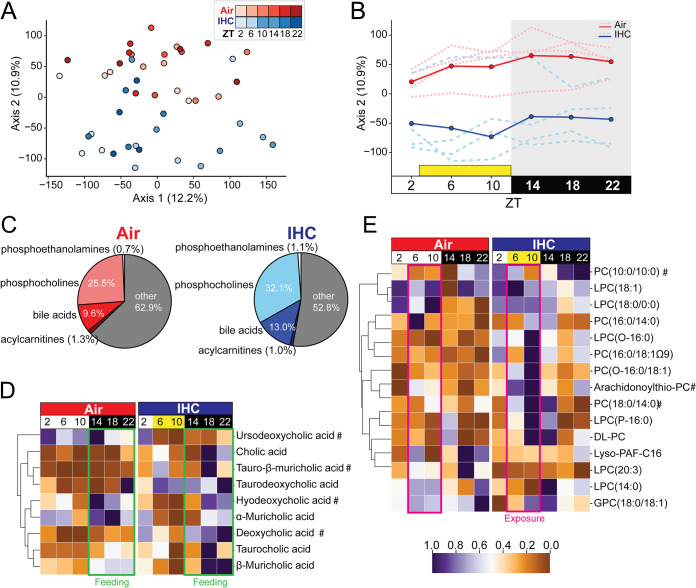
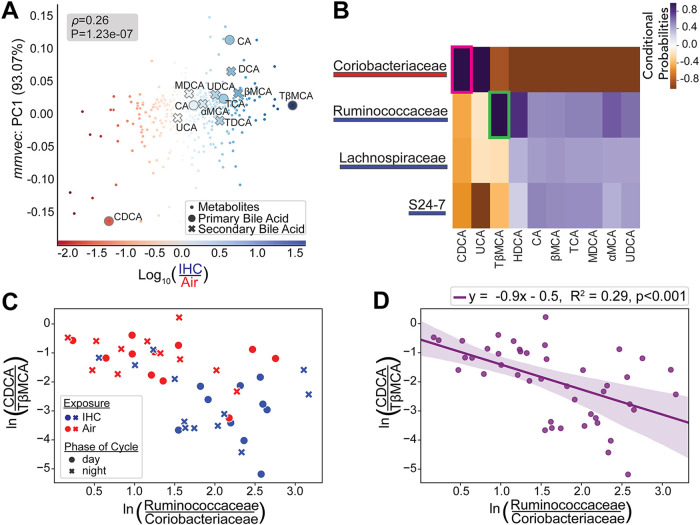
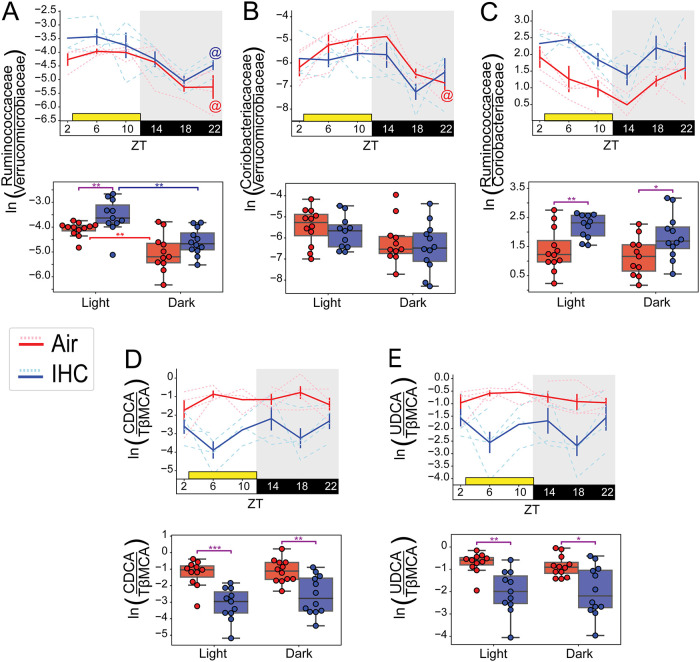
Obstructive sleep apnea (OSA), characterized by intermittent hypoxia and hypercapnia (IHC), affects the composition of the gut microbiome and metabolome. The gut microbiome has diurnal oscillations that play a crucial role in regulating circadian and overall metabolic homeostasis. Thus, we hypothesized that IHC adversely alters the gut luminal dynamics of key microbial families and metabolites. The objective of this study was to determine the diurnal dynamics of the fecal microbiome and metabolome of Apoe-/- mice after a week of IHC exposure. Individually housed, 10-week-old Apoe-/- mice on an atherogenic diet were split into two groups. One group was exposed to daily IHC conditions for 10 h (Zeitgeber time 2 [ZT2] to ZT12), while the other was maintained in room air. Six days after the initiation of the IHC conditions, fecal samples were collected every 4 h for 24 h (6 time points). We performed 16S rRNA gene amplicon sequencing and untargeted liquid chromatography-mass spectrometry (LC-MS) to assess changes in the microbiome and metabolome. IHC induced global changes in the cyclical dynamics of the gut microbiome and metabolome. Ruminococcaceae, Lachnospiraceae, S24-7, and Verrucomicrobiaceae had the greatest shifts in their diurnal oscillations. In the metabolome, bile acids, glycerolipids (phosphocholines and phosphoethanolamines), and acylcarnitines were greatly affected. Multi-omic analysis of these results demonstrated that Ruminococcaceae and tauro-β-muricholic acid (TβMCA) cooccur and are associated with IHC conditions and that Coriobacteriaceae and chenodeoxycholic acid (CDCA) cooccur and are associated with control conditions. IHC significantly change the diurnal dynamics of the fecal microbiome and metabolome, increasing members and metabolites that are proinflammatory and proatherogenic while decreasing protective ones. IMPORTANCE People with obstructive sleep apnea are at a higher risk of high blood pressure, type 2 diabetes, cardiac arrhythmias, stroke, and sudden cardiac death. We wanted to understand whether the gut microbiome changes induced by obstructive sleep apnea could potentially explain some of these medical problems. By collecting stool from a mouse model of this disease at multiple time points during the day, we studied how obstructive sleep apnea changed the day-night patterns of microbes and metabolites of the gut. Since the oscillations of the gut microbiome play a crucial role in regulating metabolism, changes in these oscillations can explain why these patients can develop so many metabolic problems. We found changes in microbial families and metabolites that regulate many metabolic pathways contributing to the increased risk for heart disease seen in patients with obstructive sleep apnea.
Keywords: animal models of human disease; atherosclerosis; circadian rhythm; computational biology; metabolome; microbiome.
Figures
References
-
- Mozaffarian D, Benjamin EJ, Go AS, Arnett DK, Blaha MJ, Cushman M, de Ferranti S, Després J-P, Fullerton HJ, Howard VJ, Huffman MD, Judd SE, Kissela BM, Lackland DT, Lichtman JH, Lisabeth LD, Liu S, Mackey RH, Matchar DB, McGuire DK, Mohler ER, III, Moy CS, Muntner P, Mussolino ME, Nasir K, Neumar RW, Nichol G, Palaniappan L, Pandey DK, Reeves MJ, Rodriguez CJ, Sorlie PD, Stein J, Towfighi A, Turan TN, Virani SS, Willey JZ, Woo D, Yeh RW, Turner MB, American Heart Association Statistics Committee and Stroke Statistics Subcommittee. 2015. Heart disease and stroke statistics—2015 update: a report from the American Heart Association. Circulation 131:e29–e332. doi:10.1161/CIR.0000000000000152. - DOI - PubMed
-
- Lemmer B, Scholtze J, Schmitt J. 2016. Circadian rhythms in blood pressure, heart rate, hormones, and on polysomnographic parameters in severe obstructive sleep apnea syndrome patients: effect of continuous positive airway pressure. Blood Press Monit 21:136–143. doi:10.1097/MBP.0000000000000173. - DOI - PubMed
Grants and funding
- R01 HL146530/HL/NHLBI NIH HHS/United States
- R01 HL148801/HL/NHLBI NIH HHS/United States
- T32 HL134632/HL/NHLBI NIH HHS/United States
- UL1 TR001442/TR/NCATS NIH HHS/United States
- R01 HL142114/HL/NHLBI NIH HHS/United States
- R21 NS111270/NS/NINDS NIH HHS/United States
- P30 DK063491/DK/NIDDK NIH HHS/United States
- R21 MH117780/MH/NIMH NIH HHS/United States
- T32 OD017863/OD/NIH HHS/United States
- R01 AG063925/AG/NIA NIH HHS/United States
- K08 DK102902/DK/NIDDK NIH HHS/United States
- P30 DK120515/DK/NIDDK NIH HHS/United States
- K24 HL132105/HL/NHLBI NIH HHS/United States
- R01 HL085188/HL/NHLBI NIH HHS/United States
- R01 HL157445/HL/NHLBI NIH HHS/United States
- R03 DK114536/DK/NIDDK NIH HHS/United States
- R01 HL148436/HL/NHLBI NIH HHS/United States
- OD017863/HHS | National Institutes of Health (NIH)
- DK102902/HHS | National Institutes of Health (NIH)
- HL146530/HHS | National Institutes of Health (NIH)
- DK120515/HHS | National Institutes of Health (NIH)
- HL085188/HHS | National Institutes of Health (NIH)
- HL148801-02S1/HHS | National Institutes of Health (NIH)
LinkOut - more resources
Full Text Sources
Molecular Biology Databases
Miscellaneous
