Observational Study
. 2021 Oct;301(1):E361-E370.
doi: 10.1148/radiol.2021210384. Epub 2021 Jun 29.

Study of Thoracic CT in COVID-19: The STOIC Project

Affiliations
Observational Study

Study of Thoracic CT in COVID-19: The STOIC Project

Marie-Pierre Revel et al. Radiology. 2021 Oct.

Abstract

Background There are conflicting data regarding the diagnostic performance of chest CT for COVID-19 pneumonia. Disease extent at CT has been reported to influence prognosis. Purpose To create a large publicly available data set and assess the diagnostic and prognostic value of CT in COVID-19 pneumonia. Materials and Methods This multicenter, observational, retrospective cohort study involved 20 French university hospitals. Eligible patients presented at the emergency departments of the hospitals involved between March 1 and April 30th, 2020, and underwent both thoracic CT and reverse transcription-polymerase chain reaction (RT-PCR) testing for suspected COVID-19 pneumonia. CT images were read blinded to initial reports, RT-PCR, demographic characteristics, clinical symptoms, and outcome. Readers classified CT scans as either positive or negative for COVID-19 based on criteria published by the French Society of Radiology. Multivariable logistic regression was used to develop a model predicting severe outcome (intubation or death) at 1-month follow-up in patients positive for both RT-PCR and CT, using clinical and radiologic features. Results Among 10 930 patients screened for eligibility, 10 735 (median age, 65 years; interquartile range, 51-77 years; 6147 men) were included and 6448 (60%) had a positive RT-PCR result. With RT-PCR as reference, the sensitivity and specificity of CT were 80.2% (95% CI: 79.3, 81.2) and 79.7% (95% CI: 78.5, 80.9), respectively, with strong agreement between junior and senior radiologists (Gwet AC1 coefficient, 0.79). Of all the variables analyzed, the extent of pneumonia at CT (odds ratio, 3.25; 95% CI: 2.71, 3.89) was the best predictor of severe outcome at 1 month. A score based solely on clinical variables predicted a severe outcome with an area under the curve of 0.64 (95% CI: 0.62, 0.66), improving to 0.69 (95% CI: 0.6, 0.71) when it also included the extent of pneumonia and coronary calcium score at CT. Conclusion Using predefined criteria, CT reading is not influenced by reader's experience and helps predict the outcome at 1 month. ClinicalTrials.gov identifier: NCT04355507 Published under a CC BY 4.0 license. Online supplemental material is available for this article. See also the editorial by Rubin in this issue.


Figures
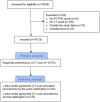
Flow chart of the study sample. RT-PCR: Reverse Transcription–Polymerase Chain Reaction.
Figure 1:
Flow chart of the study sample. RT-PCR: Reverse Transcription–Polymerase Chain Reaction.
CT annotations: Classification as COVID+, COVID- or Normal CT. The readers had access to the CT scans using a 3D image visualization web application, allowing scrolling through the entire lung volume in the coronal, sagittal, or axial transverse plane. The CT scan shown here has been classified as COVID+, due to the presence of bilateral ground glass opacities and absence of features such as mucoid impaction, bronchiolar nodules, segmental or lobar consolidation.
Figure 2:
CT annotations: Classification as COVID+, COVID- or Normal CT. The readers had access to the CT scans using a 3D image visualization web application, allowing scrolling through the entire lung volume in the coronal, sagittal, or axial transverse plane. The CT scan shown here has been classified as COVID+, due to the presence of bilateral ground glass opacities and absence of features such as mucoid impaction, bronchiolar nodules, segmental or lobar consolidation.
CT annotations: Visual quantification of lung disease extent. The readers had to visually quantify the extent of COVID-19 pneumonia on a 5-point scale. Here, it is estimated to be more than 50% and less than 75% (50-75%). Readers were also asked to manually contour COVID-19 pneumonia (area in blue in the right lung) on at least 2 CT images to later train deep learning algorithms for automated quantification of disease extent.
Figure 3:
CT annotations: Visual quantification of lung disease extent. The readers had to visually quantify the extent of COVID-19 pneumonia on a 5-point scale. Here, it is estimated to be more than 50% and less than 75% (50-75%). Readers were also asked to manually contour COVID-19 pneumonia (area in blue in the right lung) on at least 2 CT images to later train deep learning algorithms for automated quantification of disease extent.
CT annotations: Visual scoring of coronary artery calcifications. The coronary artery calcium score was evaluated according to the method by Shemesh et al. (13). Calcification in each of the four main coronary arteries (LM:left main, LAD:left anterior descending, LCX:circumflex, and RCA:right) was categorized as none, mild, moderate, or severe. Calcification was classified as mild when less than one-third of the length of the entire artery showed calcification, moderate when one-third to two-thirds of the artery showed calcification and severe when more than two-thirds of the artery showed calcification.
Figure 4:
CT annotations: Visual scoring of coronary artery calcifications. The coronary artery calcium score was evaluated according to the method by Shemesh et al. (13). Calcification in each of the four main coronary arteries (LM:left main, LAD:left anterior descending, LCX:circumflex, and RCA:right) was categorized as none, mild, moderate, or severe. Calcification was classified as mild when less than one-third of the length of the entire artery showed calcification, moderate when one-third to two-thirds of the artery showed calcification and severe when more than two-thirds of the artery showed calcification.
CT annotations: Measurement of chest wall fat. The amount of fat in the chest wall was measured as shown here, in front of the sternum, on a mid-sagittal reformation of noncontrast CT. Here it is clearly increased in an obese 57-year-old man. This annotation served as a substitute for BMI.
Figure 5:
CT annotations: Measurement of chest wall fat. The amount of fat in the chest wall was measured as shown here, in front of the sternum, on a mid-sagittal reformation of noncontrast CT. Here it is clearly increased in an obese 57-year-old man. This annotation served as a substitute for BMI.
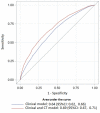
Performance of the clinical and mixed (clinical and CT) models. The prediction model that included clinical features alone achieved an AUC of 0.64 while the use of both clinical features and CT improved discrimination between subjects with and without severe outcomes at 1- month follow-up (AUC: 0.69).
Figure 6:
Performance of the clinical and mixed (clinical and CT) models. The prediction model that included clinical features alone achieved an AUC of 0.64 while the use of both clinical features and CT improved discrimination between subjects with and without severe outcomes at 1- month follow-up (AUC: 0.69).
Performance of the mixed clinical and CT model with and without taking into account significant interactions. Taking into account interactions did not improve the performance of the model (AUC: 0.69).
Figure E1:
Performance of the mixed clinical and CT model with and without taking into account significant interactions. Taking into account interactions did not improve the performance of the model (AUC: 0.69).
Summary of the simplified risk score.
Figure E2:
Summary of the simplified risk score.

Comment in

References

    1. Hoffmann M, Kleine-Weber H, Schroeder S, et al. . SARS-CoV-2 Cell Entry Depends on ACE2 and TMPRSS2 and Is Blocked by a Clinically Proven Protease Inhibitor. Cell. 2020;181(2):271–280.e8. 10.1016/j.cell.2020.02.052. - DOI - PMC - PubMed
    1. Schiaffino S, Tritella S, Cozzi A, et al. . Diagnostic Performance of Chest X-Ray for COVID-19 Pneumonia During the SARS-CoV-2 Pandemic in Lombardy, Italy. J Thorac Imaging. 2020;35(4):W105–W106. 10.1097/RTI.0000000000000533. - DOI - PubMed
    1. Revel M-P, Parkar AP, Prosch H, et al. . COVID-19 patients and the radiology department - advice from the European Society of Radiology (ESR) and the European Society of Thoracic Imaging (ESTI). Eur Radiol. 2020;30(9):4–4909. 10.1007/s00330-020-06865-y. - DOI - PMC - PubMed
    1. Ai T, Yang Z, Hou H, et al. . Correlation of Chest CT and RT-PCR Testing for Coronavirus Disease 2019 (COVID-19) in China: A Report of 1014 Cases. Radiology. 2020;296(2):E32–E40. 10.1148/radiol.2020200642. - DOI - PMC - PubMed
    1. ACR Recommendations for the use of Chest Radiography and Computed Tomography (CT) for Suspected COVID-19 Infection. American College of Radiology. https://www.acr.org/Advocacy-and-Economics/ACR-Position-Statements/Recom.... Accessed January 7, 2021.

Publication types

Associated data