. 2021 Aug 3;13(8):evab152.
doi: 10.1093/gbe/evab152.

Evolution of Recombination Landscapes in Diverging Populations of Bread Wheat

Affiliations

Evolution of Recombination Landscapes in Diverging Populations of Bread Wheat

Alice Danguy des Déserts et al. Genome Biol Evol. .

Abstract

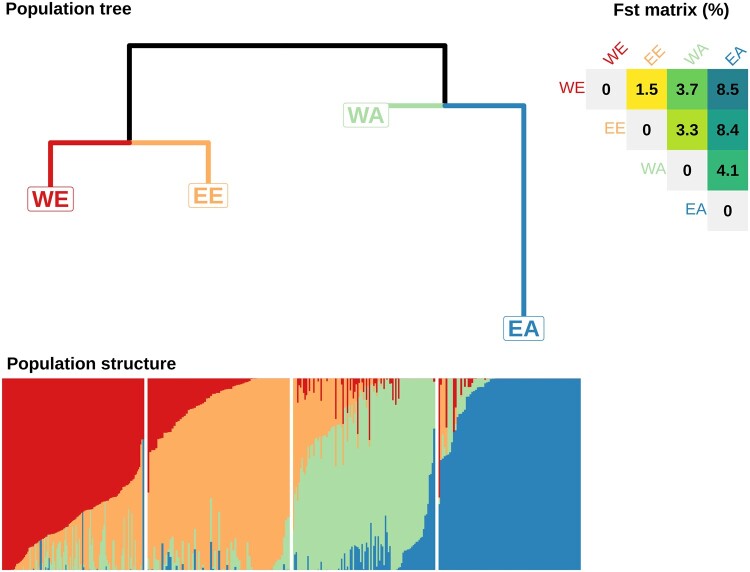
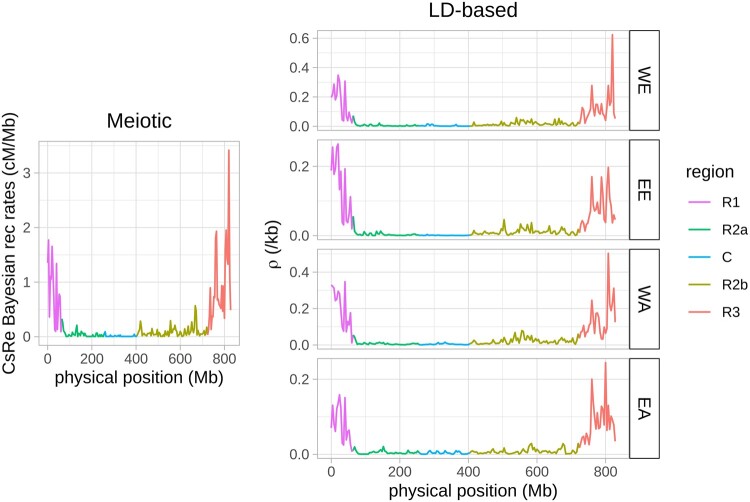
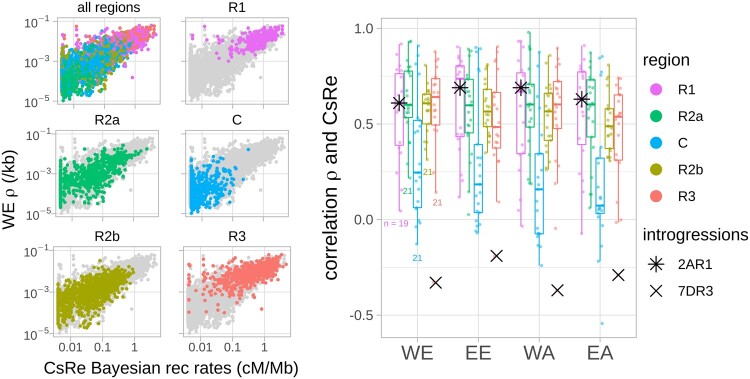
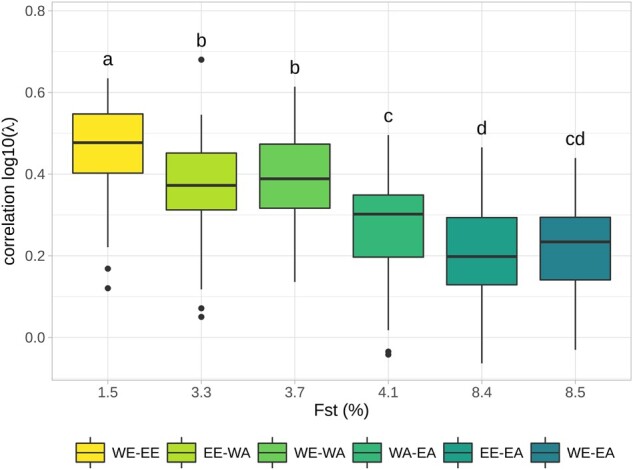
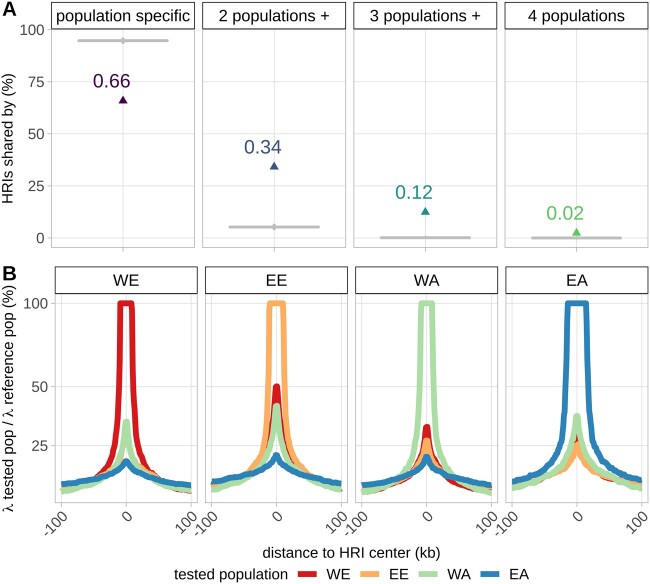
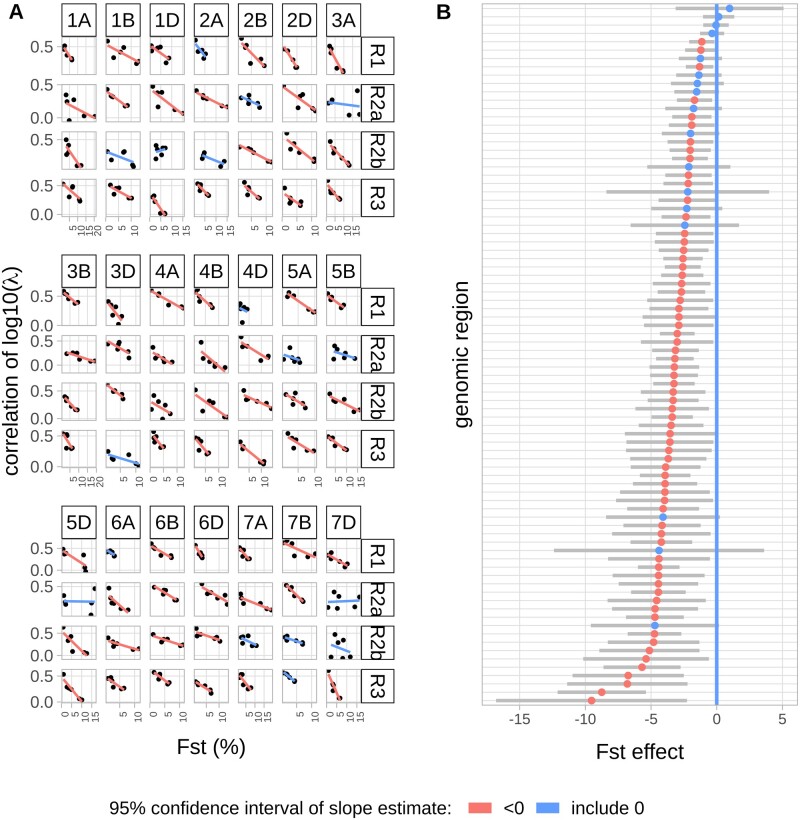
Reciprocal exchanges of DNA (crossovers) that occur during meiosis are mandatory to ensure the production of fertile gametes in sexually reproducing species. They also contribute to shuffle parental alleles into new combinations thereby fueling genetic variation and evolution. However, due to biological constraints, the recombination landscape is highly heterogeneous along the genome which limits the range of allelic combinations and the adaptability of populations. An approach to better understand the constraints on the recombination process is to study how it evolved in the past. In this work, we tackled this question by constructing recombination profiles in four diverging bread wheat (Triticum aestivum L.) populations established from 371 landraces genotyped at 200,062 SNPs. We used linkage disequilibrium (LD) patterns to estimate in each population the past distribution of recombination along the genome and characterize its fine-scale heterogeneity. At the megabase scale, recombination rates derived from LD patterns were consistent with family-based estimates obtained from a population of 406 recombinant inbred lines. Among the four populations, recombination landscapes were positively correlated between each other and shared a statistically significant proportion of highly recombinant intervals. However, this comparison also highlighted that the similarity in recombination landscapes between populations was significantly decreasing with their genetic differentiation in most regions of the genome. This observation was found to be robust to SNPs ascertainment and demography and suggests a relatively rapid evolution of factors determining the fine-scale localization of recombination in bread wheat.

Keywords: bread wheat; evolution; recombination.


Figures

Fig. 1.
Fig. 1.
Bread wheat landrace genetic divergence and structuration. Population tree: Neighbor Joining tree built with pairwise Reynold distance matrix computed on SNP alleles and rooted by HAPFLK software (Bonhomme et al. 2010; Fariello et al. 2013). WE, West Europe; EE, East Europe; WA, West Asia; EA, East Asia. Fst matrix (%) Weir and Cockerham pairwise FST computed with simple matching distance of haplotypic alleles. Population structure: Admixture coefficients for K = 4 from Balfourier et al. (2019) using STRUCTURE software and haplotypic alleles.
Fig. 2.
Fig. 2.
Meiotic and LD-based recombination profiles in 4 Mb windows along chromosome 3B in the CsRe segregating population (left) and in the four West European (WE), East European (EE), West Asian (WA), and East Asian (EA) populations (right). Each color corresponds to genomic regions defined by Choulet et al. (2014): highly recombining telomeres R1 (magenta) and R3 (red); low recombining pericentromeres R2a (dark green) and R2b (light green); and centromere C (blue) where recombination rates are close to 0. LD-based recombination profiles at log10 scale are present in supplementary figure S4, Supplementary Material online.
Fig. 3.
Fig. 3.
Similarity between LD-based recombination rates and CsRe meiotic recombination rates. Left: Genome-wide relationship between the CsRe biparental population meiotic recombination rates and the LD-based recombination profile of a Western European (WE) bread wheat population. Dots represent the recombination rates averaged within 4 Mb windows. Graphs R1, R2a, C, R2b, and R3 gather recombination rates within the five chromosomic regions defined by Choulet et al. (2014) (R1 and R3 are telomeric regions, R2a and R2b are pericentromeric regions, and C are centromeric regions) of all of the 21 chromosomes (1A, 1B, 1D … 7A, 7B, 7D) of bread wheat. Right: Correlation of LD-based and CsRe recombination rates for each landrace population within each genomic region (1AR1…7DR3). Dots represent correlation coefficients of recombination profiles (once averaged within 4 Mb windows) per genomic region and population. Small colored numbers indicate the number of correlation coefficients per boxplot. In principle, each boxplot should contain 21 dots (as many as chromosomes). However, two R1 genomic regions smaller than 20 Mb are not included (4DR1 and 7BR1), because of low robustness of their correlation coefficients (computed on less than five data points). Stars (* and x) represent genomic regions including well documented introgressions in CsRe population.
Fig. 4.
Fig. 4.
Relationship between pairwise correlation of LD-based recombination intensity λ and FST. Each boxplot contains 84 correlation coefficients corresponding to the 84 genomic regions (1AR1…7DR3, excluding centromeres). Letters indicate whether two pairs have significant different average correlations (Bonferroni corrected P-value < 0.05).
Fig. 5.
Fig. 5.
Conservation of highly recombining intervals (HRIs) across landrace populations. (A) Proportion of colocalizing HR (colored points) and simulated colocalizing values under random assignment of HRIs (gray boxplots). (B) LD-based recombination intensity in each of the four populations WE, EE, WA, and EA around HRIs specific to one population.
Fig. 6.
Fig. 6.
Relationships between correlation of local recombination intensity and FST per genomic region. (A) Relationship per genomic region. The slopes values are estimated by linear regression and gives the FST effects on the correlation of recombination profiles. (B) Ranked slope estimates (colored points) and their 95% confidence interval (gray bar). Blue color represents slopes with a confidence interval overlapping 0 and red color confidence interval not overlapping 0.

References

    1. Altschul SF, Gish W, Miller W, Myers EW, Lipman DJ.. 1990. Basic local alignment search tool. J Mol Biol. 215(3):403–410. - PubMed
    1. Auton A, McVean G.. 2007. Recombination rate estimation in the presence of hotspots. Genome Res. 17(8):1219–1227. - PMC - PubMed
    1. Auton A, McVean G.. 2012. Estimating recombination rates from genetic variation in humans. In: Anisimova M, editor. Evolutionary genomics: statistical and computational methods, Vol. 2. Totowa (NJ: ): Humana Press. p. 217–237. - PubMed
    1. Auton A, et al.2013. Genetic recombination is targeted towards gene promoter regions in dogs. PLOS Genet. 9(12):e1003984. - PMC - PubMed
    1. Badr A, et al.2000. On the origin and domestication history of Barley (Hordeum vulgare). Mol Biol Evol. 17(4):499–510. - PubMed

Publication types