. 2021 Dec;86(4):893-919.
doi: 10.1007/s11336-021-09773-2. Epub 2021 Jun 29.

A Guide for Sparse PCA: Model Comparison and Applications

Affiliations

A Guide for Sparse PCA: Model Comparison and Applications

Rosember Guerra-Urzola et al. Psychometrika. 2021 Dec.

Abstract

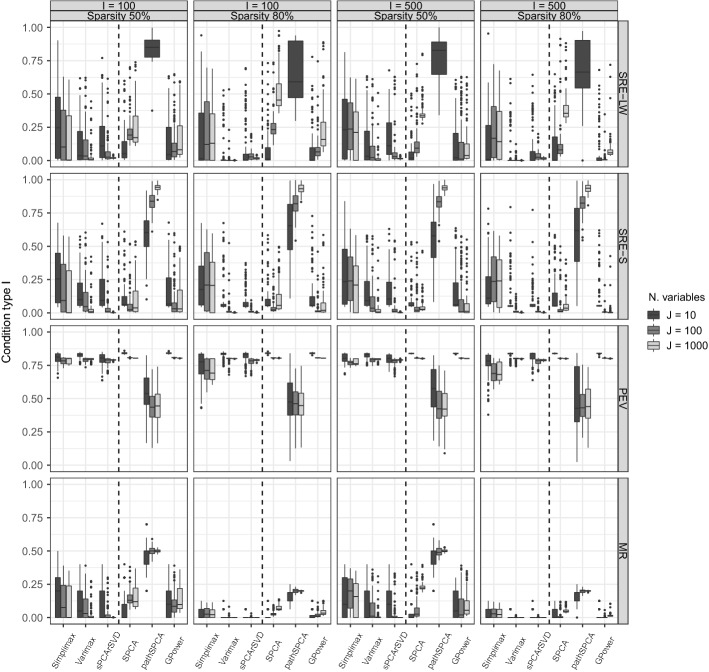
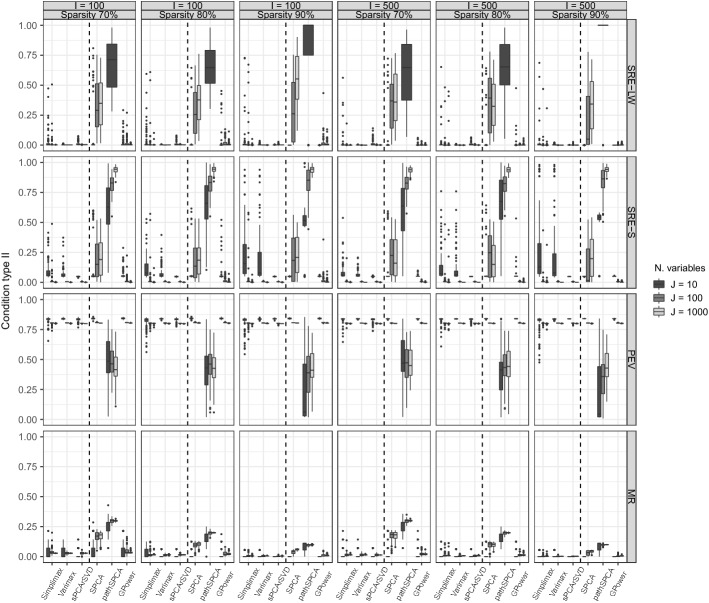
PCA is a popular tool for exploring and summarizing multivariate data, especially those consisting of many variables. PCA, however, is often not simple to interpret, as the components are a linear combination of the variables. To address this issue, numerous methods have been proposed to sparsify the nonzero coefficients in the components, including rotation-thresholding methods and, more recently, PCA methods subject to sparsity inducing penalties or constraints. Here, we offer guidelines on how to choose among the different sparse PCA methods. Current literature misses clear guidance on the properties and performance of the different sparse PCA methods, often relying on the misconception that the equivalence of the formulations for ordinary PCA also holds for sparse PCA. To guide potential users of sparse PCA methods, we first discuss several popular sparse PCA methods in terms of where the sparseness is imposed on the loadings or on the weights, assumed model, and optimization criterion used to impose sparseness. Second, using an extensive simulation study, we assess each of these methods by means of performance measures such as squared relative error, misidentification rate, and percentage of explained variance for several data generating models and conditions for the population model. Finally, two examples using empirical data are considered.

Keywords: dimension reduction; exploratory data analysis; high dimension-low sample size; regularization; sparse principal components analysis.


Figures

Fig. 1
Fig. 1
Matching sparsity: Boxplots of the performance measures in conditions with 80% of variance accounted by the model in the data and two components. Within each panel, a dashed line divides the boxplots for sparse loadings methods (at the left side of the dashed line) from those for sparse weights methods. The top row summarizes the squared relative error (SRE-LW) for the loadings (at the left of the dashed line) and weights (at the right of the dashed line), the second row the SRE-S for the component scores, the third row (PEV) the proportion of variance in the data explained by the estimated model, and the bottom row the misidentification rate (MR).
Fig. 2
Fig. 2
Double sparsity: Boxplots of the performance measures in conditions with 80% of variance accounted by the model in the data and two components. Within each panel, a dashed line divides the boxplots for sparse loadings methods (at the left side of the dashed line) from those for sparse weights methods. The top row summarizes the squared relative error (SRE-LW) for the loadings (at the left of the dashed line) and weights (at the right of the dashed line), the second row the SRE-S for the component scores, the third row (PEV) the proportion of variance in the data explained by the estimated model, and the bottom row the misidentification rate (MR).
Fig. 3
Fig. 3
Mismatching sparsity: boxplots of the performance measures in conditions with 80% of variance accounted by the model in the data and two components. Within each panel, a dashed line divides the boxplots for sparse loadings methods (at the left side of the dashed line) from those for sparse weights methods. The top row summarizes the squared relative error (SRE-LW) for the loadings (at the left of the dashed line) and weights (at the right of the dashed line), the second row the SRE-S for the component scores, the third row (PEV) the proportion of variance in the data explained by the estimated model, and the bottom row the misidentification rate (MR).
Fig. 4
Fig. 4
Misidentification rate (MR): boxplots of the MR in conditions with 80% of variance accounted by the model in the data, a proportion of sparsity of 0.8, and two components. Within each panel, a dashed line is used to divide the boxplots for sparse loadings methods (at the left side of the dashed line) from those for sparse weights methods.
Fig. 5
Fig. 5
Percentage of explained variance (PEV): boxplots of the PEV in conditions with 80% of variance accounted by the model in the data, a proportion of sparsity of 0.8, and two components. Within each panel, a dashed line is used to divide the boxplots for sparse loadings methods (at the left side of the dashed line) from those for sparse weights methods.
Fig. 6
Fig. 6
Index of sparseness(IS) and percentage of explained variance (PEV) against the proportion of sparsity (PS).
Fig. 7
Fig. 7
Biplot: the dots in each subplot represent the component scores, the arrows the component loadings.
Fig. 8
Fig. 8
Index of sparseness and percentage of explained variance against the proportion of sparsity when applying GPower to the gene expression data set.
Fig. 9
Fig. 9
Scatter plot of component scores.

References

    1. Adachi K, Trendafilov NT. Sparse principal component analysis subject to prespecified cardinality of loadings. Computational Statistics. 2016;314(4):1403–1427. doi: 10.1007/s00180-015-0608-4. - DOI
    1. Baik J, Silverstein JW. Eigenvalues of large sample covariance matrices of spiked population models. Journal of Multivariate Analysis. 2006;97(6):1382–1408. doi: 10.1016/j.jmva.2005.08.003. - DOI
    1. Beck A, Teboulle M. A fast iterative Shrinkage–Thresholding algorithm for linear inverse problems. SIAM Journal of Imaging Sciences. 2009;2(1):183–202. doi: 10.1137/080716542. - DOI
    1. Bertsimas, D., King, A., & Mazumder, R. (2016). Best subset selection via a modern optimization lens (Vol. 44) (No. 2). 10.1214/15-AOS1388
    1. Cadima J, Jolliffe IT. Loadings and correlations in the interpretation of principal components. Journal of Applied Statistics. 1995;22(2):203–214. doi: 10.1080/757584614. - DOI