. 2021 Jun;11(6):e417.
doi: 10.1002/ctm2.417.

Adipose-specific ATGL ablation reduces burn injury-induced metabolic derangements in mice

Affiliations

Adipose-specific ATGL ablation reduces burn injury-induced metabolic derangements in mice

Supreet Kaur et al. Clin Transl Med. 2021 Jun.

Abstract

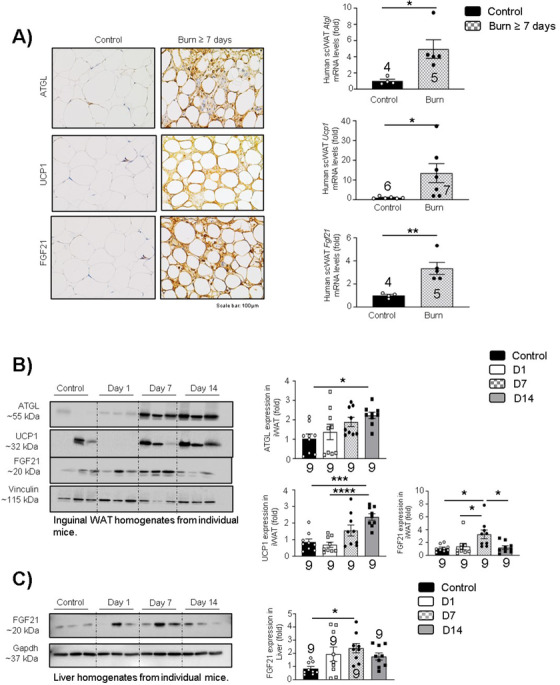
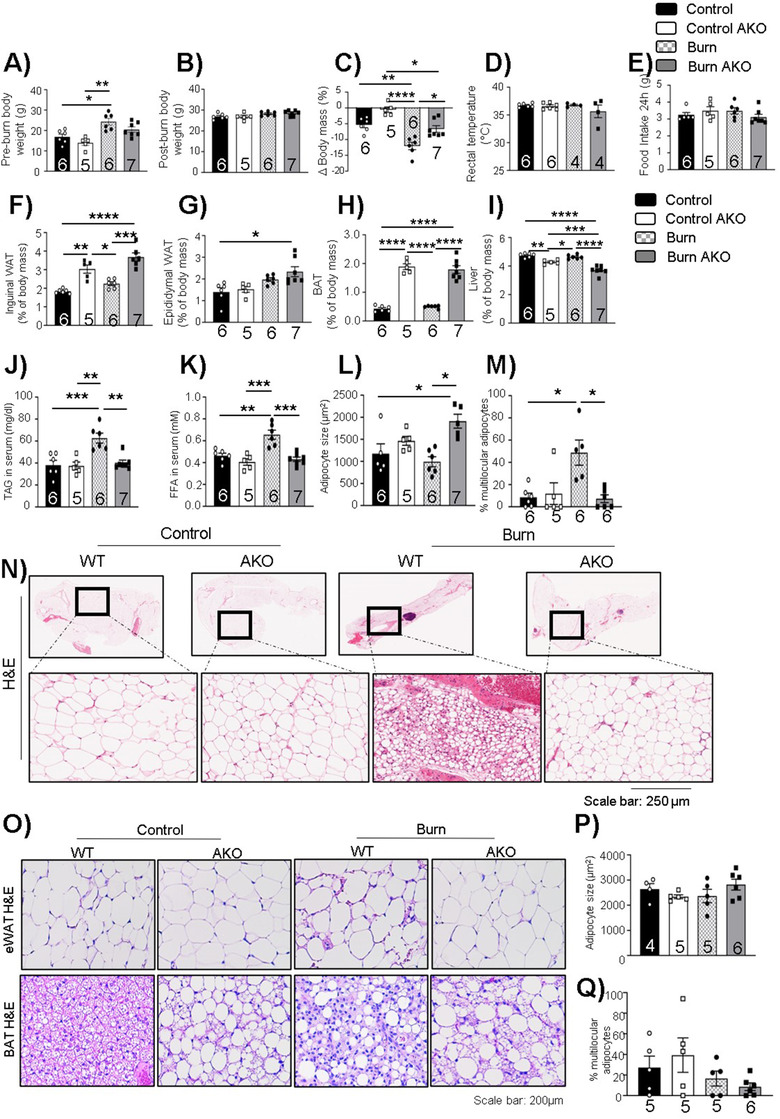
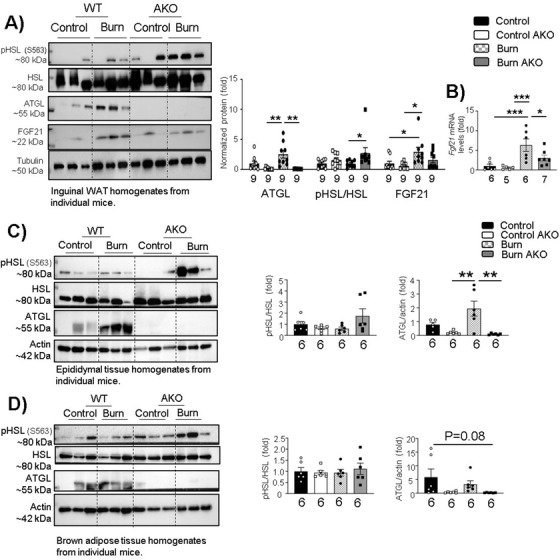
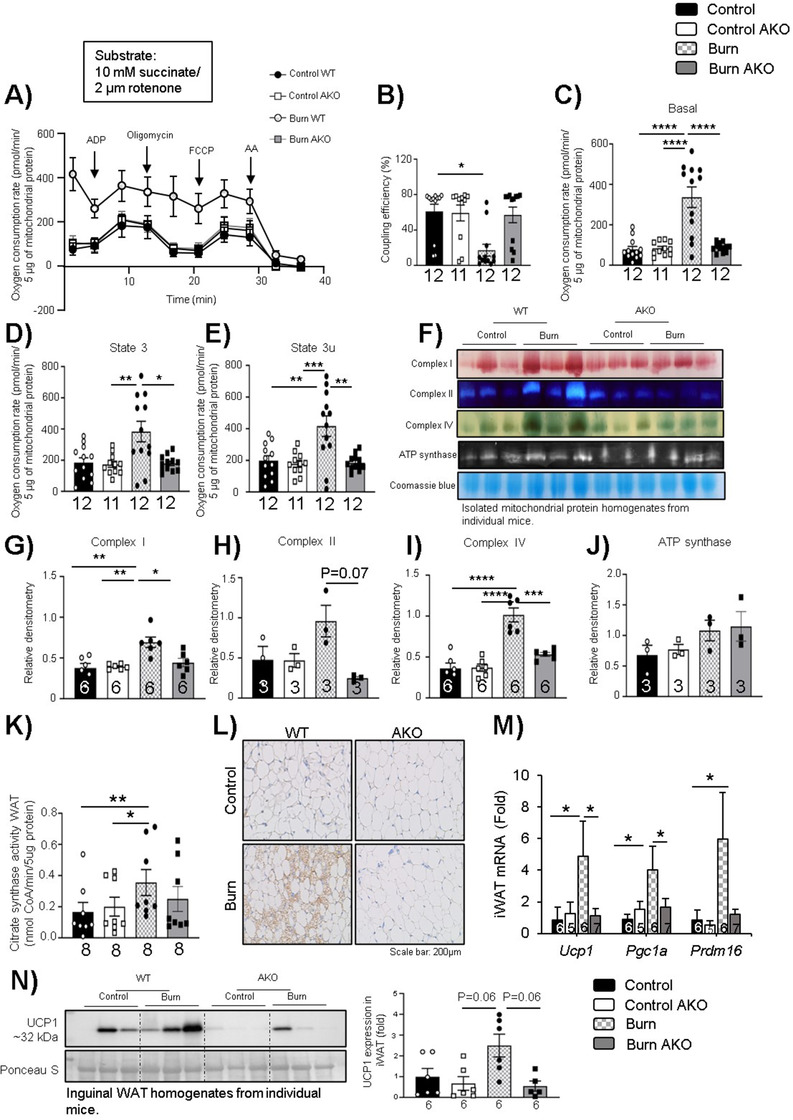
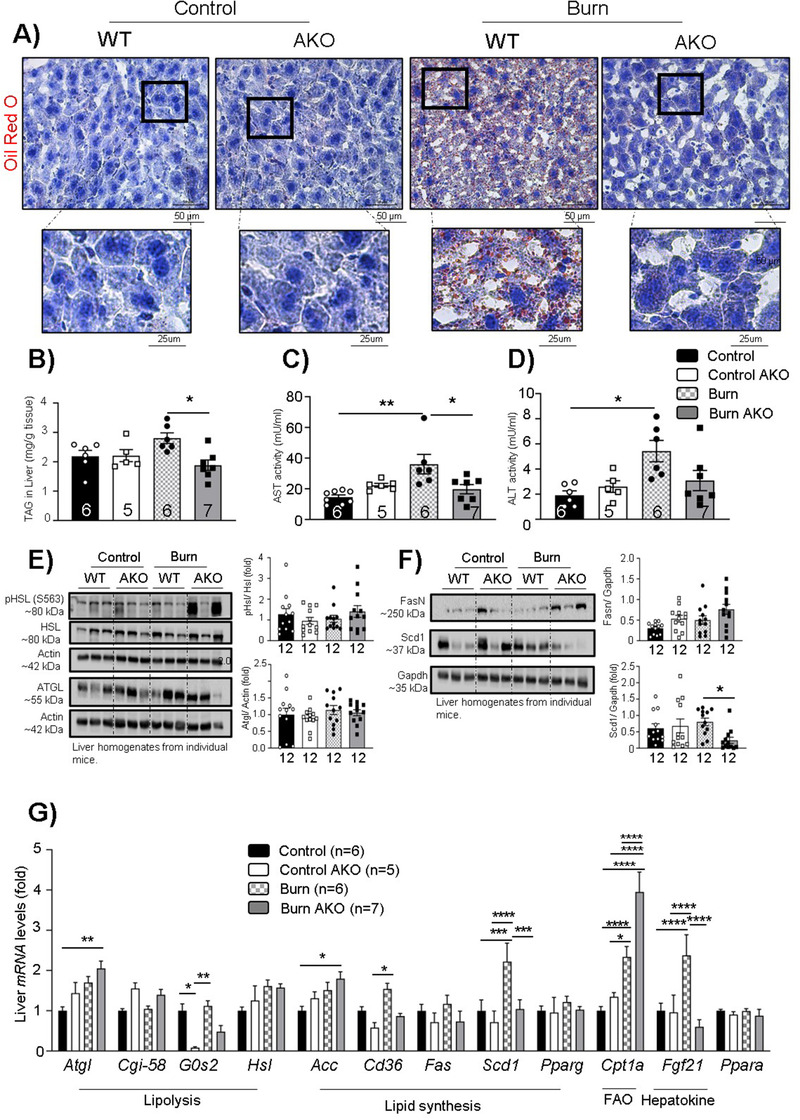
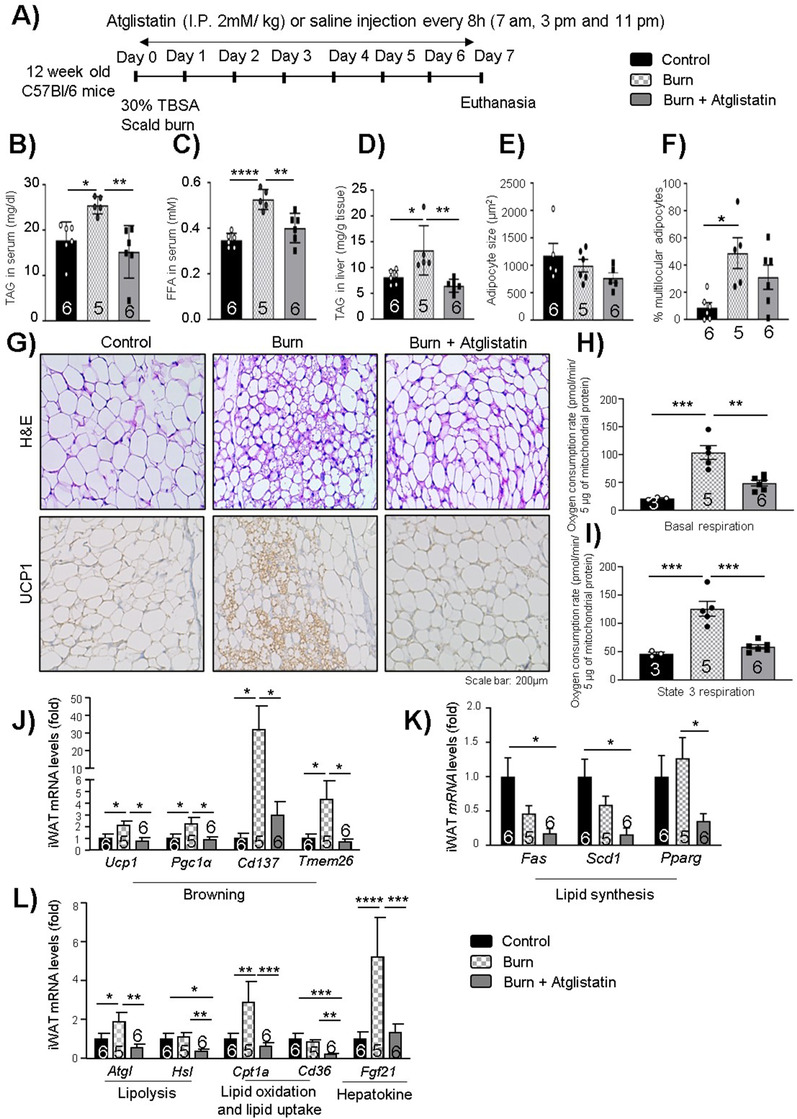
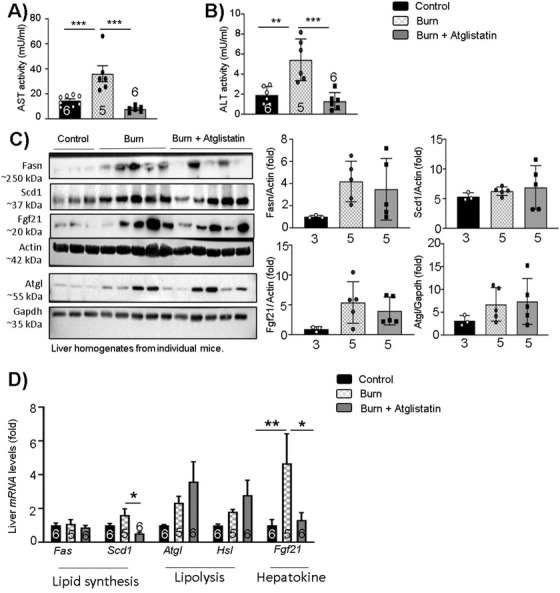
Hypermetabolism following severe burn injuries is associated with adipocyte dysfunction, elevated beige adipocyte formation, and increased energy expenditure. The resulting catabolism of adipose leads to detrimental sequelae such as fatty liver, increased risk of infections, sepsis, and even death. While the phenomenon of pathological white adipose tissue (WAT) browning is well-documented in cachexia and burn models, the molecular mechanisms are essentially unknown. Here, we report that adipose triglyceride lipase (ATGL) plays a central role in burn-induced WAT dysfunction and systemic outcomes. Targeting adipose-specific ATGL in a murine (AKO) model resulted in diminished browning, decreased circulating fatty acids, and mitigation of burn-induced hepatomegaly. To assess the clinical applicability of targeting ATGL, we demonstrate that the selective ATGL inhibitor atglistatin mimics the AKO results, suggesting a path forward for improving patient outcomes.

Keywords: FGF21; adipose triglyceride lipase; browning; burns; mitochondria; trauma; uncoupling.


Conflict of interest statement

The authors have no conflict of interest to declare.

Figures

FIGURE 1
FIGURE 1
Alterations in ATGL, UCP1, and FGF21 expression in hypermetabolic conditions: (A) Immunohistochemistry and quantitative real‐time PCR in fat samples obtained from consented normal versus burn (≥7 days) human patients and assessed for Atgl, Ucp1, and Fgf21 expression. (B) Western blot analysis and quantification of murine WAT biopsies collected on days 1, 7, and 14 and analyzed for ATGL, UCP1, and FGF21 protein expression. (C) Western blot analysis and quantification of murine liver biopsies collected on days 1, 7, and 14 and analyzed for FGF21 protein expression. The results displayed are the average and SEM analyzed in the specified number of mice samples. Statistical significance was assessed using one‐way ANOVA as appropriate
FIGURE 2
FIGURE 2
Adipose‐specific ATGL deletion impact on body weight and adipose tissue post‐burn injury: Twelve‐week‐old ATGL floxed and knockout mice were treated with 30%TBSA injury and monitored daily for 7 days. (A) Pre‐burn body weight. (B) Post‐burn body weight. (C) Change in body mass on day 7 in comparison to day 0. (D) Rectal temperature at day 7 of individual mice. (E) Food intake (24 h) at day 7 of individual mice. (F) Inguinal white adipose tissue (iWAT). (G) Epididymal white adipose tissue (eWAT). (H) Brown adipose tissue (BAT), and (I) Liver normalized to the body weight of individual mice. (J) Triacylglycerol (TAG) content in serum samples. (K) Free fatty acid levels in serum samples. (L) Adipocyte size of adipocytes in iWAT. (M) Percentage of normalized multilocular adipocytes normalized to total number of adipocytes in sections of iWAT. (N) Hematoxylin and eosin (H&E) staining (zoom in and zoom out images of whole fat pad) in WAT samples. (O) Hematoxylin staining of epididymal and brown adipose tissue. (P) Adipocyte size of adipocytes in eWAT. (Q) Percentage of normalized multilocular adipocytes normalized to total number of adipocytes in sections of epididymal adipose tissue. The results displayed are the average and SEM analyzed in the specified number of mice samples. Statistical significance was assessed using two‐way ANOVA as appropriate
FIGURE 3
FIGURE 3
Adipose‐specific ATGL deletion impact on adipose tissue lipolysis post‐burn injury: Twelve‐week‐old ATGL floxed and knockout mice were administered a 30%TBSA thermal injury and monitored daily for 7 days. (A) Western blot analysis and quantification of the expression of targeted proteins (p‐HSL ser 563, HSL, ATGL, FGF21, and tubulin) in WAT. (B) Quantitative PCR analysis of Fgf21 expression in WAT. Western blot analysis and quantification of lipolysis markers (pHSL, HSL, and ATGL) in (C) epididymal adipose tissue and (D) brown adipose tissue. The results displayed are the average and SEM analyzed in the specified number of mice samples. Statistical significance was assessed using two‐way ANOVA as appropriate
FIGURE 4
FIGURE 4
Adipose‐specific ATGL deletion suppresses mitochondrial activity and prevents browning in WAT post‐burn injury: Twelve‐week‐old ATGL floxed and knockout mice were treated with 30%TBSA injury and monitored daily for 7 days. (A) Mitochondria respiration profiles of isolated WAT mitochondria from control (black), control AKO (white), burn (light grey), and burn AKO (dark grey). (B) Coupling efficiency (%) measured by the Seahorse stress test report generator. Respiration paramateres (C) Basal, (D) state 3, (E) state 3u in isolated mitochondria as measured via Seahorse assay. (F‐J) Isolated mitochondrial protein was run and assessed in a gradient gel via BN‐PAGE, and activity assays were performed for complexes such as I, II, IV, and ATP synthase. (K) Citrate synthase activity. (L) Immunohistochemistry for UCP1 expression. (M) Quantitative PCR analysis of browning markers (Ucp1, Pgc1a, and Prdm16) and (N) Western blot analysis of UCP1 expression normalized to Ponceau S as loading control in WAT. The results displayed are the average and SEM analyzed in the specified number of mice samples. Statistical significance was assessed using two‐way ANOVA tests as appropriate
FIGURE 5
FIGURE 5
Adipose‐specific ATGL deletion rescues against fatty liver development post‐burn injury: Twelve‐week‐old ATGL floxed and knockout mice were treated with 30%TBSA injury and monitored daily for 7 days. (A) Oil Red O staining (zoom in and zoom out) for visualization of fat droplets in liver sections. (B) Tri‐acylglycerol (TAG) content in liver samples normalized to tissue weight. (C) Aspartate aminotransferase (AST) levels in serum samples. (D) Alanine aminotransferase (ALT) levels in serum samples. (E) Western blot analysis for the expression of targeted proteins (p‐HSL ser 563, HSL, ATGL, and actin) in the liver. (F) Western blot analysis and quantification of the expression of targeted proteins (Fas, Scd1, and gapdh) in the liver. (G) Quantitative PCR analysis of multiple genes in the liver. The results displayed are the average and SEM analyzed in the specified number of mice samples. Statistical significance was assessed using two‐way ANOVA as appropriate
FIGURE 6
FIGURE 6
Therapeutic impact of atglistatin on iWAT post‐burn injury: Twelve‐week‐old C57BL/6 mice were treated with 30%TBSA injury and treated with Atglistatin (2 mmol/kg i.p.) starting at day 1 and monitored daily for 7 days. (A) Atglistatin treatment study plan. (B) Tri‐acylglycerol (TAG) content in serum samples. (C) Free fatty acid levels in serum samples. (D) TAG content in liver samples normalized to tissue weight. (E) Adipocyte size of adipocytes in iWAT. (F) Percentage of multilocular adipocytes normalized to total adipocytes. (G) Hematoxylin and eosin (H&E) staining and immunohistochemistry for UCP1 expression in WAT samples. (H and I) Basal, and state 3 respiration parameters were measured in isolated mitochondria using Seahorse assays. Quantitative PCR analysis of (J) browning markers (Ucp1, Pgc1a, Cd137, and Tmem26), (K) lipid synthesis markers (Fas, Scd1, and Pparg), and (L) lipolysis markers (Atgl and Hsl), lipid oxidation (Cpt1a), lipid uptake (Cd36), and hepatokine (Fgf21) markers in WAT. The results displayed are the average and SEM analyzed in the specified number of mice samples. Statistical significance was assessed using one‐way ANOVA tests as appropriate
FIGURE 7
FIGURE 7
Therapeutic impact of atglistatin on liver post‐burn injury: Twelve‐week‐old C57BL/6 mice were treated with 30%TBSA injury and treated with atglistatin (2 mmol/kg i.p.) starting at day 1 and monitored daily for 7 days. (A) AST activity in serum samples. (B) ALT activity in serum samples. (C) Western blot analysis and quantification of target proteins in the liver. (D) Quantitative PCR analysis of lipid synthesis (Fas and Scd1), lipolysis (Atgl and Hsl), and hepatokine (Fgf21) markers in the liver. The results displayed are the average and SEM analyzed in the specified number of mice samples. Statistical significance was assessed using one‐way ANOVA tests as appropriate

References

    1. Auge C, Samadi O, Jeschke MG. The biochemical alterations underlying post‐burn hypermetabolism. Biochim Biophys Acta Mol Basis Dis. 2017;1863(10 Pt B):2633–2644. - PMC - PubMed
    1. Fole N, Marshall S, Pikul J, Salter K, Teasell R. Hypermetabolism following moderate to severe traumatic acute brain injury: a systematic review. J Neurotrauma. 2008;25(12):1415–1431. - PubMed
    1. Vassimo HS, Monteiro JP, Machado AA, et al. Which equation should be used to measure energy expenditure in HIV‐infected patients?. Revista de Nutrição. 2013;26:225–232.
    1. Raj V, Ahern KW, Martinez BA, et al. Adipocyte lipolysis drives acute stress‐induced insulin resistance. Sci Rep. 2020;10(1):18166. - PMC - PubMed
    1. William FN, Herndon DN, Jeschke MG. The hypermetabolic response to burn injury and interventions to modify this response. Clin Plast Surg. 2009;36(4):583–596. - PMC - PubMed

Publication types

LinkOut - more resources