Review
. 2021 Oct 6:37:23-41.
doi: 10.1146/annurev-cellbio-120319-025356. Epub 2021 Jun 29.

Self-Organization of Cellular Units

Affiliations
Review

Self-Organization of Cellular Units

Timothy J Mitchison et al. Annu Rev Cell Dev Biol. .

Abstract

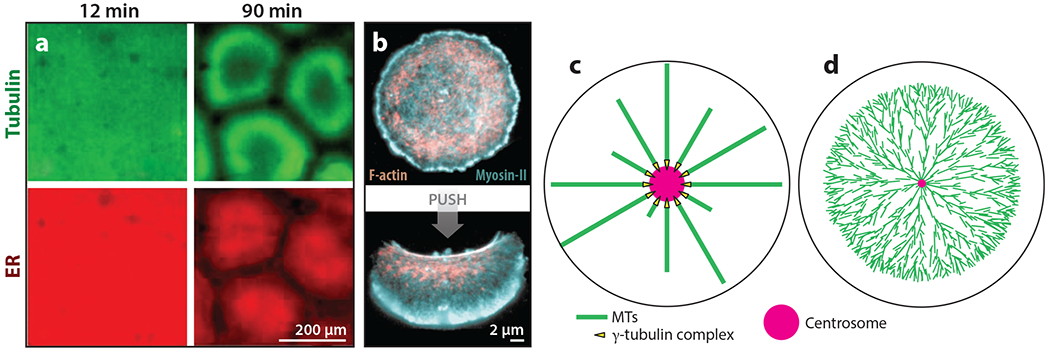
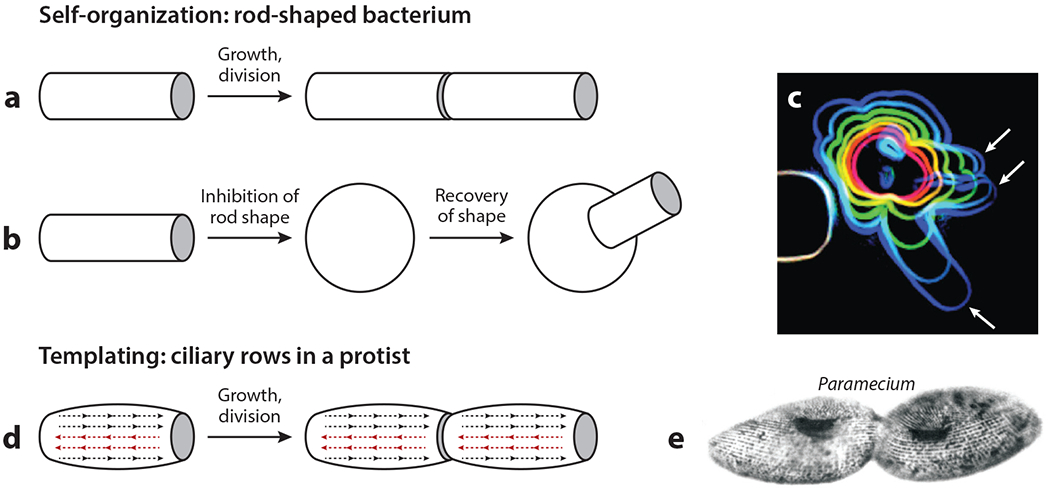
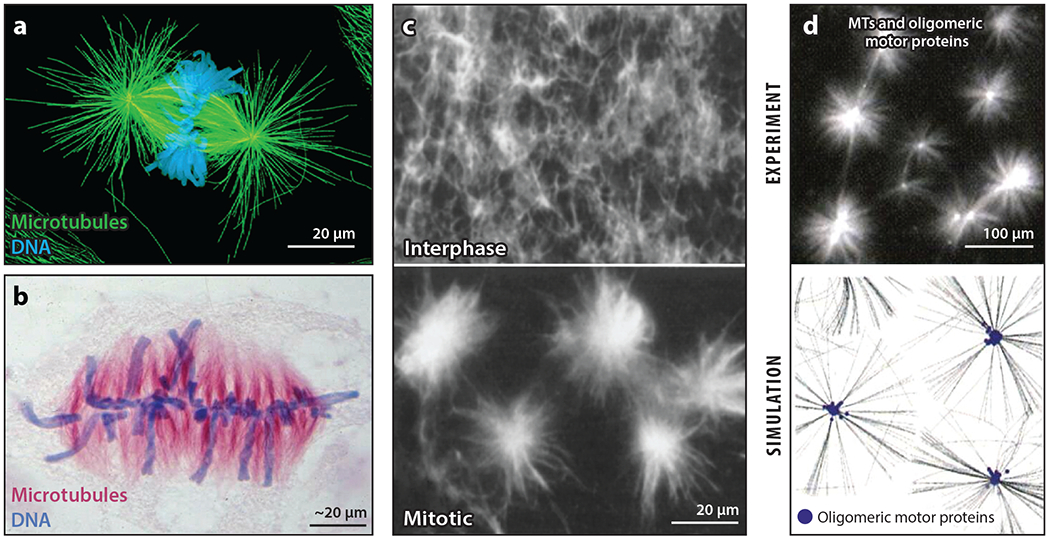
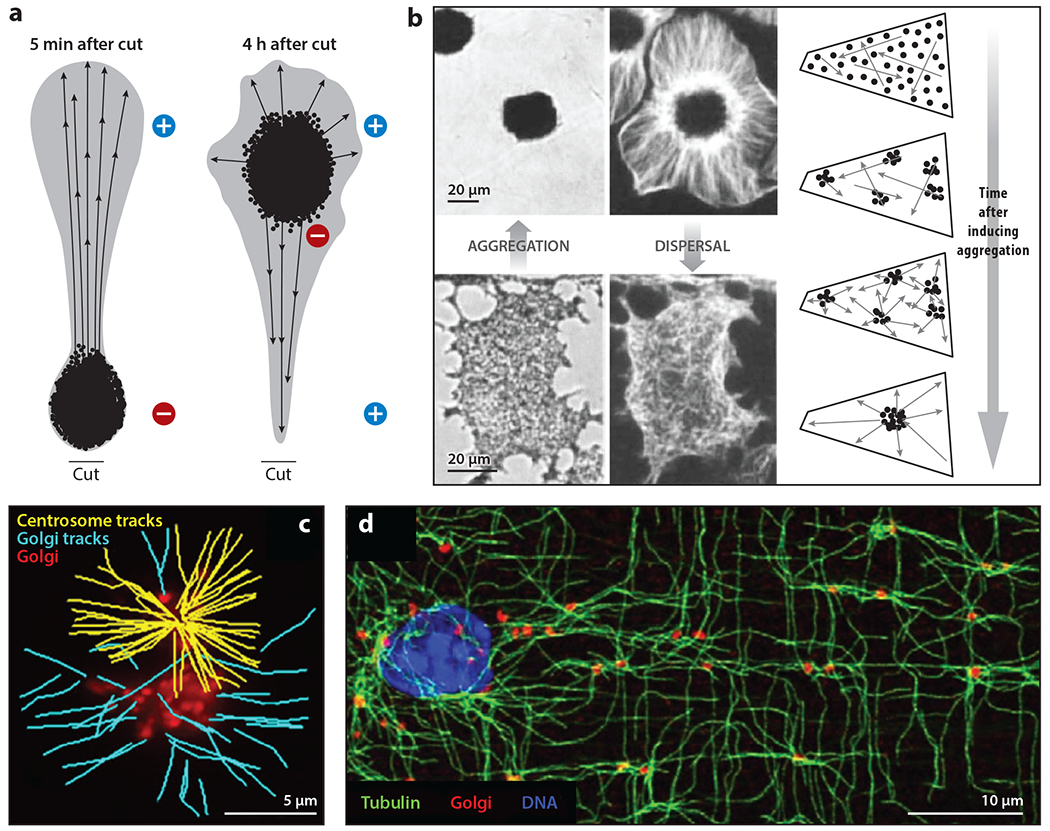
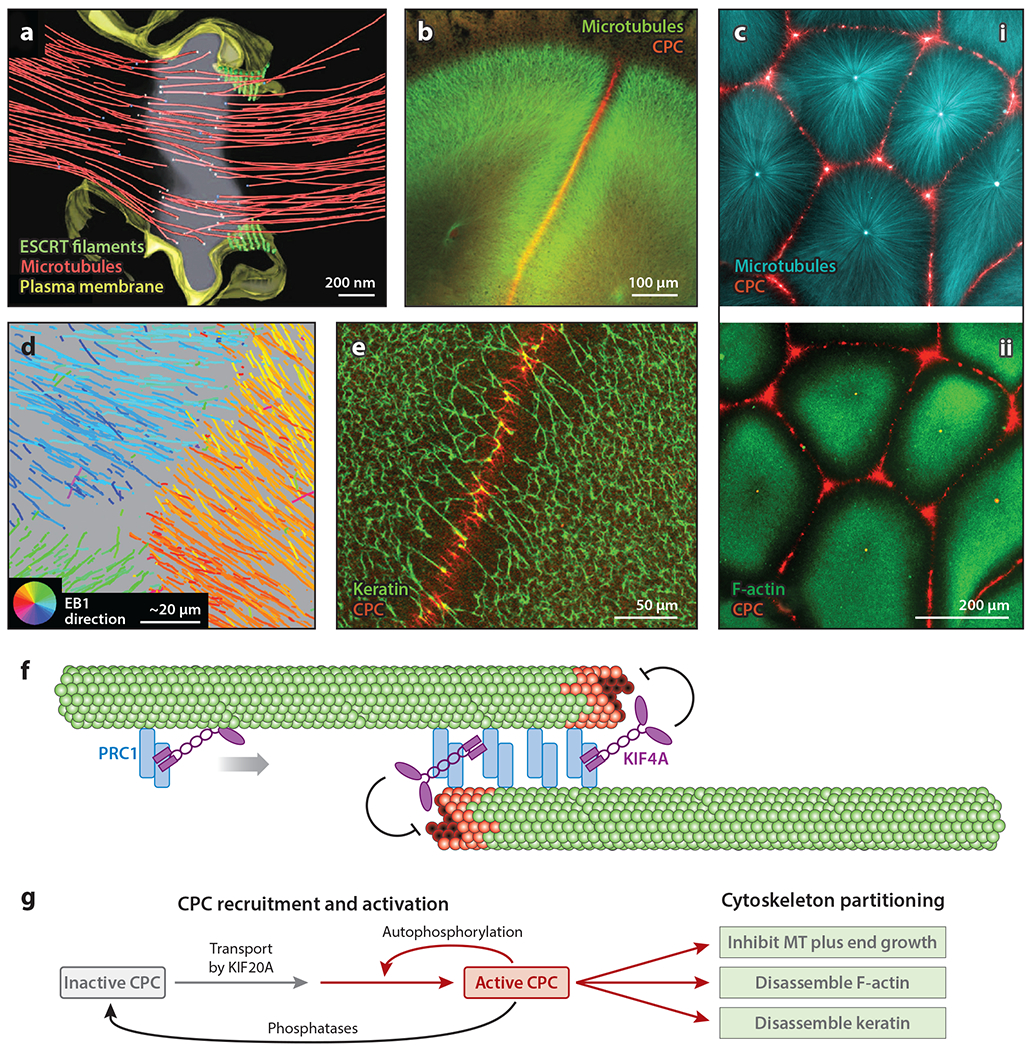
The purpose of this review is to explore self-organizing mechanisms that pattern microtubules (MTs) and spatially organize animal cell cytoplasm, inspired by recent experiments in frog egg extract. We start by reviewing conceptual distinctions between self-organizing and templating mechanisms for subcellular organization. We then discuss self-organizing mechanisms that generate radial MT arrays and cell centers in the absence of centrosomes. These include autocatalytic MT nucleation, transport of minus ends, and nucleation from organelles such as melanosomes and Golgi vesicles that are also dynein cargoes. We then discuss mechanisms that partition the cytoplasm in syncytia, in which multiple nuclei share a common cytoplasm, starting with cytokinesis, when all metazoan cells are transiently syncytial. The cytoplasm of frog eggs is partitioned prior to cytokinesis by two self-organizing modules, protein regulator of cytokinesis 1 (PRC1)-kinesin family member 4A (KIF4A) and chromosome passenger complex (CPC)-KIF20A. Similar modules may partition longer-lasting syncytia, such as early Drosophila embryos. We end by discussing shared mechanisms and principles for the MT-based self-organization of cellular units.

Keywords: centrosome; cytoskeleton; microtubules; nucleation; self-organization; syncytium.


Figures

Figure 1
Figure 1
Examples of self-organization and templating in cellular organization. (a) The self-organization of cellular units in interphase frog egg extract. Panel a adapted with permission from Cheng & Ferrell (2019). (b) An example of bistability in actomyosin-based cellular organization. Keratocyte fragments were stable in two organizational states, (top) circular/immobile and (bottom) polarized/migrating. Circular nonmotile fragments were converted into polarized motile fragments by pushing with a pipette. Panel b adapted from Verkhovsky et al. (1999). (c) The templating of MT organization by the centrosome in a small cell. (d) The self-organization of a MT aster in a frog egg, in which the aster grows as a traveling wave by MT-stimulated MT nucleation. The cell radius is ~600 μm and the average MT length is ~;15 μm. Panel d adapted from Ishihara et al. (2016). Abbreviations: ER, endoplasmic reticulum; MT, microtubule.
Figure 2
Figure 2
Self-organization and templating in cylindrical cell growth. (a) The growth of a rod-shaped bacterium by the elongation of a constantdiameter cylinder appears templated but is not. (b) The recovery of the cylindrical shape after experimental disruption demonstrates that this process is self-organized. Cylinders of the correct radius emerge from a disorganized starting shape. (c) An image from a shape-recovery experiment in the rod-shaped bacterium Bacillus subtilis. The red to blue outlines show the shape of a single cell at 20-min intervals after initiating recovery. White arrows indicate the emergence of multiple rods with the correct radius. Panel c image adapted with permission from Hussain et al. (2018). (d) The templated growth of ciliary rows in Paramecium, a ciliated protist. The dotted lines with arrowheads represent structurally polarized rows of basal bodies and cilia. Two of the rows (red) were experimentally inverted. The resulting abnormal architecture was inherited for hundreds of generations. Panel d adapted from Beisson & Sonneborn (1965). (e) An image of cell division in Paramecium. Note the continuity of basal body rows prior to cytokinesis. Panel e image adapted from Sonneborn (1964).
Figure 3
Figure 3
Mitotic spindle pole self-organization. (a) A metaphase spindle with centrosomes at the poles from a newt lung cell. Panel a image adapted from O’Connell & Khodjakov (2007). (b) An anastral metaphase spindle from the plant Hemanthus. Panel b image provided by De Mey et al. (1982). (c) The self-organization of asters in mitotic Xenopus egg extract after the addition of taxol. Panel c images adapted with permission from Verde et al. (1991). (d) The self-organization of asters in reconstituted reactions containing taxol-stabilized microtubules (MTs) and oligomeric motor proteins; the top image shows experimental data, while the bottom image is a simulation. Panel d images adapted with permission from Surrey et al. (2001).
Figure 4
Figure 4
The self-organization of radial microtubules (MTs) and nucleation from organelles. (a) The reorganization of MTs in a cut arm from a Holocentrus melanophore. The black dots represent melanosomes after stimulation to aggregate, and the arrows indicate MT polarity. Panel a adapted from McNiven et al. (1984). (b) Rapid and reversible self-organization of MTs (white) and melanosomes (black) in centrosome-free fragments from Tetra melanophores. With melanosomes dispersed, MTs were randomly organized. Triggering aggregation caused MTs to organize into a radial array while melanosomes aggregated and centered over ~10 min, as illustrated in the time course. Panel b images adapted with permission from (left) Rodionov & Borisy (1997) and (right) Vorobjev et al. (2001). (c) MT nucleation from centrosomes and Golgi vesicles (red) visualized by end-binding protein 3 (EB3) comet tracking. Yellow tracks emanate from centrosomes and blue from Golgi vesicles. Panel c image provided by Efimov et al. (2007). (d) Golgi outposts in mouse skeletal muscle. Note the lattice-like arrangement of MTs centered on Golgi outposts. Panel d image adapted with permission from Oddoux et al. (2013).
Figure 5
Figure 5
Partitioning of the cytoskeleton by cytokinesis midzone modules. (a) Cryo-electron microscopy tomogram of a HeLa cell midzone. White dots in the center of the image are MT ends, presumably plus ends. Note that MTs are sharply partitioned. This image is taken after cleavage furrow ingression and shortly before ESCRT-mediated abscission. Panel a image adapted with permission from Guizetti et al. (2011). (b) Confocal image of a frog egg fixed after first mitosis and before cleavage furrow ingression. Two large asters grow from the poles of the mitotic spindle (green). The disc-shaped boundary between these structures exhibits lower MT density and CPC-coated MT bundles (red). Panel b image provided by Nguyen et al. (2014). (c, i) Asters nucleated by artificial centrosomes in frog egg extract (cyan). CPC is recruited to aster boundaries (red). (ii) Same specimen as in subpanel i, showing that CPC recruitment to aster boundaries leads to the local disassembly of F-actin (green) and the partitioning of the cytoplasm. Panel c images provided by Field et al. (2019). (d) MT plus end growth tracks at an aster boundary in frog egg extract. The tracks are color coded by the direction of MT growth. The circular key at bottom left indicates growth direction; e.g., growth toward the top left is coded orange/yellow, while growth toward the bottom right is coded blue/cyan. Growing plus ends stop sharply at the boundary, as indicated by the color change. For a discussion of methods, see Nguyen et al. (2014). Panel d image provided by Nguyen et al. (2014). (e) Disassembly of the keratin network at a boundary between asters in frog egg extract. Panel e image provided by Field et al. (2019). (f) Schematic illustration of the PRC1-KIF4A MT-partitioning module that can self-organize from pure proteins. MT plus ends are at the center; green structures represent GDP tubulin, while red structures represent GTP tubulin. The curved inhibitory arrows indicate the slowing of plus end growth by KIF4A. Panel f adapted from Bieling et al. (2010) and Hannabuss et al. (2019). (g) Flowchart showing the process of the CPC-KIF20A module that partitions actin and keratin networks as well as MTs in frog eggs. Panel g provided by Field et al. (2019). Abbreviations: CPC, chromosome passenger complex; EB1, end-binding protein 1; ESCRT, endosomal sorting complexes required for transport; F-actin, filamentous actin; KIF, kinesin family member; MT, microtubule; PRC1, protein regulator of cytokinesis.

References

    1. Adriaans IE, Hooikaas PJ, Aher A, Vromans MJM, van Es RM, et al. 2020. MKLP2 is a motile kinesin that transports the chromosomal passenger complex during anaphase. Curr. Biol 30:2628–37.e9 - PubMed
    1. Afanzar O, Buss GK, Stearns T, Ferrell JE. 2020. The nucleus serves as the pacemaker for the cell cycle. eLife 9:e59989. - PMC - PubMed
    1. Alfaro-Aco R, Thawani A, Petry S. 2020. Biochemical reconstitution of branching microtubule nucleation. eLife 9:e49797. - PMC - PubMed
    1. Arquint C, Nigg EA. 2016. The PLK4-STIL-SAS-6 module at the core of centriole duplication. Biochem. Soc. Trans 44:1253–63 - PMC - PubMed
    1. Baker J, Theurkauf WE, Schubiger G. 1993. Dynamic changes in microtubule configuration correlate with nuclear migration in the preblastoderm Drosophila embryo. J. Cell Biol 122:113–21 - PMC - PubMed

Publication types

LinkOut - more resources