. 2021 Oct:116:101998.
doi: 10.1016/j.jchemneu.2021.101998. Epub 2021 Jun 26.

Cholinergic boutons are closely associated with excitatory cells and four subtypes of inhibitory cells in the inferior colliculus

Affiliations

Cholinergic boutons are closely associated with excitatory cells and four subtypes of inhibitory cells in the inferior colliculus

Nichole L Beebe et al. J Chem Neuroanat. 2021 Oct.

Abstract

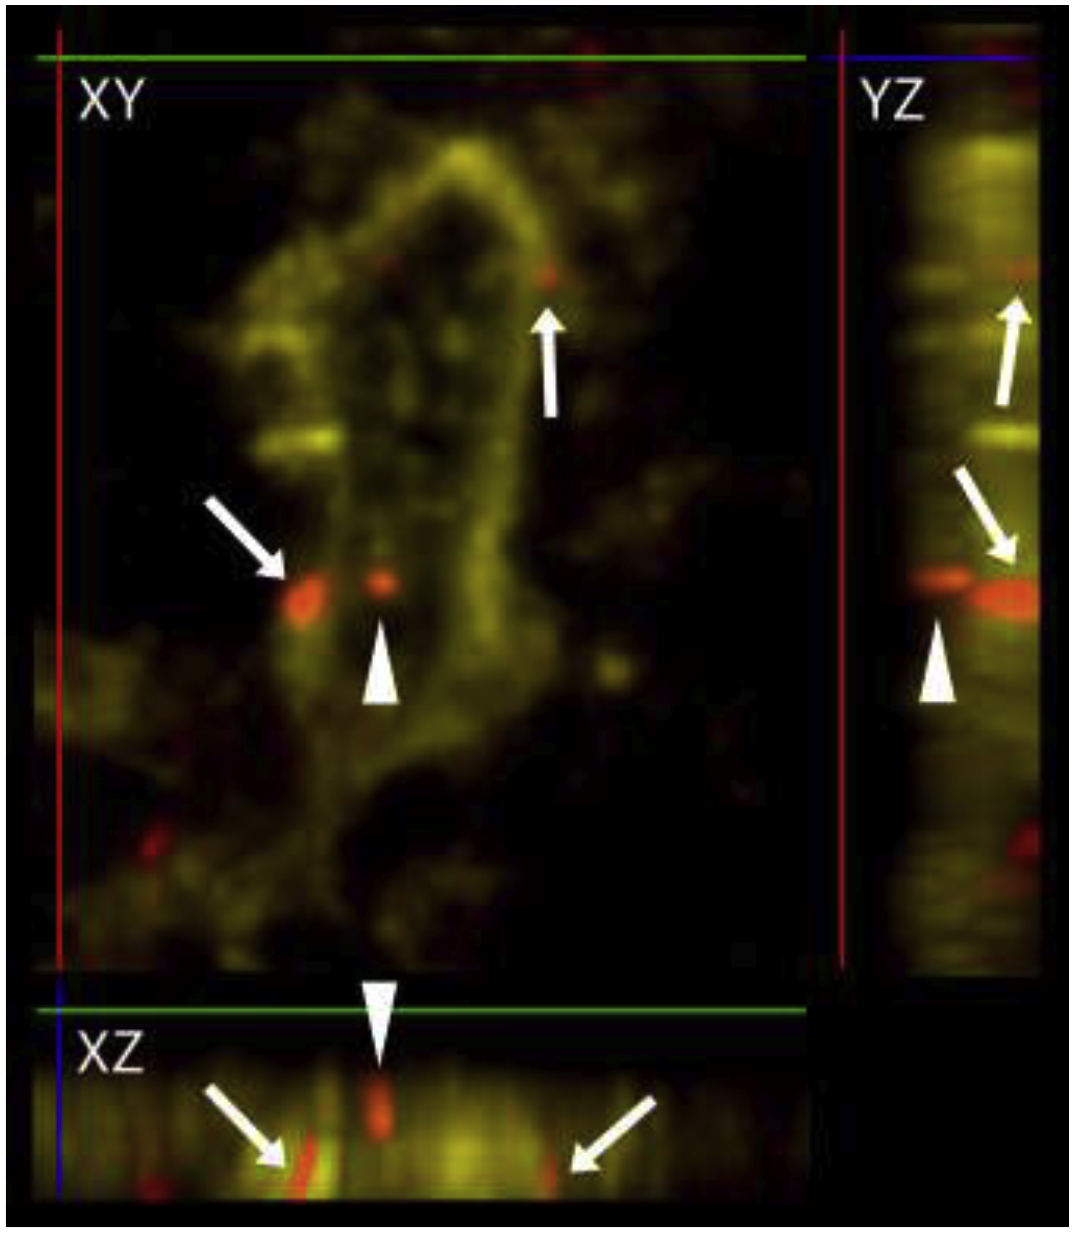
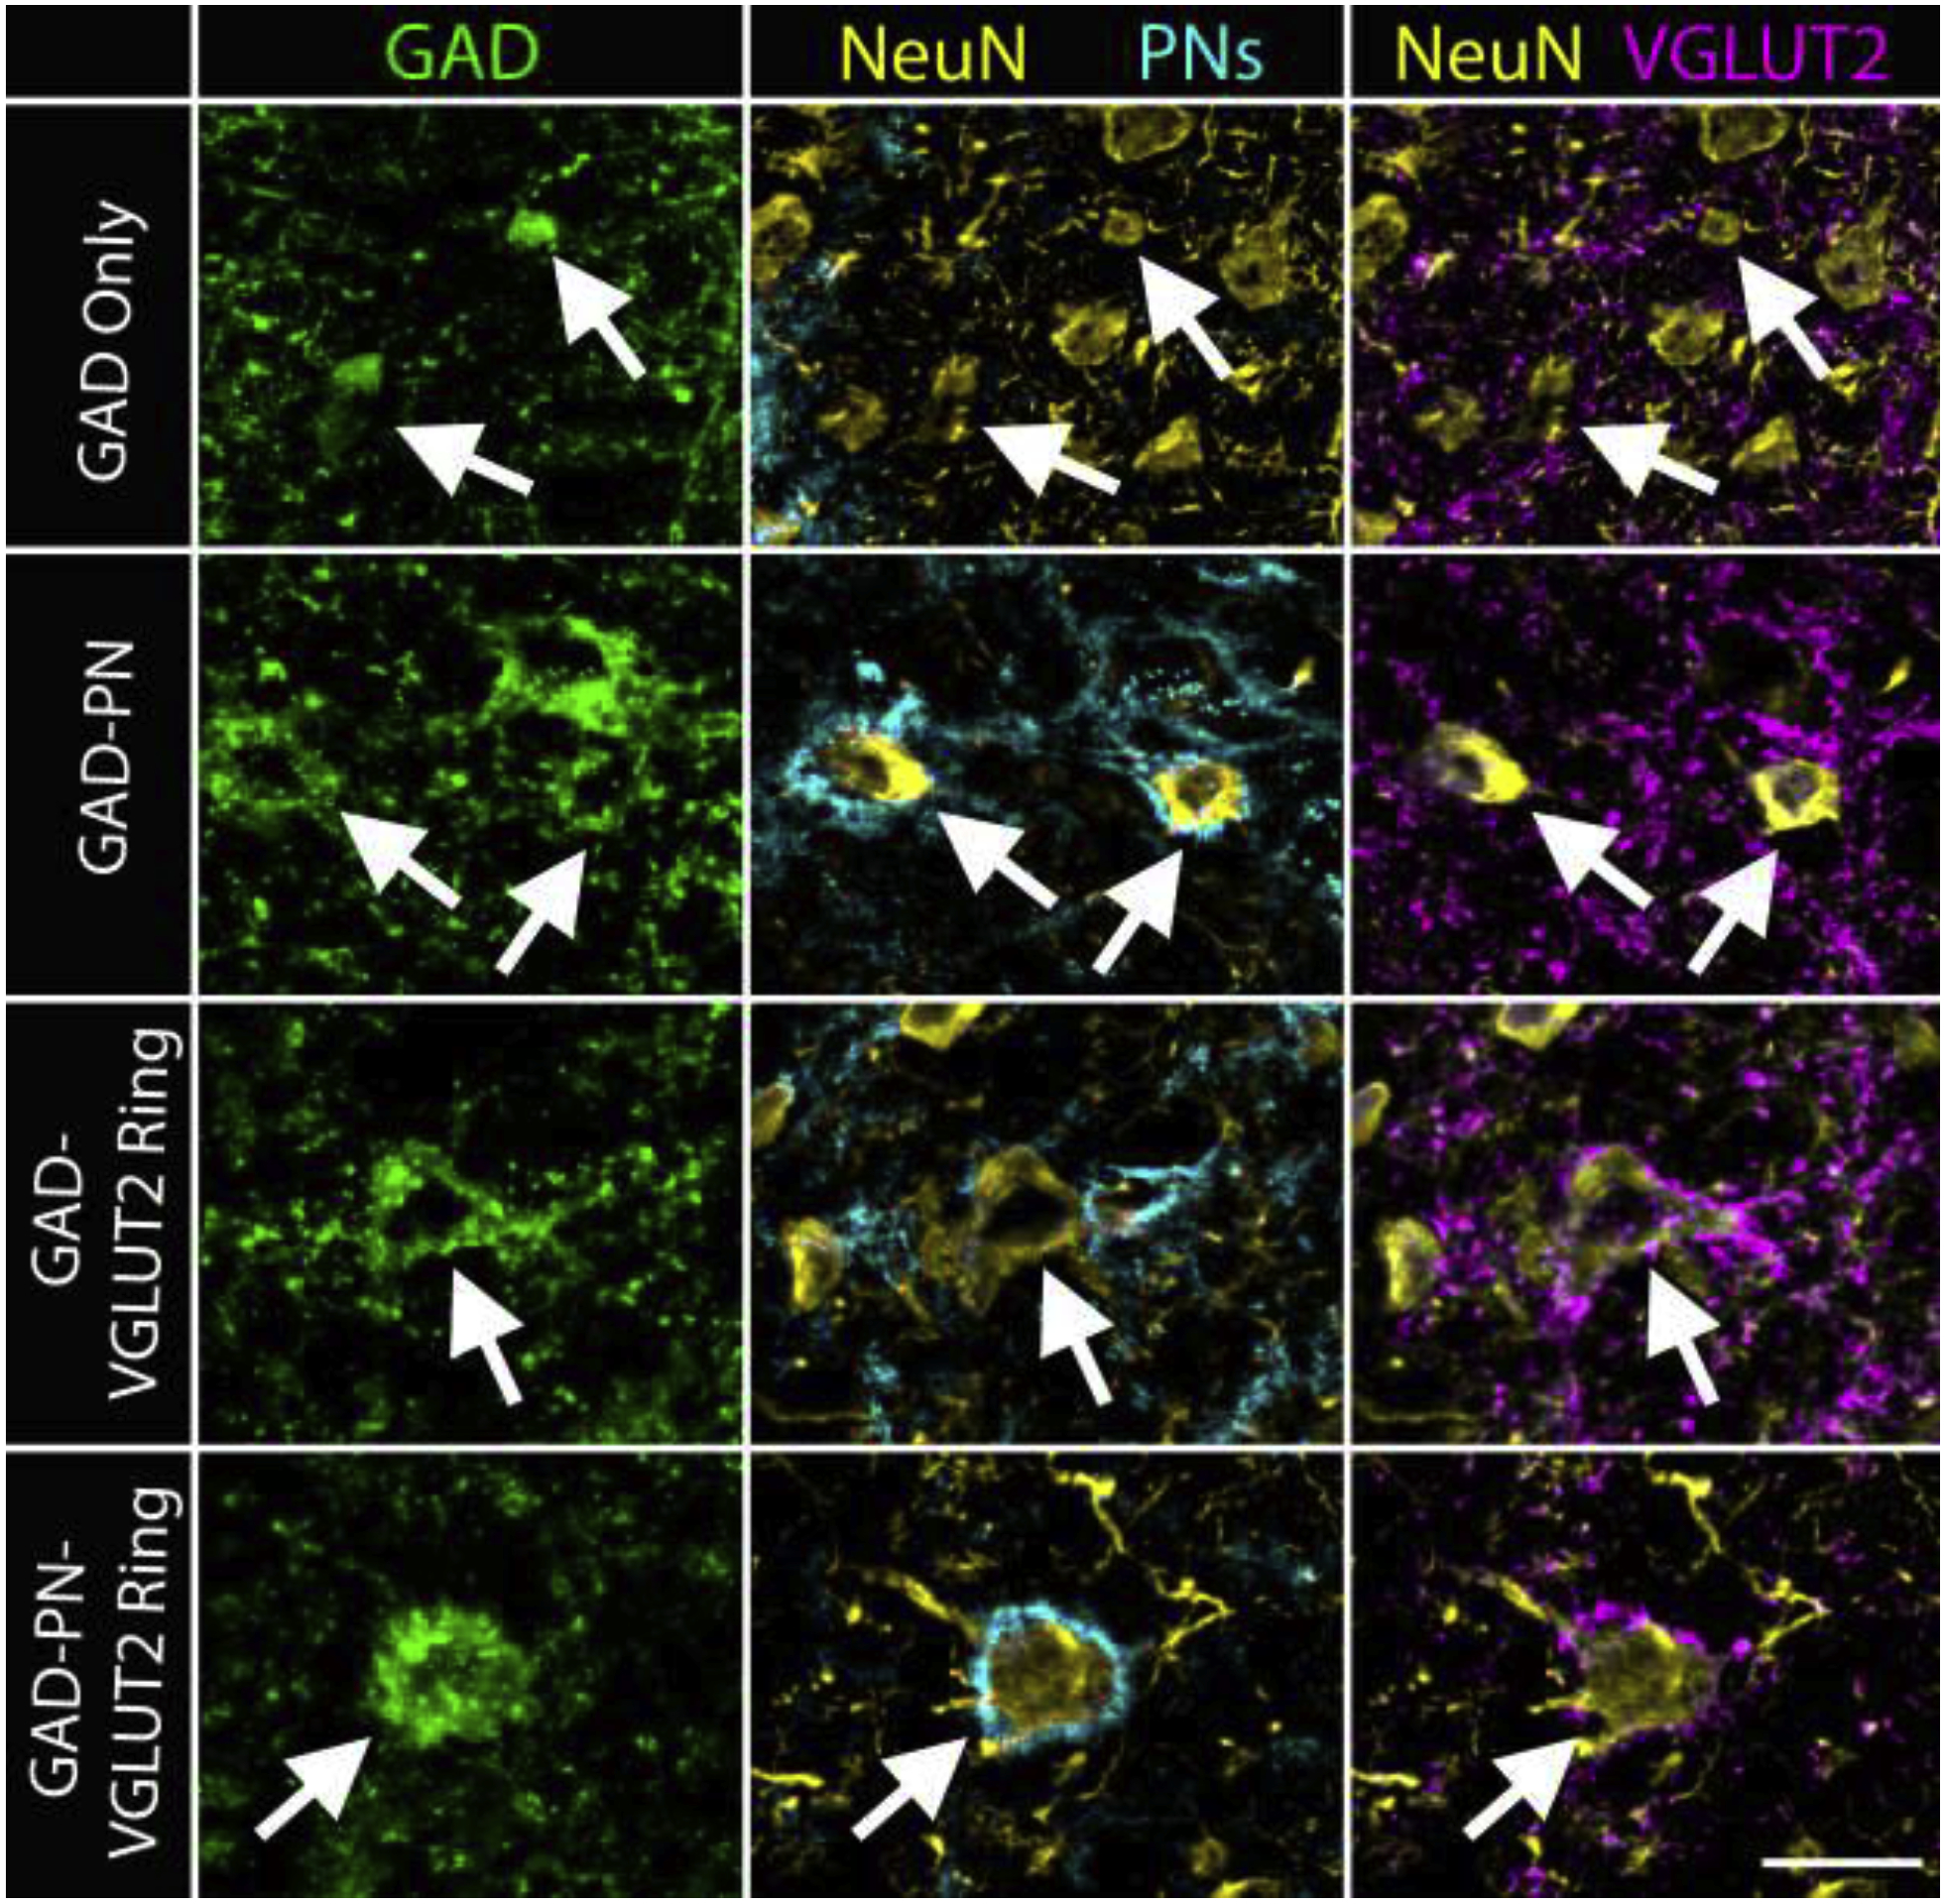
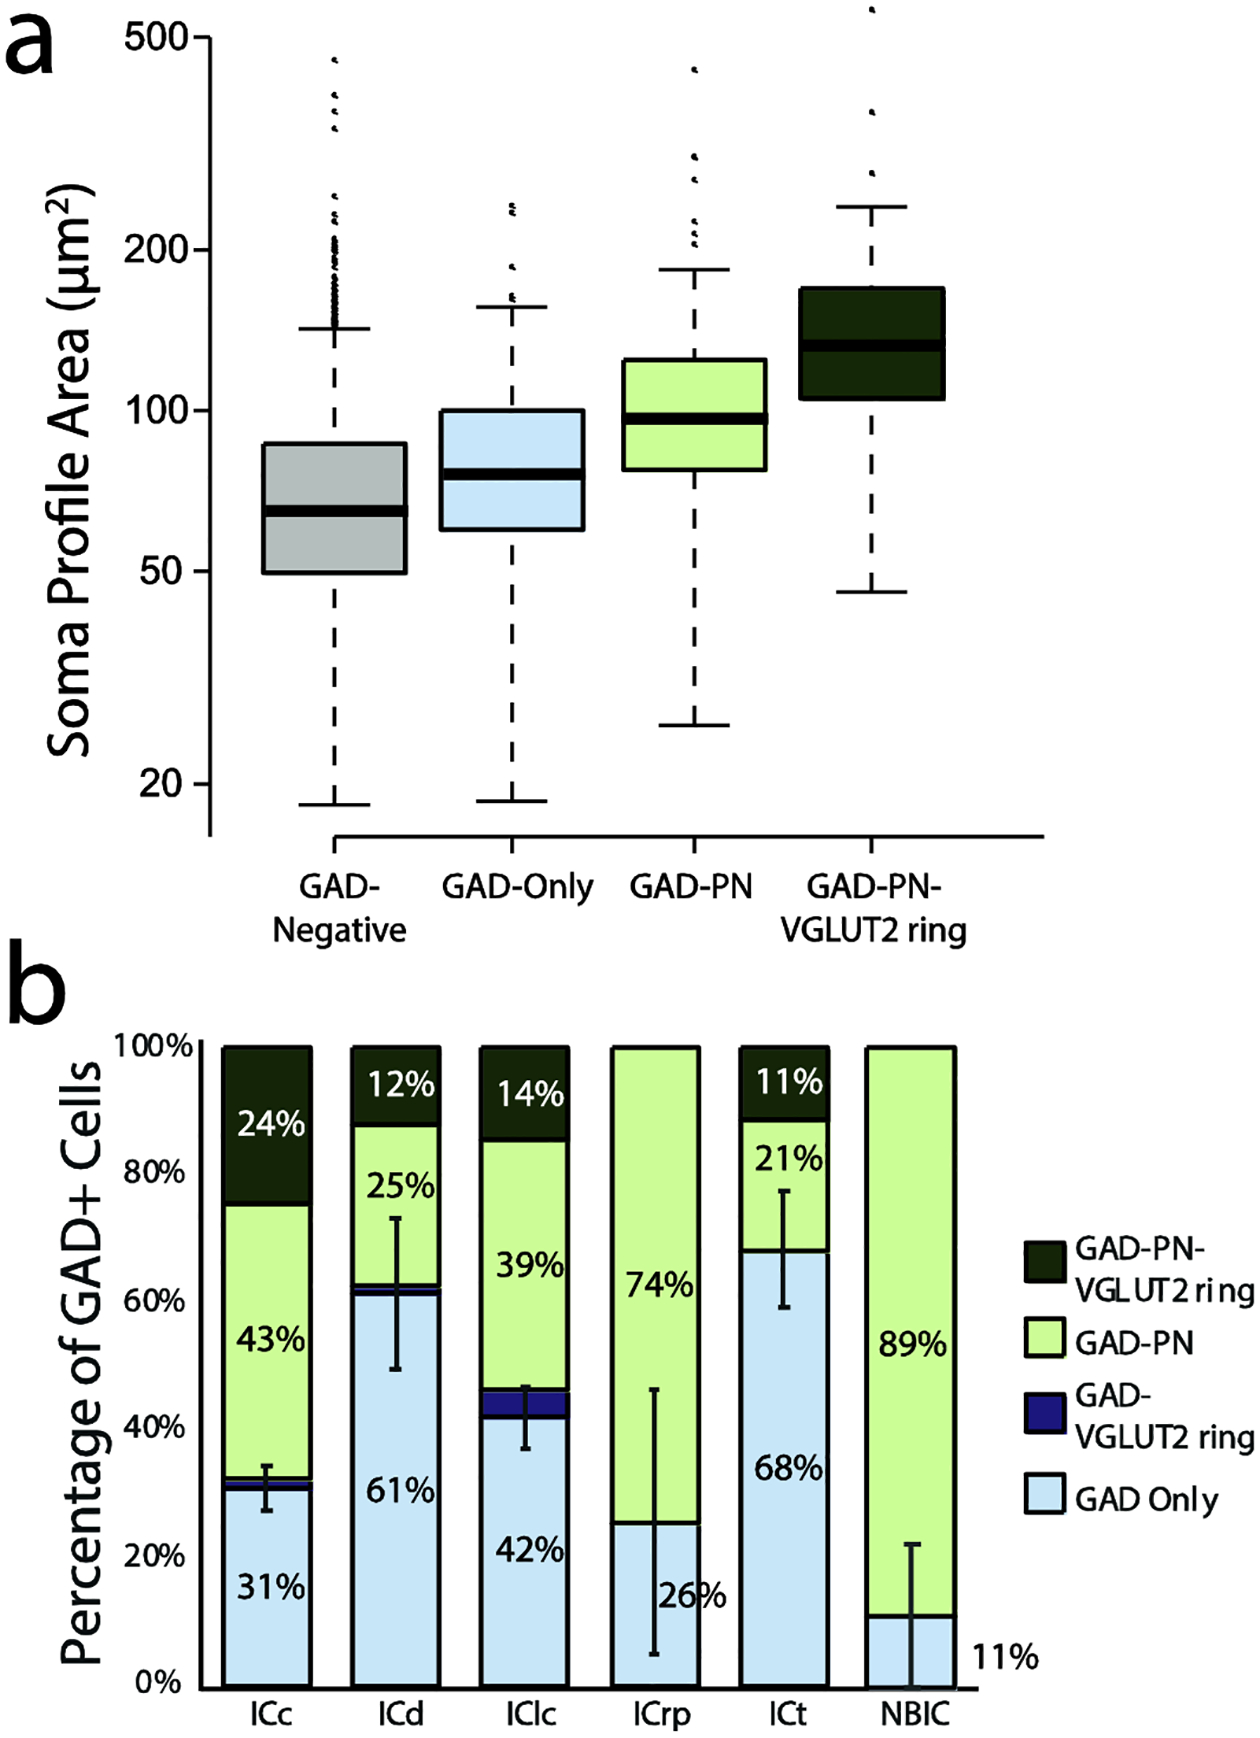
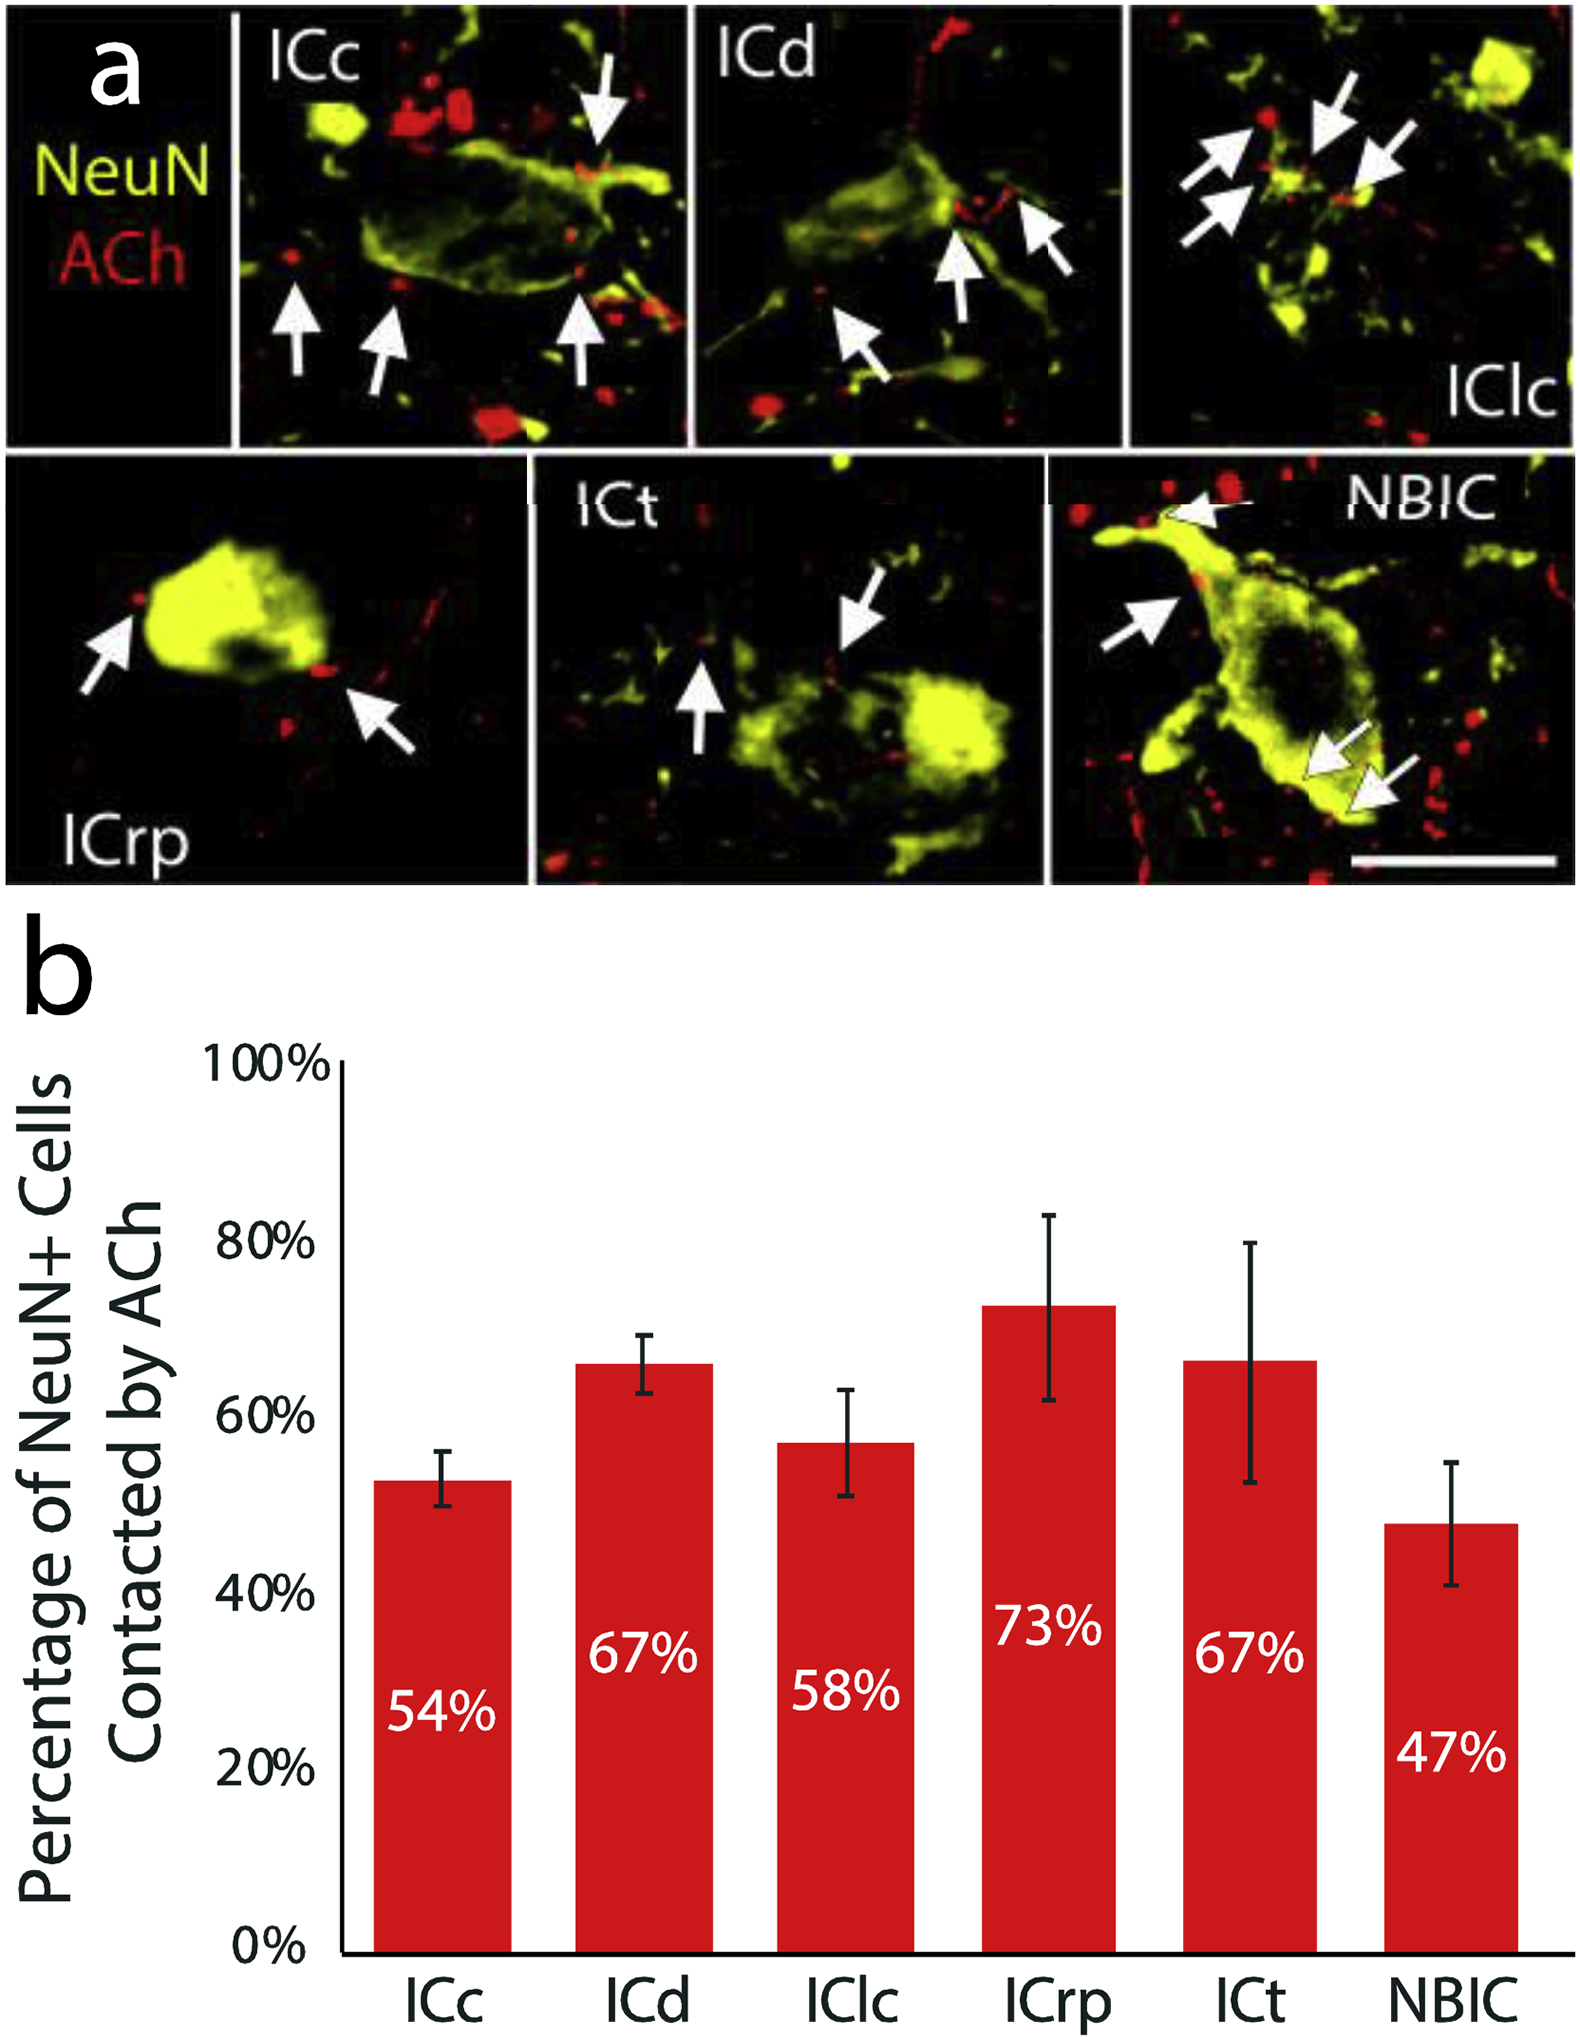
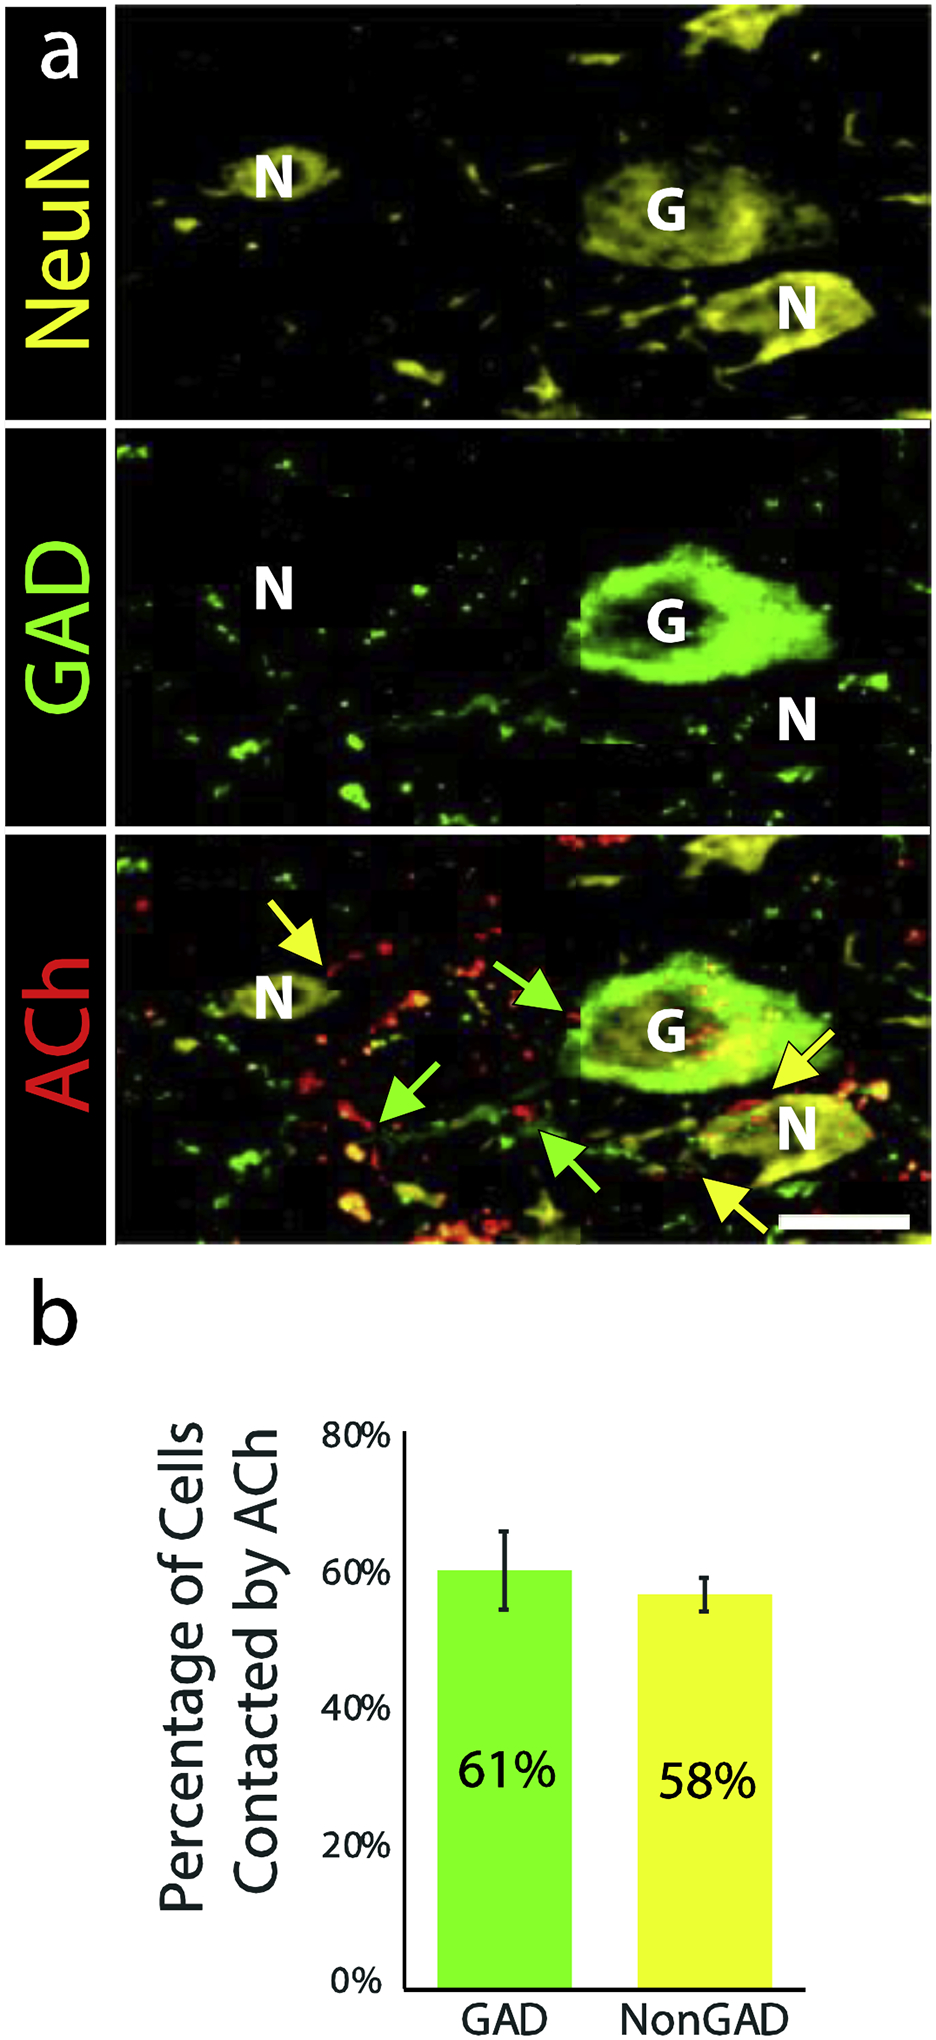
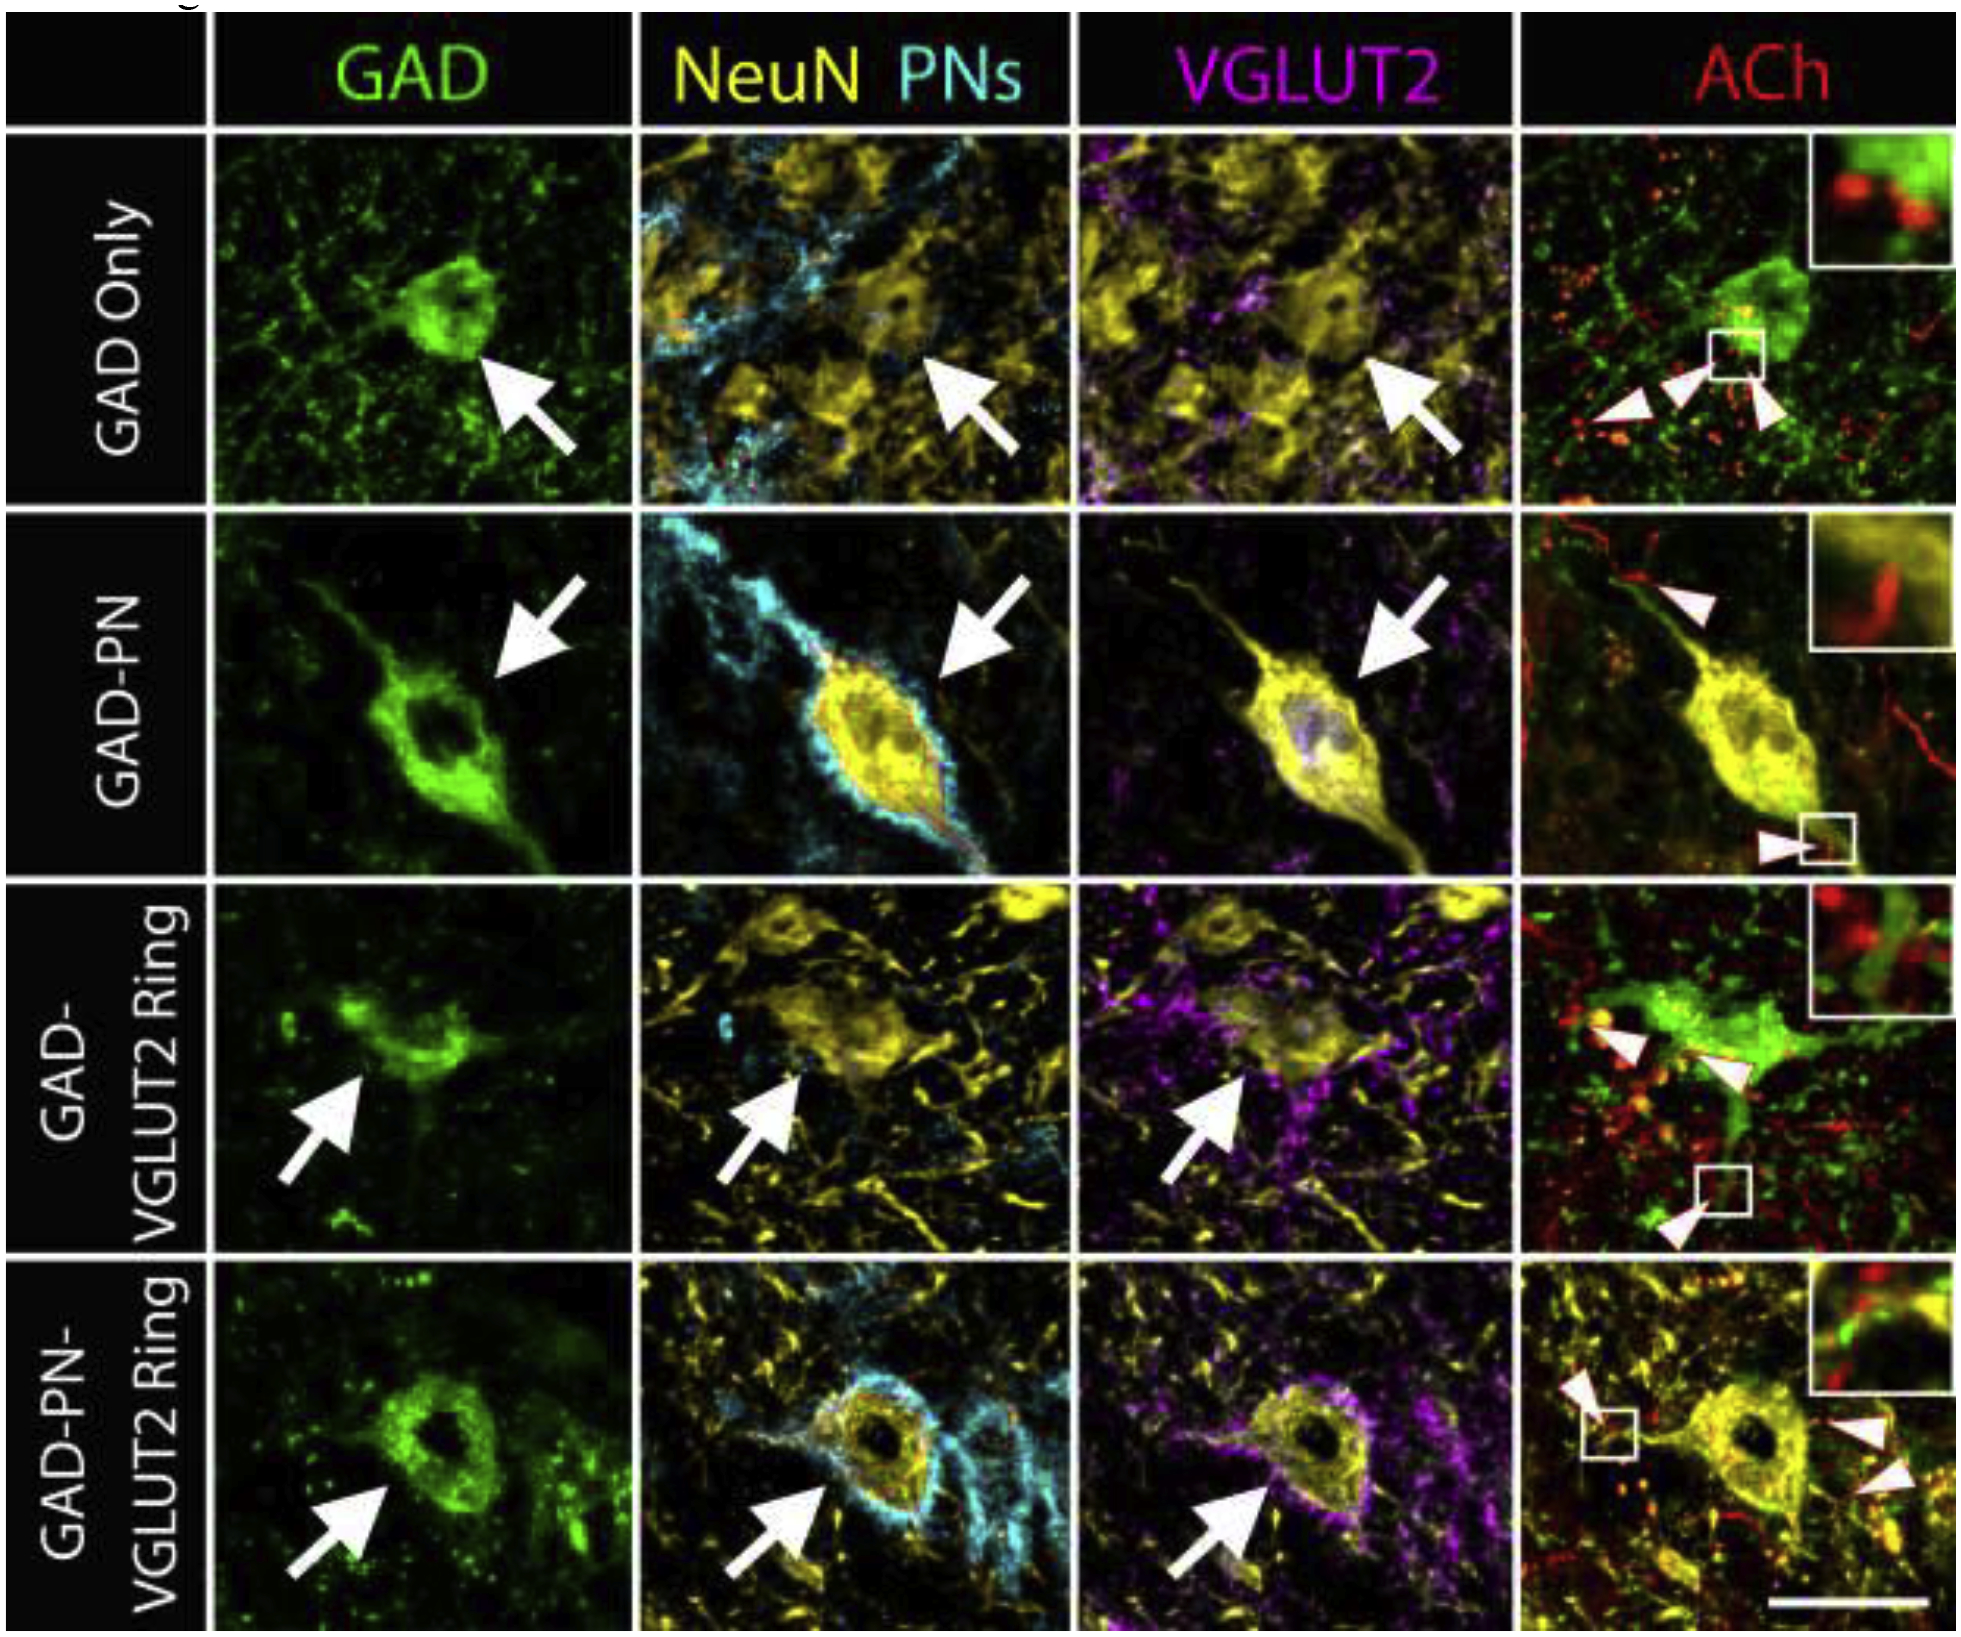
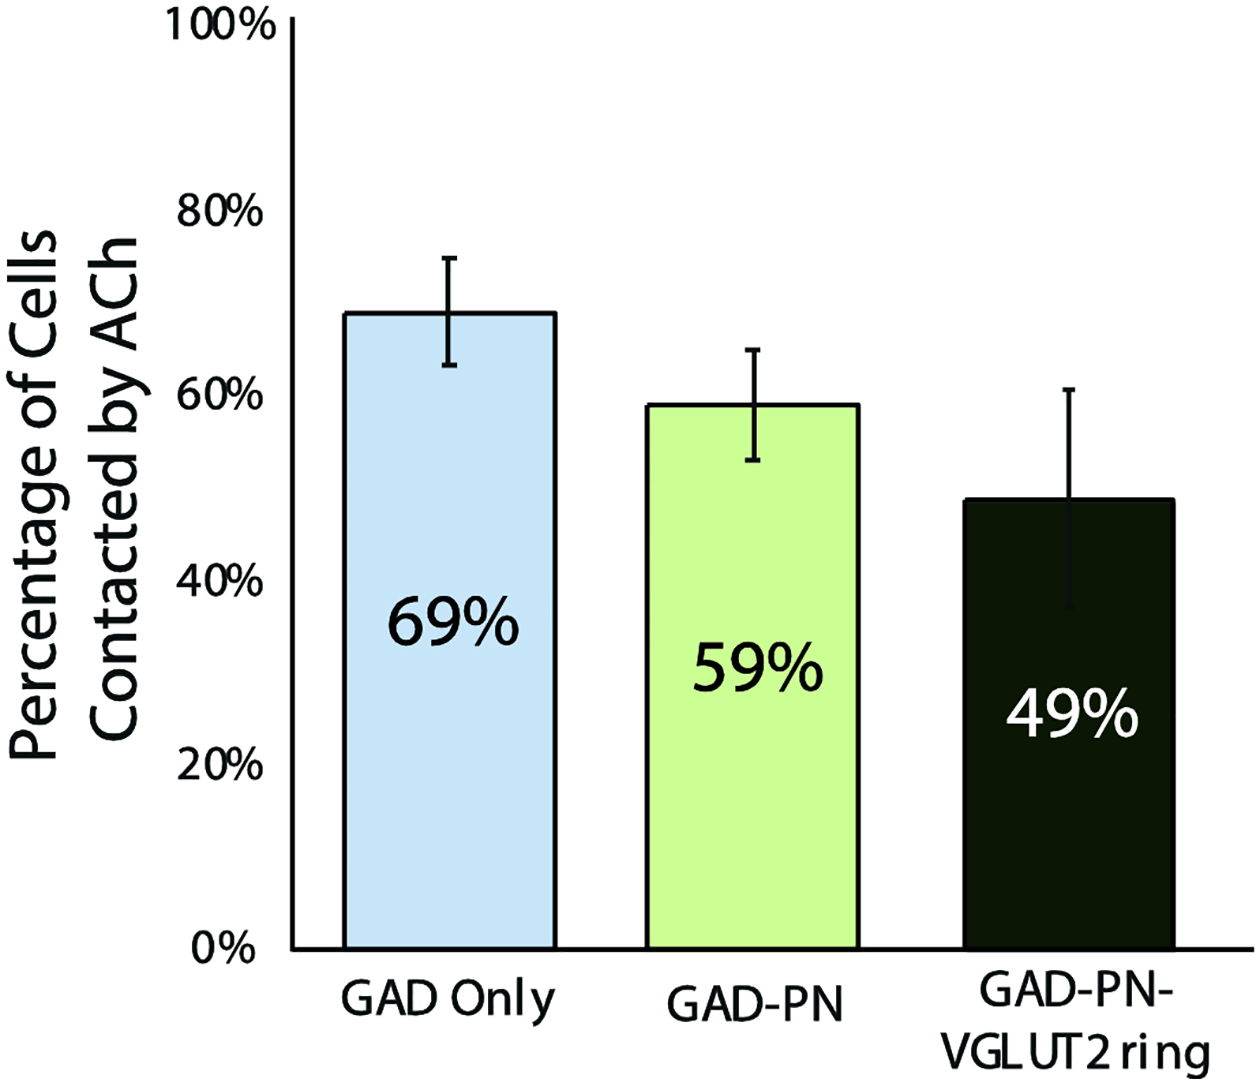
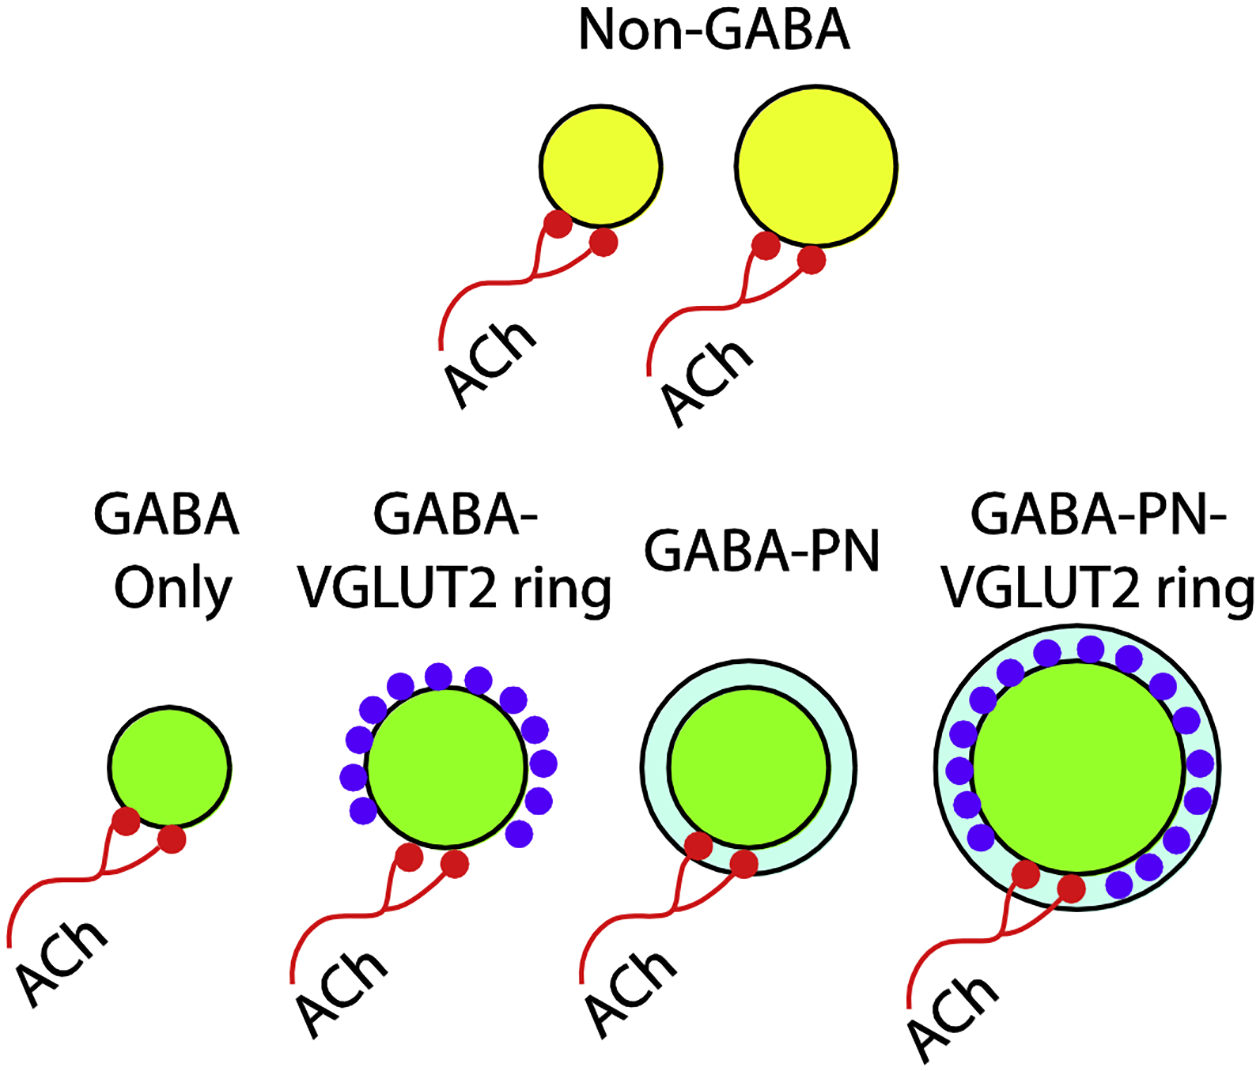
Acetylcholine (ACh) is a neuromodulator that has been implicated in multiple roles across the brain, including the central auditory system, where it sets neuronal excitability and gain and affects plasticity. In the cerebral cortex, subtypes of GABAergic interneurons are modulated by ACh in a subtype-specific manner. Subtypes of GABAergic neurons have also begun to be described in the inferior colliculus (IC), a midbrain hub of the auditory system. Here, we used male and female mice (Mus musculus) that express fluorescent protein in cholinergic cells, axons, and boutons to look at the association between ACh and four subtypes of GABAergic IC cells that differ in their associations with extracellular markers, their soma sizes, and their distribution within the IC. We found that most IC cells, including excitatory and inhibitory cells, have cholinergic boutons closely associated with their somas and proximal dendrites. We also found that similar proportions of each of four subtypes of GABAergic cells are closely associated with cholinergic boutons. Whether the different types of GABAergic cells in the IC are differentially regulated remains unclear, as the response of cells to ACh is dependent on which types of ACh receptors are present. Additionally, this study confirms the presence of these four subtypes of GABAergic cells in the mouse IC, as they had previously been identified only in guinea pigs. These results suggest that cholinergic projections to the IC modulate auditory processing via direct effects on a multitude of inhibitory circuits.

Keywords: Acetylcholine; Mouse; Perineuronal net; VGLUT2.


Conflict of interest statement

Declaration of Interest

None.

Figures

Figure 1.
Figure 1.. Examples of boutons in close apposition to an IC neuron
A z-stack image of a NeuN/Neurochrom-labeled neuron in the IClc (yellow), with ACh boutons (red) that are in close apposition (arrows) or not in close apposition (arrowheads) shown in three planes. The X plane is indicated by a green line, the Y plane is indicated by a red line, and the Z plane is indicated by a blue line. The XY image shows three red boutons in the vicinity of the labeled neuron. Rotation of the image stack to view YZ and XZ perspectives shows that the two ACh boutons indicated with arrows are in the same focal plane as the neuron and would be considered in close apposition with the neuron. The arrowhead-labeled bouton might be in contact with the neuron but the resolution in the Z-plane is not high enough to make this determination. Boutons like this were not classified as a “close apposition” even though such a conservative view likely lead us to underestimate the number of contacts.
Figure 2.
Figure 2.. Four subtypes of GAD+ cells are present in the mouse IC.
Photomicrographs show GAD+ cells (green, first column) in the mouse IC and their association with PNs (cyan, second column) and rings of axosomatic VGLUT2+ terminals (VGLUT2 rings, magenta, third column). Cells were confirmed to be neurons with cocktail staining for NeuN and Neuro-Chrom (‘NeuN’, yellow, second and third columns). GAD+ cells could lack a PN and a VGLUT2 ring (GAD Only, white arrows, top row), could be associated with a PN, but no VGLUT2 ring (GAD-PN, white arrows, second row), could be associated with a VGLUT2 ring but not a PN (GAD-VGLUT2 ring, white arrow, third row), or could be associated with both a PN and a VGLUT2 ring (GAD-PN-VGLUT2 ring, white arrow, bottom row). Scale bar = 20 μm.
Figure 3.
Figure 3.. Subtypes of GAD+ cells differ in their average soma size and distribution across regions.
A. A boxplot depicting the median and range of soma profile areas for GAD-negative cells (gray), GAD Only cells (light blue), GAD-PN cells (light green), and GAD-PN-VGLUT2 ring cells (dark green). GAD-VGLUT2 ring cells were excluded from this analysis due to their low numbers (only four cells were observed across all regions and cases). GAD Only cells tended to have the smallest soma sizes, while GAD-PN-VGLUT2 ring cells tended to have the largest soma sizes. Note that the y-axis is logarithmic. n = 2273 neurons across three cases. B. A bar graph depicting the GAD+ population in each IC subdivision and intercollicular region analyzed. The GAD Only proportion is depicted in light blue, the GAD-VGLUT2 ring proportion is depicted in dark blue, the GAD-PN proportion is depicted in light green, and the GAD-PNN-VGLUT2 ring proportion is depicted in dark green. Error bars = SEM of the GAD Only population. n = 97 GAD Only cells, 106 GAD-PN cells, 4 GAD-VGLUT2 ring, and 45 GAD-PN-VGLUT2 ring cells across three cases.
Figure 4.
Figure 4.. ACh axons form presumptive contacts on neurons across the IC and intercollicular regions.
A. Photomicrographs show neurons stained with an anti-NeuN/Neuro-Chrom cocktail (‘NeuN’, yellow). Axons filled with tdTomato (cholinergic axons, ACh, red) form presumptive contacts (arrows) with neurons in each region examined. Scale bar = 10 μm. B. A bar graph shows the proportion of all NeuN+ neurons in the sample that receive presumptive cholinergic contacts in each area. There was no significant difference in the proportion of neurons associated with cholinergic contacts. Error bars = SEM.
Figure 5.
Figure 5.. ACh axons form presumptive contacts with both GAD+ and GAD-negative neurons.
A. Yellow fluorescence (NeuN/Neuro-Chrom) shows 3 neurons. Staining with anti-GAD (green, middle panel) shows that one neuron is GAD+ (“G”) while the other two are GAD-negative (“N”). Both neurotransmitter types receive presumptive contacts from tdTomato-labeled cholinergic axons (red, highlighted with yellow arrows on GAD-negative cells and green arrows on the GAD+ cell). Scale bar = 10 μm. B. A bar graph shows the proportions of GAD+ (green) and GAD-negative (yellow) neurons that received presumptive contact from cholinergic axons. There was no clear difference between the two types of cells. Error bars = SEM. n = 254 GAD+ and 2019 GAD-negative cells across three cases.
Figure 6.
Figure 6.. ACh axons form presumptive contacts with all four subtypes of GAD+ cells.
Photomicrographs show examples of each of the four subtypes of GAD+ cells (large arrows). In each example, tdTomato-filled cholinergic axons (red) make presumptive contacts with the soma or dendrites of the cells (arrowheads in the last column). Insets show enlargements of selected contacts (white boxes). Scale bar = 20 μm.
Figure 7.
Figure 7.. The subtypes of GAD+ cell are contacted in similar proportions.
A bar graph shows the proportion of the three prominent GAD+ subtypes that received presumptive contact from cholinergic axons. Error bars = SEM. n = 97 GAD Only cells, 106 GAD-PN cells, and 45 GAD-PN-VGLUT2 ring cells across three cases. Note that the GAD-VGLUT2 ring group is excluded from the graph because of the small number of such cells (4 in the sample). Despite the small number, two of these cells appeared to be contacted by cholinergic axons.
Figure 8.
Figure 8.. Summary
A schematic diagram depicting cell populations in the mouse IC. Non-GABAergic cells (yellow) and GABAergic cells (green) both receive input from cholinergic axons (red). All four subtypes of GABAergic cells are contacted, including those surrounded by PNs (light blue) and those surrounded by rings of axosomatic VGLUT2+ terminals (purple).

References

    1. Andrezik JA, Chan-Palay V, Palay SL, 1981. The nucleus paragigantocellularis lateralis in the rat. Demonstration of afferents by the retrograde transport of horseradish peroxidase. Anat Embryol (Berl) 161, 373–90. - PubMed
    1. Appell PP, & Behan M (1990). Sources of subcortical GABAergic projections to the superior colliculus in the cat. The Journal of Comparative Neurology, 302, 143–158. doi: 10.1002/cne.903020111 - DOI - PubMed
    1. Arimatsu Y, Seto A, & Amano T (1978). Localization of α-bungarotoxin binding sites in mouse brain by light and electron microscopic autoradiography. Brain Research, 147, 165–169. doi: 10.1016/0006-8993(78)90782-5 - DOI - PubMed
    1. Atoji Y, Yamamoto Y, Suzuki Y, Matsui F, & Oohira A (1997). Immunohistochemical localization of neurocan in the lower auditory nuclei of the dog. Hearing Research, 110, 200–208. doi: 10.1016/S0378-5955(97)00079-8 - DOI - PubMed
    1. Ayala YA, & Malmierca MS (2015). Cholinergic Modulation of Stimulus-Specific Adaptation in the Inferior Colliculus. Journal of Neuroscience, 35, 12261–12272. doi: 10.1523/JNEUROSCI.0909-15.2015 - DOI - PMC - PubMed

Publication types

Substances

LinkOut - more resources