. 2021;43(2):116-133.
doi: 10.1159/000516667. Epub 2021 Jun 29.

Identifying Dyslexia: Link between Maze Learning and Dyslexia Susceptibility Gene, DCDC2, in Young Children

Affiliations

Identifying Dyslexia: Link between Maze Learning and Dyslexia Susceptibility Gene, DCDC2, in Young Children

Lisa A Gabel et al. Dev Neurosci. 2021.

Abstract

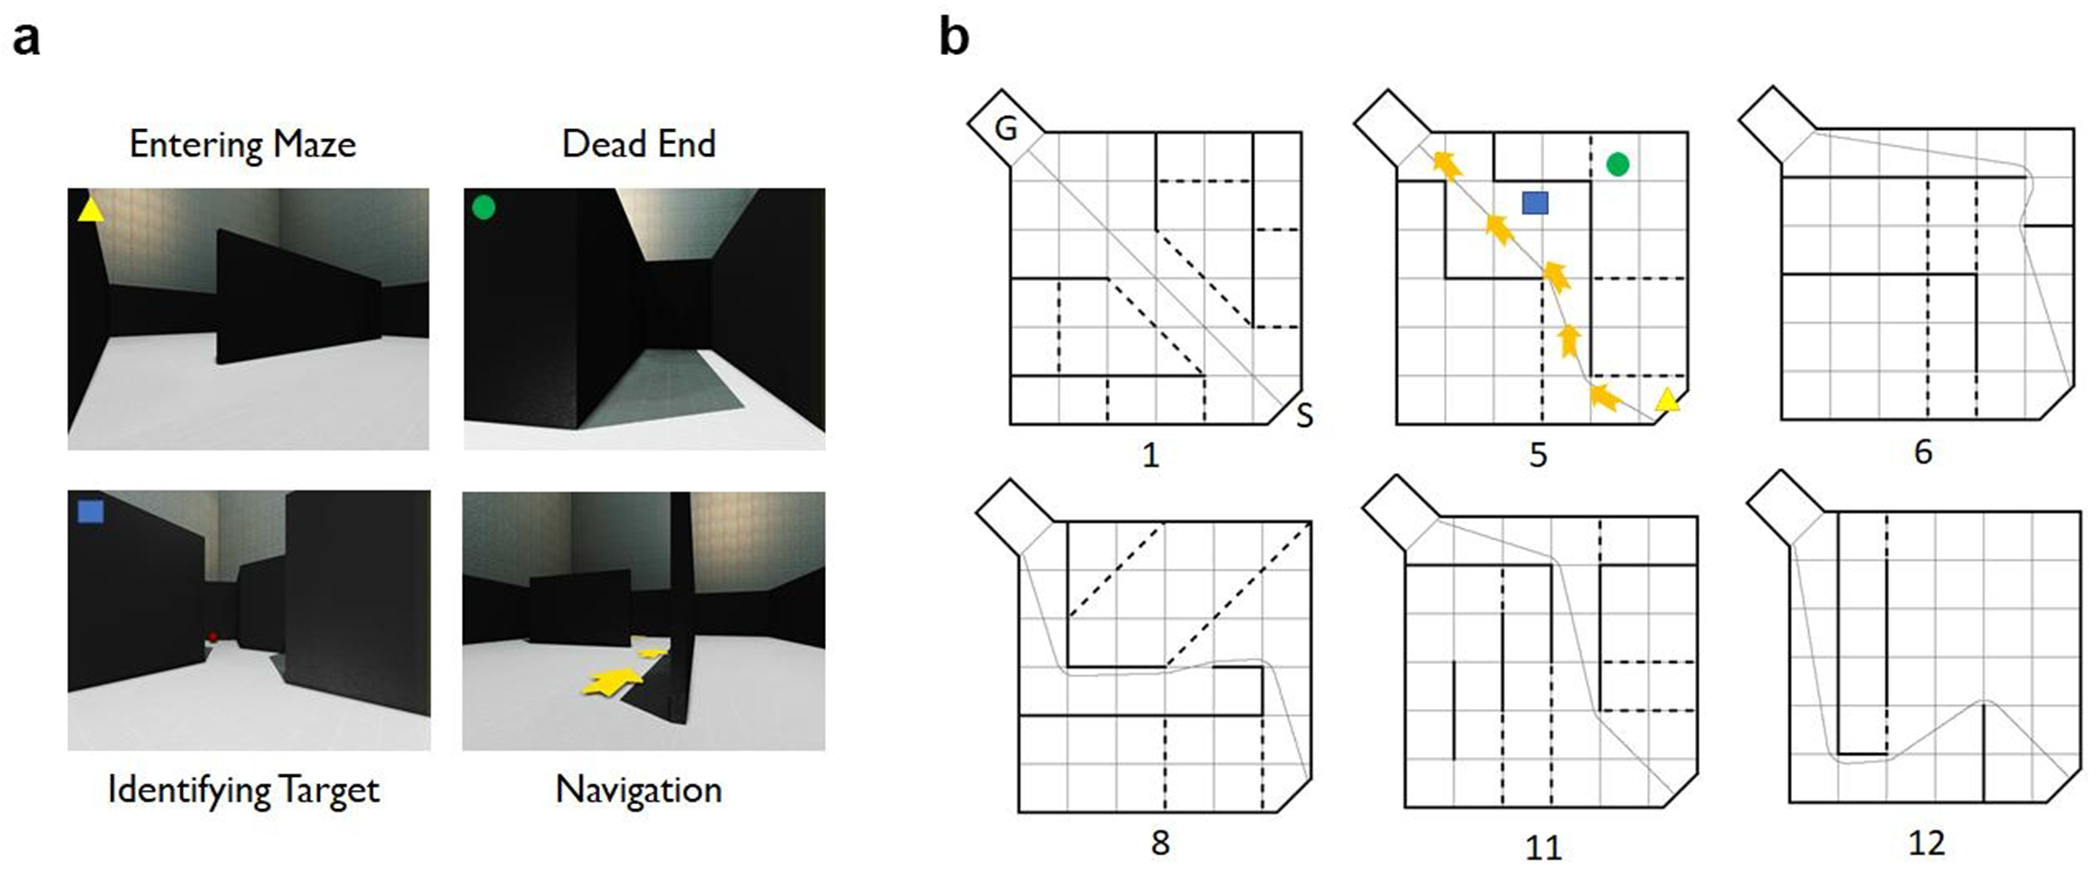
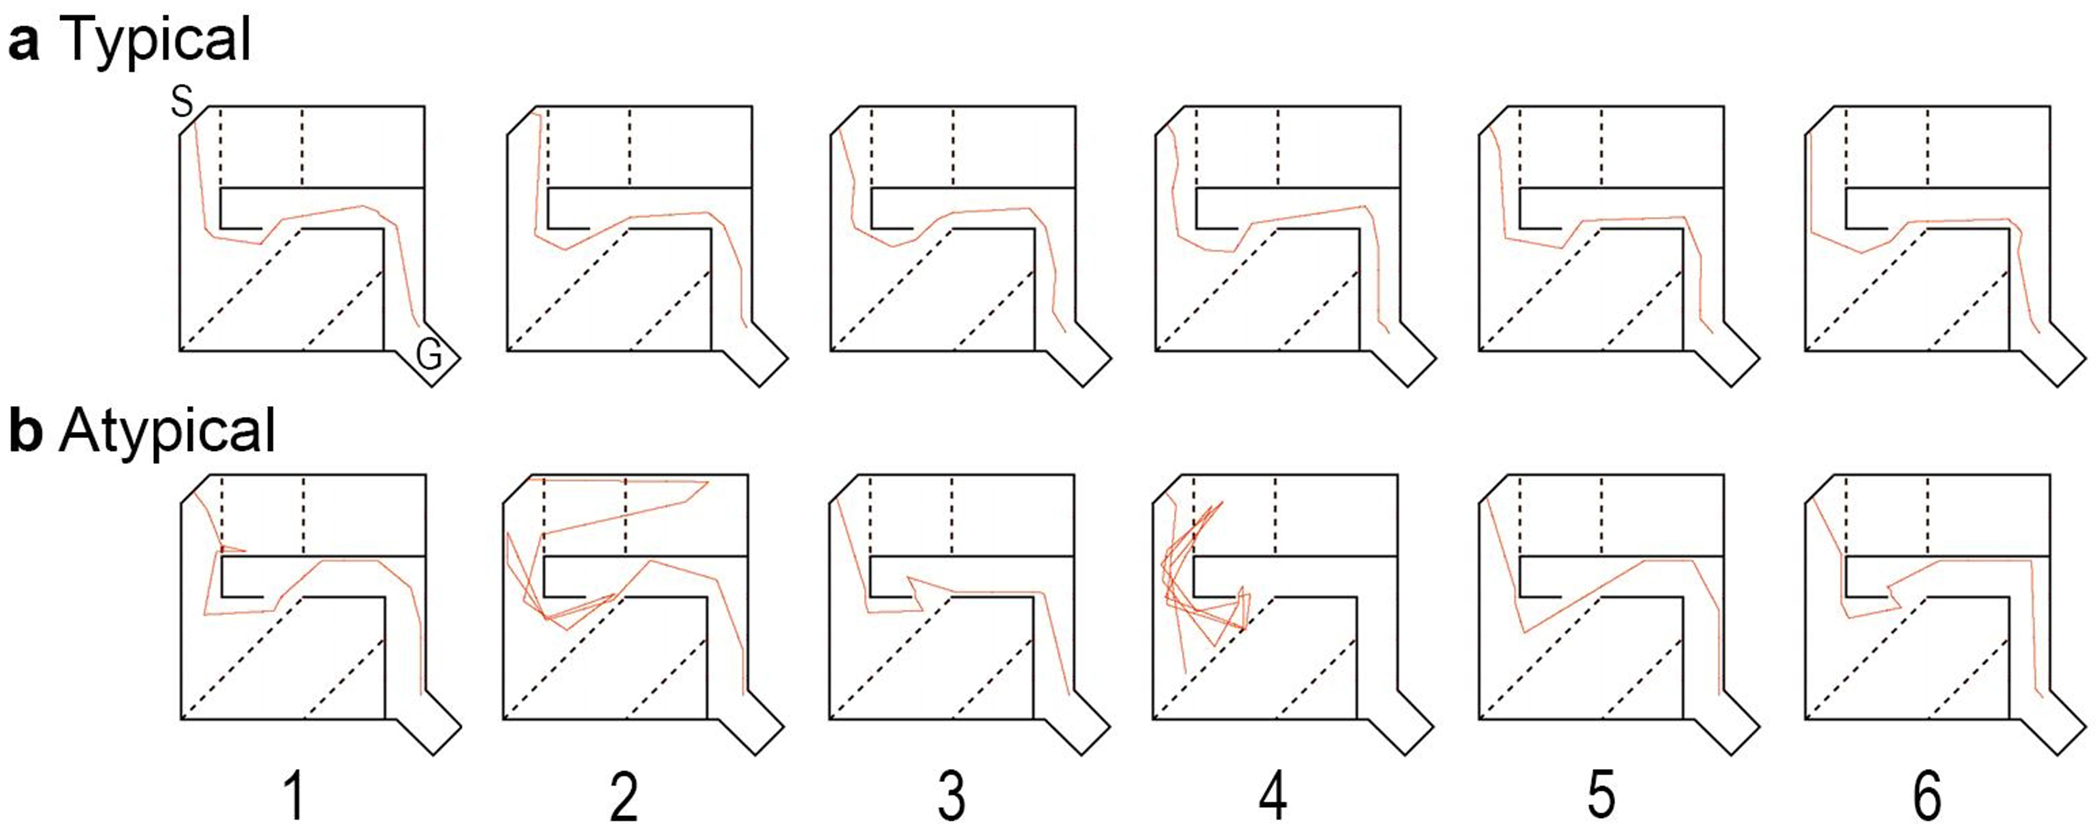
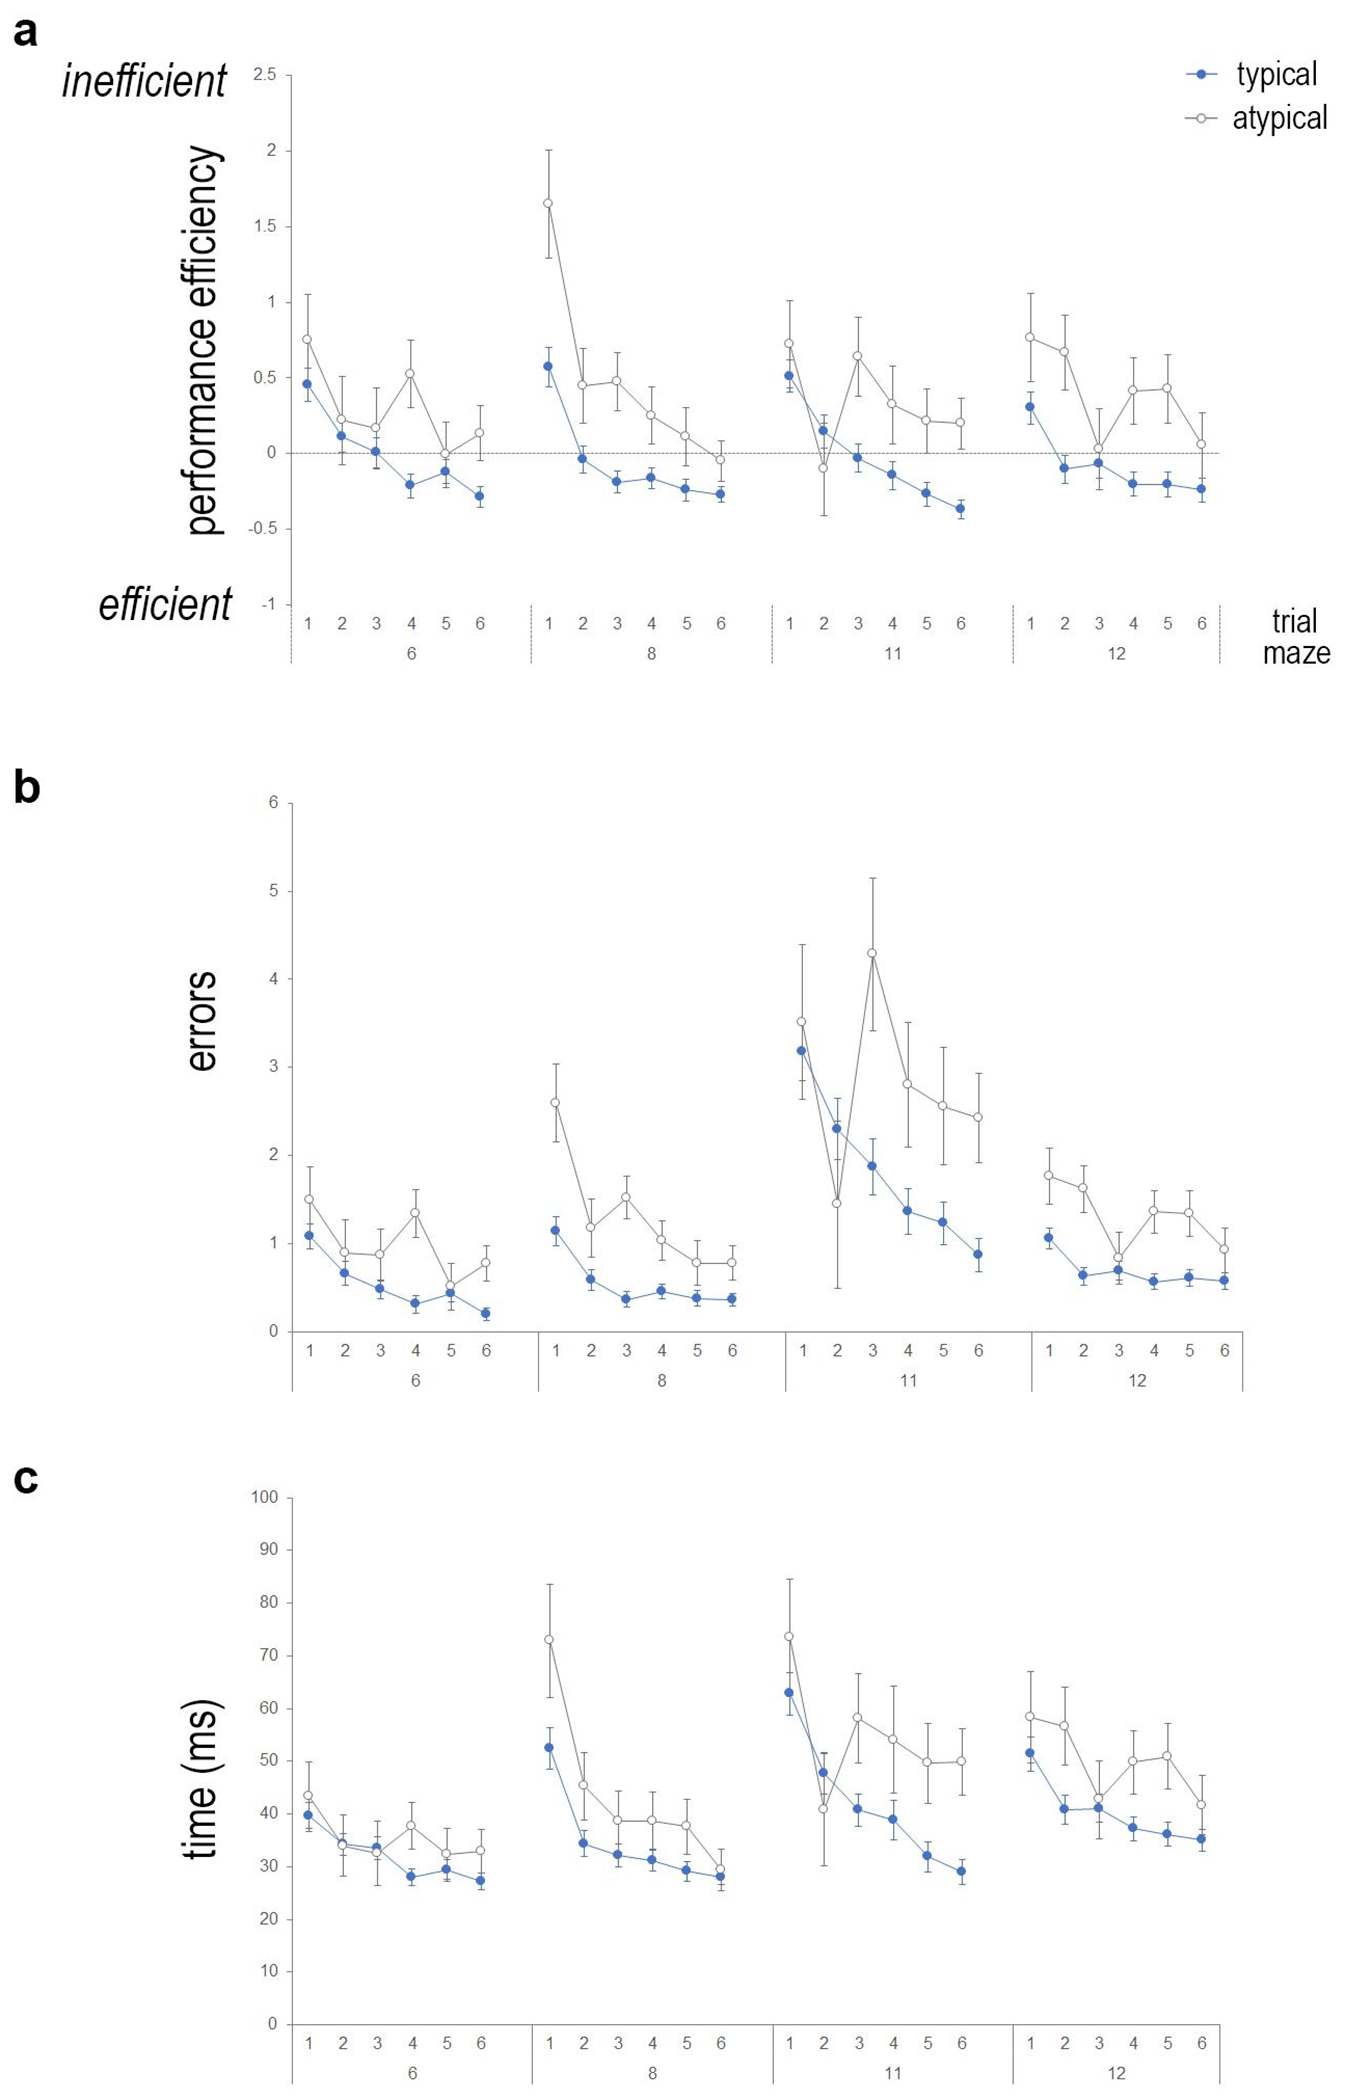
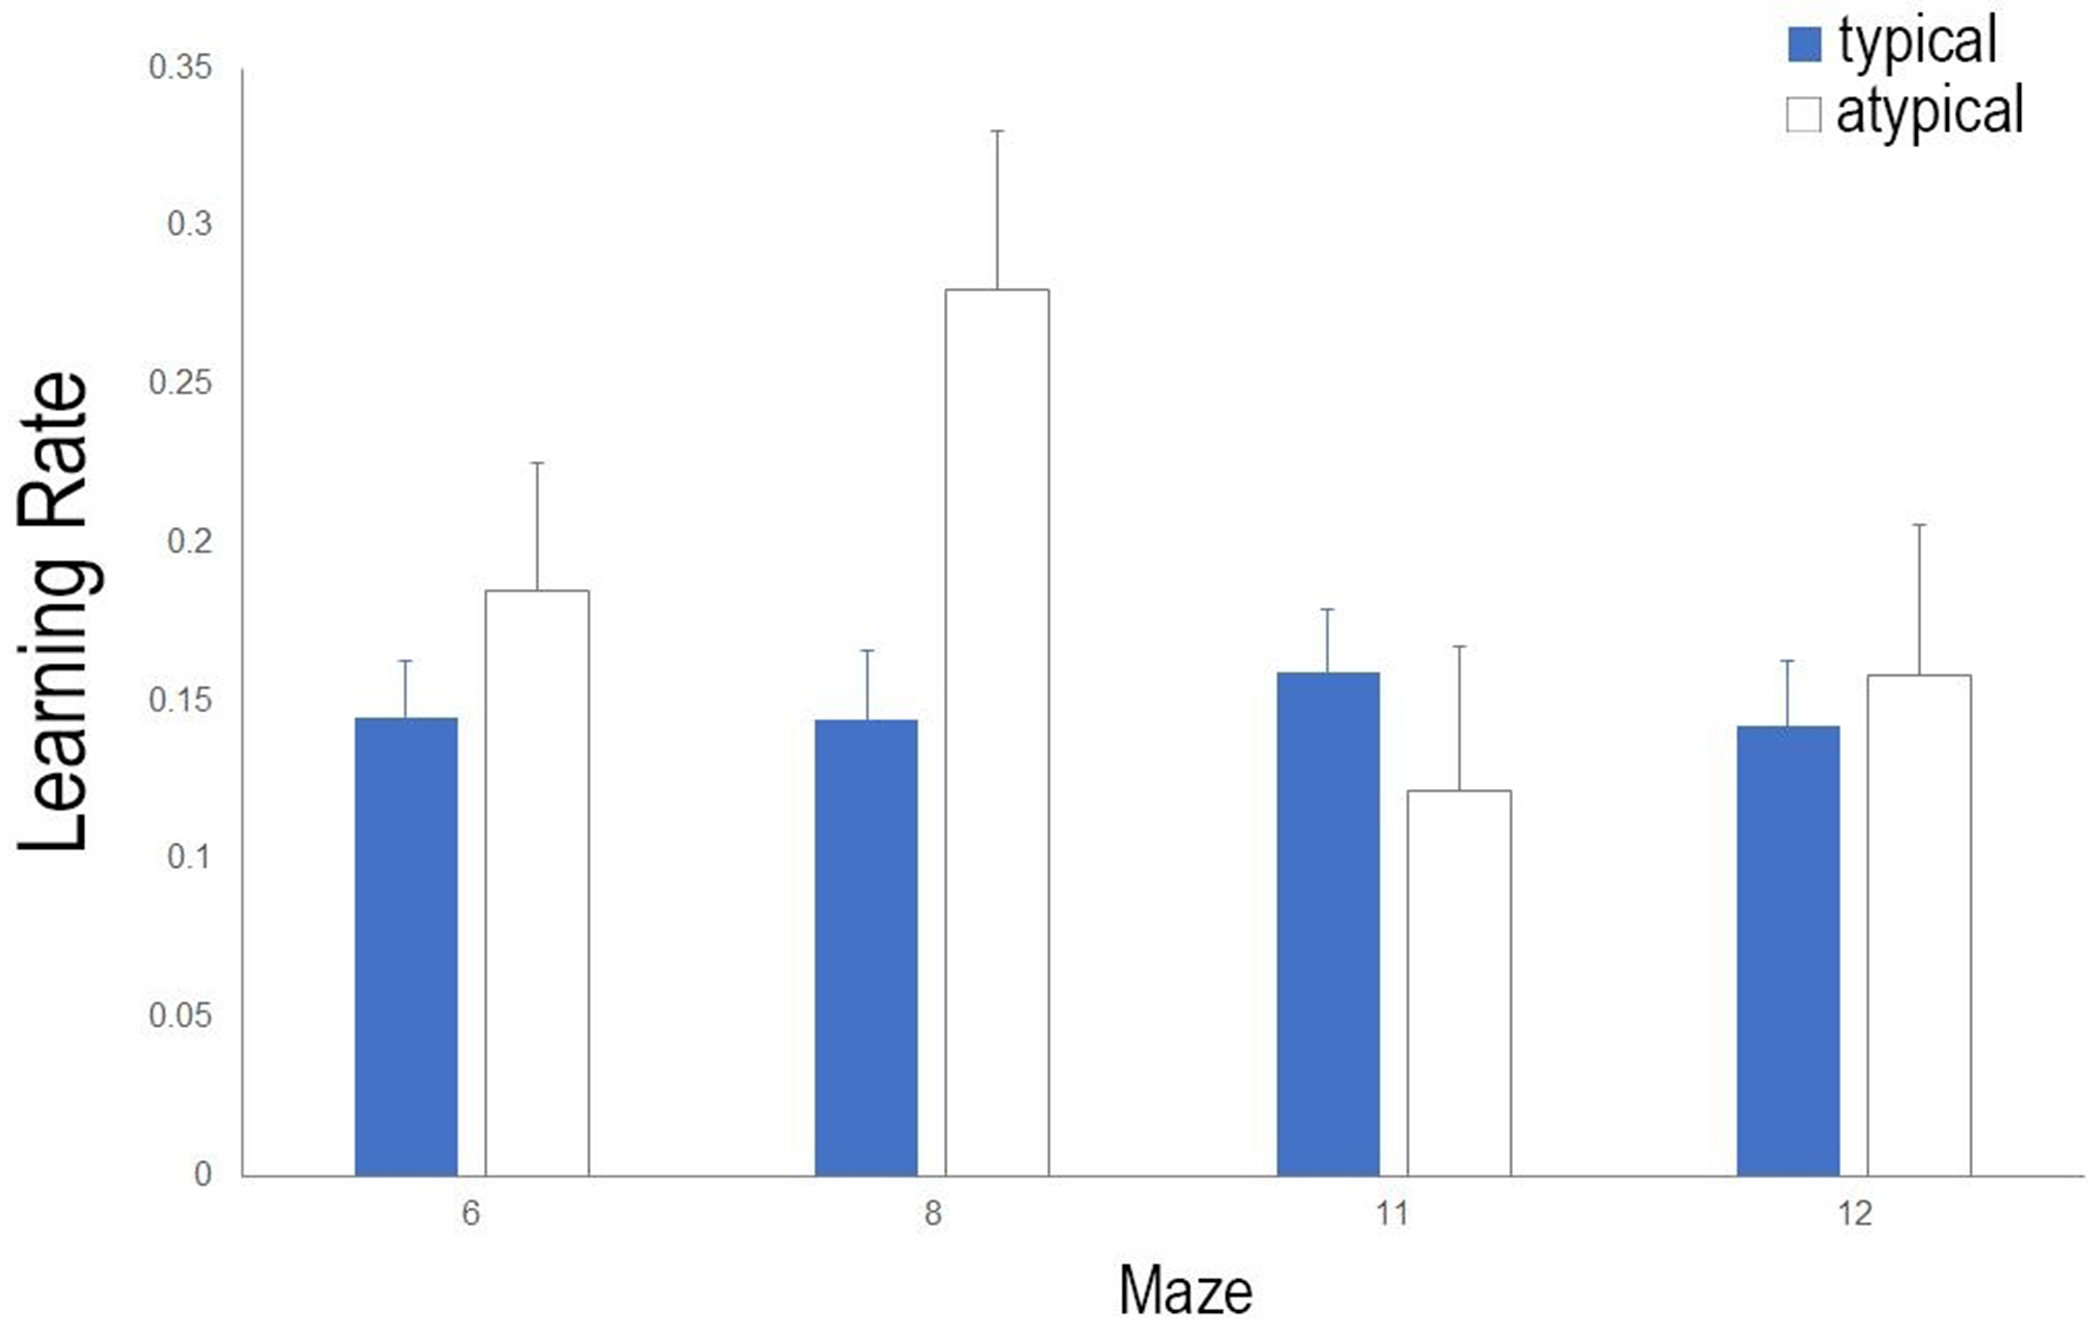
Dyslexia is a common learning disability that affects processing of written language despite adequate intelligence and educational background. If learning disabilities remain untreated, a child may experience long-term social and emotional problems, which influence future success in all aspects of their life. Dyslexia has a 60% heritability rate, and genetic studies have identified multiple dyslexia susceptibility genes (DSGs). DSGs, such as DCDC2, are consistently associated with the risk and severity of reading disability (RD). Altered neural connectivity within temporoparietal regions of the brain is associated with specific variants of DSGs in individuals with RD. Genetically altering DSG expression in mice results in visual and auditory processing deficits as well as neurophysiological and neuroanatomical disruptions. Previously, we demonstrated that learning deficits associated with RD can be translated across species using virtual environments. In this 2-year longitudinal study, we demonstrate that performance on a virtual Hebb-Williams maze in pre-readers is able to predict future reading impairment, and the genetic risk strengthens, but is not dependent on, this relationship. Due to the lack of oral reporting and use of letters, this easy-to-use tool may be particularly valuable in a remote working environment as well as working with vulnerable populations such as English language learners.

Keywords: Early identification; READ1; Reading disorder; Translational research; Virtual maze.


Conflict of interest statement

Conflict of Interest Statement

Dr. Lisa A. Gabel has a US patent pending (US patent Apl. No. 15/934,567) for the use of the virtual Hebb-Williams maze as a tool for the early identification of dyslexia.

Figures

Fig. 1.
Fig. 1.
Hebb-Williams maze configurations and virtual platform. (a) Scenes from maze 5 on the virtual platform, including entering the maze, reaching a dead end, visualizing the target, and the appearance of arrows which occurs if the target is not reached in 120 seconds. (b) Line drawings of the mazes used for training (Mazes 1 and 5) and testing (Mazes 6, 8, 11, and 12). The goal box containing the target (i.e. red ball) is identified by the letter “G” and the start position is identified by the letter “S”. The number listed below the drawing indicates the Hebb-Williams maze configuration. The solid black lines represent walls in the maze, the black dotted lines represent error zones, which are not visible to participants, and the grey trace is the true path between the start and the goal box. The specific position of the avatar in the scenes from maze 5 (left) are represented by specific points in the schematic of maze 5 (triangle, entering the maze; circle, dead end; square, identifying the target; arrows, true path revealed once 120 s has elapsed).
Fig. 2.
Fig. 2.
Children with reading impairment show difficulty maintaining a true path to solve the maze task. Representative traces of paths (shown in red) taken by (a) typical and (b) atypical readers while solving Maze 8. The goal box (G) and the starting position (S) are indicated on the schematic. The solid black lines represent walls in the maze, the black dotted lines represent error zones, which are not visible to participants Children with reading impairment (atypical) experienced difficulty identifying and maintaining the correct path to the target within the goal box of the maze. For example, in trial 4 you can see that the participant was unable to find the goal box within 120 s despite having successfully found the target in the previous trials. This is in contrast to a typical reader who is able to identify the true (i.e. correct path) in the first trial, and to repeat the behavior on subsequent trials.
Fig. 3.
Fig. 3.
Young children with reading impairment exhibit impairment performance on the virtual maze learning task. (a) Performance efficiency is plotted for all mazes completed (Mazes 6, 8, 11, 12) during testing, across six consecutive trials for typical (blue closed circles) and atypical (grey open circles) readers. Positive performance efficiency values indicate inefficient performance, whereas negative values show greater efficiency compared to the mean performance (Mean performance = 0). Young children who struggle with reading (atypical) exhibit impaired performance across trials. Typical readers exhibit linear learning curves and improved performance across trials, whereas struggling readers exhibit a greater degree of variability across the consecutive trials for each maze task. Performance efficiency is calculated by equally weighting standardized values (z-scores) for (b) errors committed during the completion of the maze task and (c) time to complete the maze.
Fig. 4.
Fig. 4.
Learning rate among children with reading impairment show a greater degree of variability across mazes. Mean learning rate and standard error for typical and atypical readers is plotted against mazes 6, 8, 11, and 12. Learning rate is calculated by taking the average difference in performance efficiency scores across trials. A larger value indicates a greater rate of learning (i.e. steeper learning curve) across trials. Typical readers show a consistent learning rate across mazes, whereas the learning rate is variable across mazes for children with reading impairment (atypical).
Fig. 5.
Fig. 5.
Genetic risk for dyslexia is associated with greater impairment on the maze task. (a) Performance efficiency is plotted for all mazes completed (Mazes 6, 8, 11, 12) during testing, across six consecutive trials for typical (blue) and atypical (grey) readers based on genetic risk (unknown risk [solid lines], and genetic risk [dotted lines]). Children with reading impairment (atypical) exhibit impaired performance across trials, which is exacerbated by known genetic risk. Genetic risk is defined as 2.4 kb microdeletion in intron 2 of DCDC2, READ1 risk allele 5, and or biological risk based on the adult reading history questionnaire from one, or both, biological parents. Positive performance efficiency values indicate inefficient performance, whereas negative values show greater efficiency compared to the mean performance (Mean performance = 0). Performance efficiency is calculated by equally weighting standardized values (z-scores) for (b) errors committed during the completion of the maze task and (c) time to complete the maze.
Fig. 6.
Fig. 6.
Schematic of Hebb-Williams mazes 1, 6, 8 and 9. The goal box containing the target (i.e. red ball) is identified by the letter “G” and the start position is identified by the letter “S”. The number listed below the drawing indicates the Hebb-Williams maze configuration. The solid black lines represent walls in the maze, the black dotted lines represent error zones, which are not visible to participants, and the grey trace is the true path between the start and the goal box.
Fig. 7.
Fig. 7.
Children with reading impairment show difficulty maintaining a true path to solve the maze task. (a) Representative traces of paths (shown in red) taken by typical (top) and atypical (bottom) readers while solving Maze 8, a task they were introduced to two years prior. The goal box (G) and the starting position (S) are indicated on the schematic. The solid black lines represent walls in the maze, the black dotted lines represent error zones, which are not visible to participants Children with reading impairment (atypical) experienced difficulty identifying and maintaining the correct path to the target within the goal box of the maze. (b) Representative traces of paths taken by typical (top) and atypical (bottom) readers while solving Maze 9, a task they had no prior experience solving. Children with reading impairment exhibited a greater degree of difficulty identifying and maintaining the correct path to the target within the goal box of the maze. It is important to note that the examples in this figure are from the same participant whose traces are represented in Figure 2. A direct comparison in performance on Maze 8 can be seen between time one (Kindergarten) and time two (second grade).
Fig. 8.
Fig. 8.
Performance on the virtual maze task is stable over time. (a) Box plots of performance efficiency is shown for mazes 6 and 8 for typical and atypical readers two years after initial testing. Positive values indicate inefficient performance, whereas negative values show greater efficiency compared to the mean performance (Mean performance = 0). Children with reading impairment, continue to show inefficient performance on these maze tasks. Performance efficiency is calculated by equally weighting standardized values (z-scores) for (b) errors committed during the completion of the maze task and (c) time to complete the maze.

References

    1. Gori S, Mascheretti S, Giora E, Ronconi L, Ruffino M, Quadrelli E, et al. The DCDC2 intron 2 deletion impairs illusory motion perception unveiling the selective role of magnocellular-dorsal stream in reading (dis)ability. Cereb Cortex. 2015. June;25(6):1685–95. - PubMed
    1. Gabel LA, Gibson CJ, Gruen JR, LoTurco JJ. Progress towards a cellular neurobiology of reading disability. Neurobiol Dis. 2010. May;38(2):173–80. - PMC - PubMed
    1. Meng H, Smith S, Hager K, Held M, Liu J, Olson R, et al. DCDC2 is associated with reading disability and modulates neuronal development in the brain. Proc Natl Acad Sci U S A. 2005. November;102(47):17053–8. - PMC - PubMed
    1. Ludwig K, Schumacher J, Schulte-Körne G, König I, Warnke A, Plume E, et al. Investigation of the DCDC2 intron 2 deletion/compound short tandem repeat polymorphism in a large German dyslexia sample. Psychiatr Genet. 2008. December;18(6):310–2. - PMC - PubMed
    1. Marino C, Scifo P, Della Rosa PA, Mascheretti S, Facoetti A, Lorusso ML, et al. The DCDC2/intron 2 deletion and white matter disorganization: focus on developmental dyslexia. Cortex. 2014. August;57:227–43. - PMC - PubMed

Publication types

Substances