

Influences on catch-up growth using relative versus absolute metrics: evidence from the MAL-ED cohort study
- PMID: 34187407
- PMCID: PMC8240385
- DOI: 10.1186/s12889-021-11120-0
Influences on catch-up growth using relative versus absolute metrics: evidence from the MAL-ED cohort study
Abstract
Background: Poor growth in early childhood has been considered irreversible after 2-3 years of age and has been associated with morbidity and mortality over the short-term and with poor economic and cognitive outcomes over the long-term. The MAL-ED cohort study was performed in eight low-income settings with the goal of evaluating relationships between the child's environment and experience (dietary, illness, and pathogen exposure, among others) and their growth and development. The goal of this analysis is to determine whether there are differences in the factors associated with growth from 24 to 60 months using two different metrics.
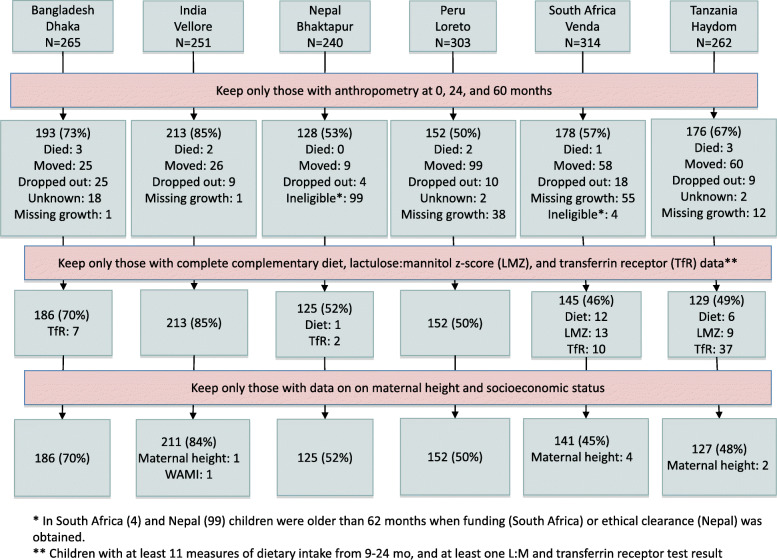
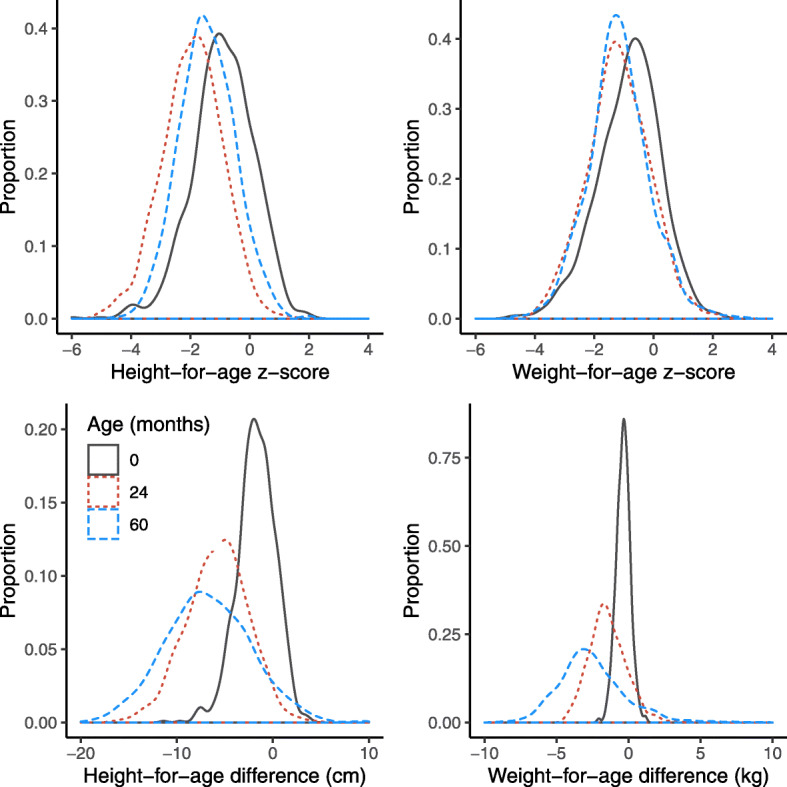
Methods: Across six MAL-ED sites, 942 children had anthropometry data at 24 and 60 months, as well as information about socioeconomic status, maternal height, gut permeability (lactulose-mannitol z-score (LMZ)), dietary intake from 9 to 24 months, and micronutrient status. Anthropometric changes were in height- or weight-for-age z-score (HAZ, WAZ), their absolute difference from the growth standard median (HAD (cm), WAD (kg)), as well as recovery from stunting/underweight. Outcomes were modeled using multivariate regression.
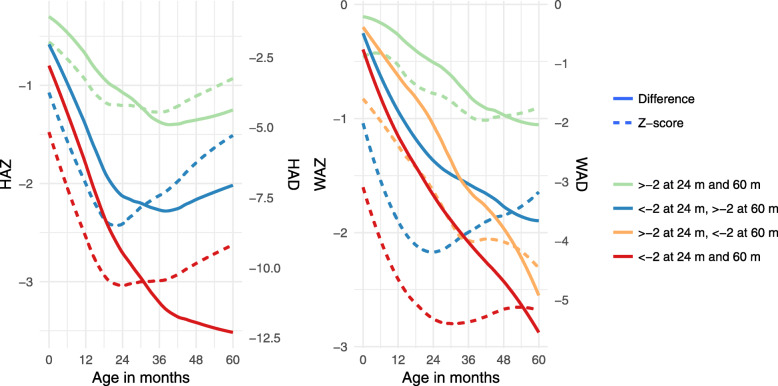
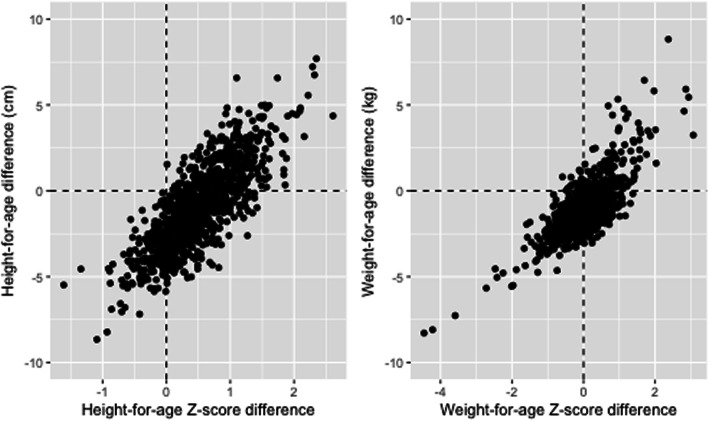
Results: At 24 months, almost half of the cohort was stunted (45%) and 21% were underweight. Among those who were stunted at 24 months (n = 426), 185 (43%) were no longer stunted at 60 months. Most children increased their HAZ from 24 to 60 months (81%), whereas fewer (33%) had positive changes in their HAD. Linear regression models indicate that girls improved less than boys from 24 to 60 months (HAZ: -0.21 (95% CI -0.27, -0.15); HAD: -0.75 (-1.07, -0.43)). Greater intestinal permeability (higher LMZ) at 0-24 months was associated with lower relative and absolute changes from 24 to 60 months (HAZ: -0.10 (-0.16, -0.04); HAD: -0.47 (-0.73, -0.21)). Maternal height (per 10 cm) was positively associated with changes (HAZ: 0.09 (0.03, 0.15); HAD: 0.45 (0.15, 0.75)). Similar relationships were identified for changes in WAZ and WAD.
Conclusions: The study children demonstrated improved growth from 24 to 60 months of age, but only a subset had positive changes in HAD and WAD. The same environmental factors were associated with growth from 24 to 60 months regardless of metric used (change in HAZ or HAD, or WAZ and WAD).
Keywords: Catch-up growth; Enteric dysfunction; Permeability; Stunting; Underweight.
Conflict of interest statement
The authors declare that they have no competing interests.
Figures
References
-
- Olofin I, McDonald CM, Ezzati M, Flaxman S, Black RE, Fawzi WW, et al. Associations of suboptimal growth with all-cause and cause-specific mortality in children under five years: a pooled analysis of ten prospective studies. PLoS One. 2013;8(5):e64636. doi: 10.1371/journal.pone.0064636. - DOI - PMC - PubMed
-
- Black MM, Walker SP, Fernald LCH, Andersen CT, DiGirolamo AM, Lu C, McCoy D, Fink G, Shawar YR, Shiffman J, Devercelli AE, Wodon QT, Vargas-Barón E, Grantham-McGregor S, Lancet Early Childhood Development Series Steering Committee Early childhood development coming of age: science through the life course. Lancet. 2017;389(10064):77–90. doi: 10.1016/S0140-6736(16)31389-7. - DOI - PMC - PubMed
Publication types
MeSH terms
Grants and funding
LinkOut - more resources
Full Text Sources
Research Materials
