

Identification of an independent immune-genes prognostic index for renal cell carcinoma
- PMID: 34187413
- PMCID: PMC8240194
- DOI: 10.1186/s12885-021-08367-6
Identification of an independent immune-genes prognostic index for renal cell carcinoma
Abstract
Background: Considerable evidence has indicated an association between the immune microenvironment and clinical outcome in ccRCC. The purpose of this study is to extensively figure out the influence of immune-related genes of tumors on the prognosis of patients with ccRCC.
Methods: Files containing 2498 immune-related genes were obtained from the Immunology Database and Analysis Portal (ImmPort), and the transcriptome data and clinical information relevant to patients with ccRCC were identified and downloaded from the TCGA data-base. Univariate and multivariate Cox regression analyses were used to screen out prognostic immune genes. The immune risk score model was established in light of the regression coefficient between survival and hub immune-related genes. We eventually set up a nomogram for the prediction of the overall survival for ccRCC. Kaplan-Meier (K-M) and ROC curve was used in evaluating the value of the predictive risk model. A P value of < 0.05 indicated statistically significant differences throughout data analysis.
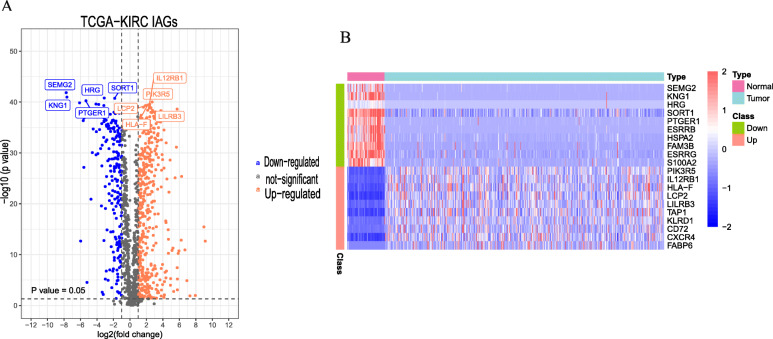
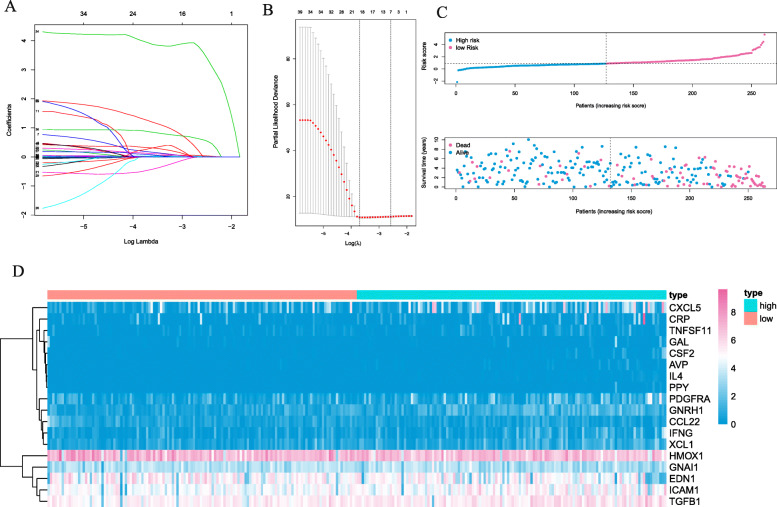
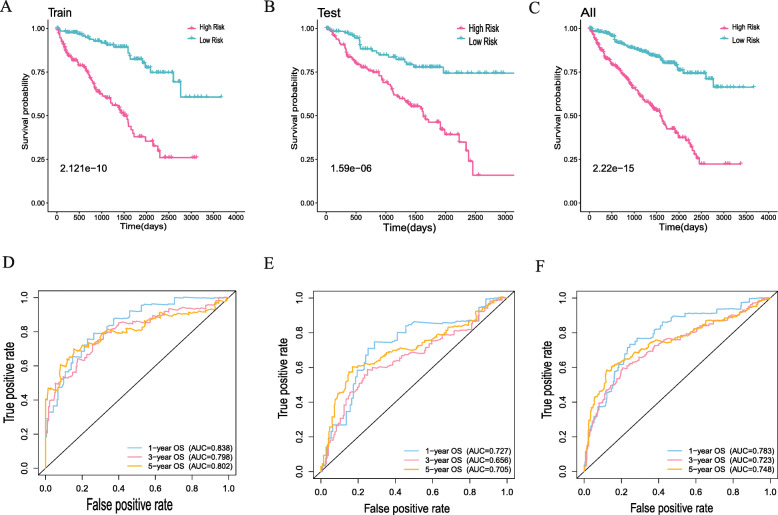
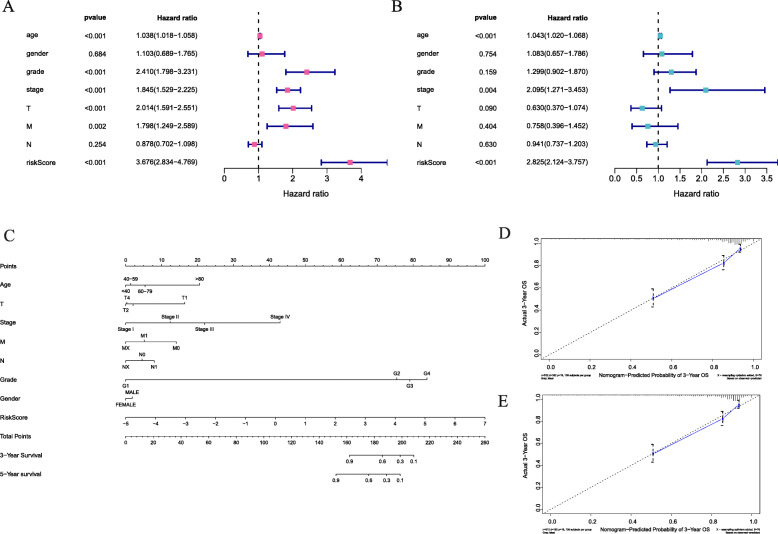
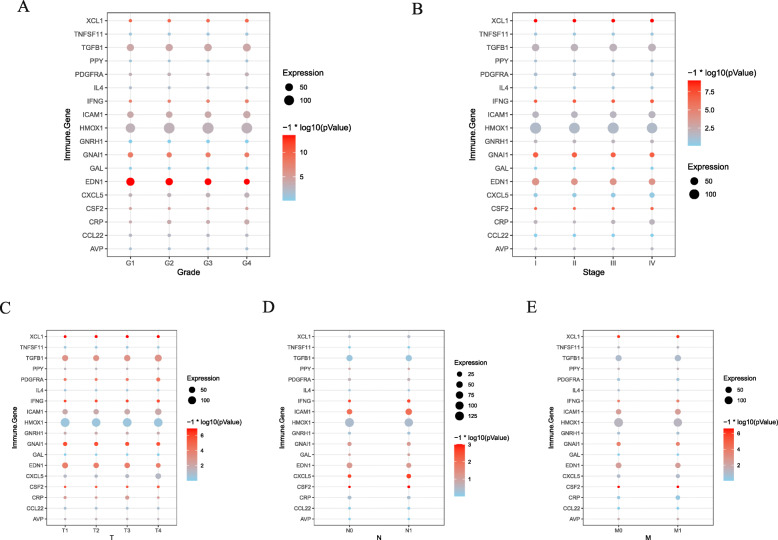
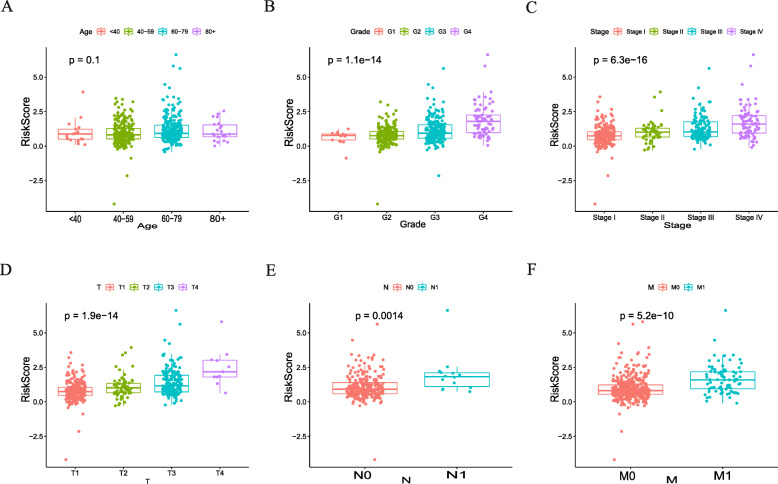
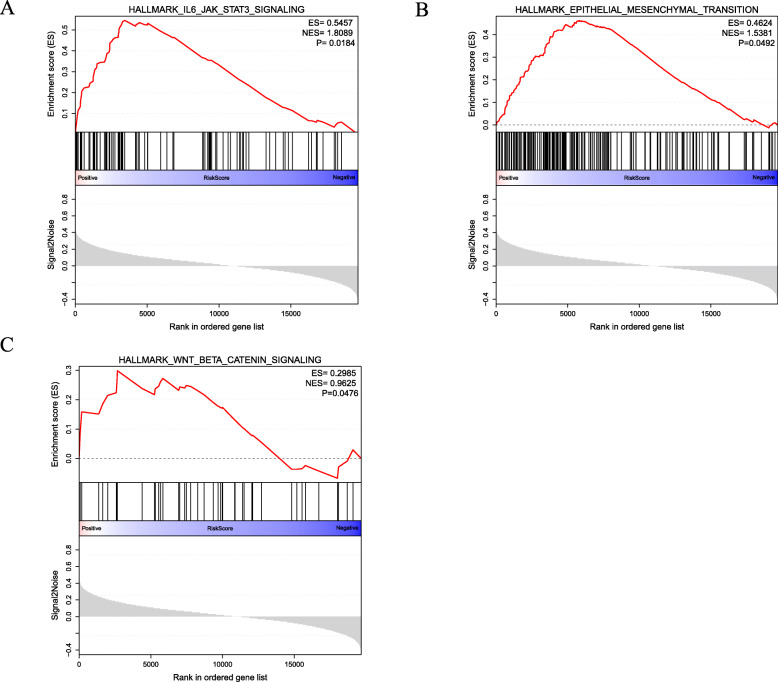
Results: Via differential analysis, we found that 556 immune-related genes were expressed differentially between tumor and normal tissues (p < 0. 05). The analysis of univariate Cox regression exhibited that there was a statistical correlation between 43 immune genes and survival risk in patients with ccRCC (p < 0.05). Through Lasso-Cox regression analysis, we established an immune genetic risk scoring model based on 18 immune-related genes. The high-risk group showed a bad prognosis in K-M analysis. (p < 0.001). ROC curve showed that it was reliable of the immune risk score model to predict survival risk (5 year over survival, AUC = 0.802). The model indicated satisfactory AUC and survival correlation in the validation data set (5 year OS, Area Under Curve = 0.705, p < 0.05). From Multivariate regression analysis, the immune-risk score model plays an isolated role in the prediction of the prognosis of ccRCC. Under multivariate-Cox regression analysis, we set up a nomogram for comprehensive prediction of ccRCC patients' survival rate. At last, it was identified that 18 immune-related genes and risk scores were not only tremendously related to clinical prognosis but also contained in a variety of carcinogenic pathways.
Conclusion: In general, tumor immune-related genes play essential roles in ccRCC development and progression. Our research established an unequal 18-immune gene risk index to predict the prognosis of ccRCC visually. This index was found to be an independent predictive factor for ccRCC.
Keywords: Clear cell renal cell carcinoma; Immune risk score model; Immune-related genes; Nomogram; Prognosis.
Conflict of interest statement
The authors have no conflicts of interest to declare.
Figures
References
-
- Dagher J, Kammerer-Jacquet SF, Dugay F, Beaumont M, Lespagnol A, Cornevin L, Verhoest G, Bensalah K, Rioux-Leclercq N, Belaud-Rotureau MA. Clear cell renal cell carcinoma: a comparative study of histological and chromosomal characteristics between primary tumors and their corresponding metastases. Virchows Arch. 2017;471(1):107–115. doi: 10.1007/s00428-017-2124-0. - DOI - PubMed
-
- Fernandez-Pello S, Hofmann F, Tahbaz R, Marconi L, Lam TB, Albiges L, Bensalah K, Canfield SE, Dabestani S, Giles RH, et al. A systematic review and meta-analysis comparing the effectiveness and adverse effects of different systemic treatments for non-clear cell renal cell carcinoma. Eur Urol. 2017;71(3):426–436. doi: 10.1016/j.eururo.2016.11.020. - DOI - PubMed
-
- Lin YW, Lee LM, Lee WJ, Chu CY, Tan P, Yang YC, Chen WY, Yang SF, Hsiao M, Chien MH. Melatonin inhibits MMP-9 transactivation and renal cell carcinoma metastasis by suppressing Akt-MAPKs pathway and NF-kappaB DNA-binding activity. J Pineal Res. 2016;60(3):277–290. doi: 10.1111/jpi.12308. - DOI - PubMed
MeSH terms
Grants and funding
LinkOut - more resources
Full Text Sources
Medical
Research Materials
