. 2021 Sep;70(9):2000-2013.
doi: 10.2337/db21-0145. Epub 2021 Jun 29.

TM4SF5 Knockout Protects Mice From Diet-Induced Obesity Partly by Regulating Autophagy in Adipose Tissue

Affiliations

TM4SF5 Knockout Protects Mice From Diet-Induced Obesity Partly by Regulating Autophagy in Adipose Tissue

Cheoljun Choi et al. Diabetes. 2021 Sep.

Abstract

Transmembrane 4 L six family member 5 (TM4SF5) functions as a sensor for lysosomal arginine levels and activates the mammalian target of rapamycin complex 1 (mTORC1). While the mTORC1 signaling pathway plays a key role in adipose tissue metabolism, the regulatory function of TM4SF5 in adipocytes remains unclear. In this study we aimed to establish a TM4SF5 knockout (KO) mouse model and investigated the effects of TM4SF5 KO on mTORC1 signaling-mediated autophagy and mitochondrial metabolism in adipose tissue. TM4SF5 expression was higher in inguinal white adipose tissue (iWAT) than in brown adipose tissue and significantly upregulated by a high-fat diet (HFD). TM4SF5 KO reduced mTORC1 activation and enhanced autophagy and lipolysis in adipocytes. RNA sequencing analysis of TM4SF5 KO mouse iWAT showed that the expression of genes involved in peroxisome proliferator-activated receptor α signaling pathways and mitochondrial oxidative metabolism was upregulated. Consequently, TM4SF5 KO reduced adiposity and increased energy expenditure and mitochondrial oxidative metabolism. TM4SF5 KO prevented HFD-induced glucose intolerance and inflammation in adipose tissue. Collectively, the results of our study demonstrate that TM4SF5 regulates autophagy and lipid catabolism in adipose tissue and suggest that TM4SF5 could be therapeutically targeted for the treatment of obesity-related metabolic diseases.


Figures

Figure 1
Figure 1
TM4SF5 expression is abundant in subcutaneous WAT compared with BAT. A: qPCR analysis of Tm4sf5 gene expression in BAT, iWAT, epididymal WAT (eWAT), retroperitoneal WAT (rpWAT), perirenal WAT (prWAT), and perimetrial WAT (pmWAT) of mice. Data represent the mean ± SEM of six mice per group (unpaired, two-tailed t test, **P < 0.01, ***P < 0.001 vs. BAT). B: Immunoblot analysis of TM4SF5 protein in BAT and iWAT of mice. Data represent the mean ± SEM of six mice per group (unpaired, two-tailed t test, ***P < 0.001).
Figure 2
Figure 2
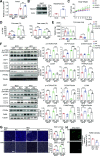
TM4SF5 KO induces autophagy by inhibition of mTOR signaling. A and B: Immunoblot analysis of p-mTOR (Ser2481), mTOR, p-AMPK (Thr172), AMPK, p-ULK1 (Ser555, Ser757), LC3, SQSTM1/p62, p-HSL (Ser660), HSL, and ATGL proteins in BAT and iWAT of WT and TM4SF5 KO mice. Data represent the mean ± SEM of six mice per group (unpaired, two-tailed t test, **P < 0.01, ***P < 0.001).
Figure 3
Figure 3
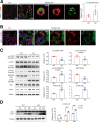
TM4SF5 regulates autophagy activation in adipocytes in vitro. Adipocytes were differentiated from preadipocytes obtained from iWAT of WT and TM4SF5 KO mice. A: Representative images of WT and TM4SF5 KO adipocytes immunostained with LC3 along with quantification and higher-magnification view of the boxed region. Neutral lipid and nuclei were counterstained with LipidTOX and DAPI. Size bar = 20 μm. B: Representative images of WT and TM4SF5 KO adipocytes immunostained with LC3 and PLIN1. Higher-magnification view of the boxed region is shown. Neutral lipid was counterstained with LipidTOX. Arrows indicate LC3-PLIN1 colocalized locations. Size bar = 20 μm. C: Immunoblot analysis of p-mTOR (Ser2481), mTOR, p-ULK1 (Ser555, Ser757), SQSTM1/p62, p-HSL (Ser660), HSL, and ATGL proteins in WT and TM4SF5 KO adipocytes. D: Immunoblot analysis of LC3 in WT and TM4SF5 KO adipocytes after 6 and 24 h of chloroquine treatments (50 μmol/L). Data represent the mean ± SEM of six samples per group (unpaired, two-tailed t test, **P < 0.01, ***P < 0.001).
Figure 4
Figure 4
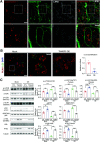
Overexpression of TM4SF5 downregulates autophagy and lipolysis. A: Representative image of C3H10T1/2 adipocytes overexpressing GFP-fused TM4SF5. Neutral lipid and lysosome were stained with LipidTOX and LysoTracker. Size bar = 20 μm. B: Representative images of C3H10T1/2 adipocytes overexpressing Myc-fused TM4SF5 (OE) and mock control (Mock) stained with LC3 and PLIN1 along with quantification of LC3. Nuclei were counterstained with DAPI. Size bar = 20 μm. C: Immunoblot analysis of p-mTOR (Ser2481), mTOR, p-ULK1 (Ser555, Ser757), SQSTM1/p62, p-HSL (Ser660), HSL, and ATGL proteins in C3H10T1/2 adipocytes overexpressing TM4SF5 and mock controls treated with vehicle (CTL) or 5 μmol/L TSAHC for 24 h. Data represent the mean ± SEM of six samples per group (unpaired, two-tailed t test, **P < 0.01, ***P < 0.001).
Figure 5
Figure 5
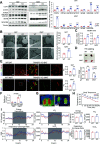
TM4SF5 KO mice manifest catabolic phenotype in adipose tissue. A: Immunoblot analysis of UCP1, COXIV, ATP5A, UQCRC2, MTCO1, SDHB, and NDUFB8 proteins in BAT and iWAT of WT and TM4SF5 KO mice. B: Representative transmission electron microscopy images from BAT and iWAT of WT and TM4SF5 KO mice along with quantification of mitochondrial content (number of mitochondria per nucleus). Size bar = 2 μm. C: mtDNA content analysis relative to nuclear DNA (nDNA) in BAT and iWAT of WT and TM4SF5 KO mice. D: TTC assay in BAT and iWAT of WT and TM4SF5 KO mice. E: Representative images of paraffin sections from BAT and iWAT of WT and TM4SF5 KO mice immunostained with MCAD and LC3. Higher-magnification view of boxed region is shown. Colocalization was evaluated with use of ImageJ software via JACoP plugin, and PC values are presented. Size bar = 20 μm. F: qPCR analysis of Tm4sf5 expression in BAT and iWAT of WT mice after 3 days of cold exposure (4°C, cold). G and H: Representative image of surface temperature (G) and monitoring of rectal temperature (H) of WT and TM4SF5 KO mice exposed to cold temperature (4°C) for 4 h with room temperature controls (RT). I: Indirect calorimetry analysis of WT and TM4SF5 KO mice. Data represent the mean ± SEM of six mice per group (unpaired, two-tailed t test, *P < 0.05, **P < 0.01, ***P < 0.001). EE, energy expenditure; RER, respiratory exchange ratio.
Figure 6
Figure 6
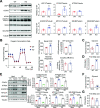
TM4SF5 regulates mitochondrial oxidative metabolism in adipocytes in vitro. A: Immunoblot analysis of UCP1, COXIV, ATP5A, UQCRC2, MTCO1, SDHB, and NDUFB8 proteins in WT and TM4SF5 KO adipocytes. Adipocytes were differentiated from preadipocytes obtained from BAT of WT and TM4SF5 KO mice. B: OCR analysis of WT and TM4SF5 adipocytes. Adipocytes were differentiated from preadipocytes obtained from iWAT of WT and TM4SF5 KO mice. C and D: Glycerol (C) and FFA (D) levels in conditioned media of WT and TM4SF5 KO adipocytes. Adipocytes were differentiated from preadipocytes obtained from iWAT of WT and TM4SF5 KO mice. E: Immunoblot analysis of COXIV, ATP5A, UQCRC2, MTCO1, and NDUFB8 proteins in mock controls (Mock) and C3H10T1/2 adipocytes overexpressing TM4SF5 (OE) treated with vehicle control (CTL) or TSAHC (5 μmol/L) for 24 h. F and G: Glycerol (F) and FFA (G) levels in conditioned media of mock controls and C3H10T1/2 adipocytes overexpressing TM4SF5. Data represent the mean ± SEM of six samples per group (unpaired, two-tailed t test, *P < 0.05, **P < 0.01, ***P < 0.001).
Figure 7
Figure 7
TM4SF5 KO protects mice from obesity-induced metabolic dysfunction. A: qPCR analysis of Tm4sf5 expression in BAT and iWAT of mice after 8 weeks of NCD or HFD feeding. B: Immunoblot analysis of TM4SF5 protein in iWAT of mice fed NCD or HFD for 8 weeks. CE: Body weights (C), body fat and lean mass (D), and adipose tissue weight analysis (E) of WT and TM4SF5 KO mice fed with NCD and HFD for 8 weeks. F: Immunoblot analysis of p-mTOR (Ser2481), mTOR, UCP1, COXIV, LC3, SQSTM1/p62, PPARα, and F4/80 proteins in BAT and iWAT of WT and TM4SF5 KO mice fed with NCD and HFD for 8 weeks. G: Representative images of H-E–stained paraffin sections and LD size quantification from BAT and iWAT of WT and TM4SF5 KO mice fed with NCD or HFD for 8 weeks. Size bar = 100 μm. H: Immunofluorescence images of F4/80 in paraffin sections from iWAT of WT and TM4SF5 KO mice fed an HFD for 8 weeks. Size bar = 20 μm. Data represent the mean ± SEM of six mice per group (unpaired, two-tailed t test, *P < 0.05, **P < 0.01, ***P < 0.001). wks, weeks.
Figure 8
Figure 8
TM4SF5 KO restores insulin sensitivity in mice with HFD-induced obesity. WT and TM4SF5 KO mice were fed the NCD or HFD for 8 weeks. A and B: Intraperitoneal glucose tolerance test (A) and insulin sensitivity test (B). AUC, area under the curve. C and D: insulin (C) and triglyceride (TG), total cholesterol (TCHO), and glutamic-pyruvic transaminase (GPT) levels (D) in serum. E: Immunoblot analysis of p-AKT (Ser473), AKT, p-IRS1 (Ser612), IRS1 and p-IRS2 (Ser388), and IRS2 proteins in BAT and iWAT of WT and TM4SF5 KO mice fed HFD with acute insulin treatment (0.75 units/kg) and controls (CTL) without insulin treatment. F and G: Glycerol (F) and FFA (G) levels in serum of WT and TM4SF5 KO mice fed HFD with acute insulin treatment (0.75 units/kg) and controls (CTL) without insulin treatment. Data represent the mean ± SEM of six mice per group (unpaired, two-tailed t test, **P < 0.01, ***P < 0.001).

Similar articles

Cited by

References

    1. Lee YH, Mottillo EP, Granneman JG. Adipose tissue plasticity from WAT to BAT and in between. Biochim Biophys Acta 2014;1842:358–369 - PMC - PubMed
    1. Saely CH, Geiger K, Drexel H. Brown versus white adipose tissue: a mini-review. Gerontology 2012;58:15–23 - PubMed
    1. Ballinger MA, Andrews MT. Nature’s fat-burning machine: brown adipose tissue in a hibernating mammal. J Exp Biol 2018;221(Suppl. 1):jeb162586. - PMC - PubMed
    1. Rui L. Brown and beige adipose tissues in health and disease. Compr Physiol 2017;7:1281–1306 - PMC - PubMed
    1. Okla M, Kim J, Koehler K, Chung S. Dietary factors promoting brown and beige fat development and thermogenesis. Adv Nutr 2017;8:473–483 - PMC - PubMed

Publication types

Substances