. 2021 Jul 6;118(27):e2026411118.
doi: 10.1073/pnas.2026411118.

Alternative splicing of GluN1 gates glycine site-dependent nonionotropic signaling by NMDAR receptors

Affiliations

Alternative splicing of GluN1 gates glycine site-dependent nonionotropic signaling by NMDAR receptors

Hongbin Li et al. Proc Natl Acad Sci U S A. .

Abstract

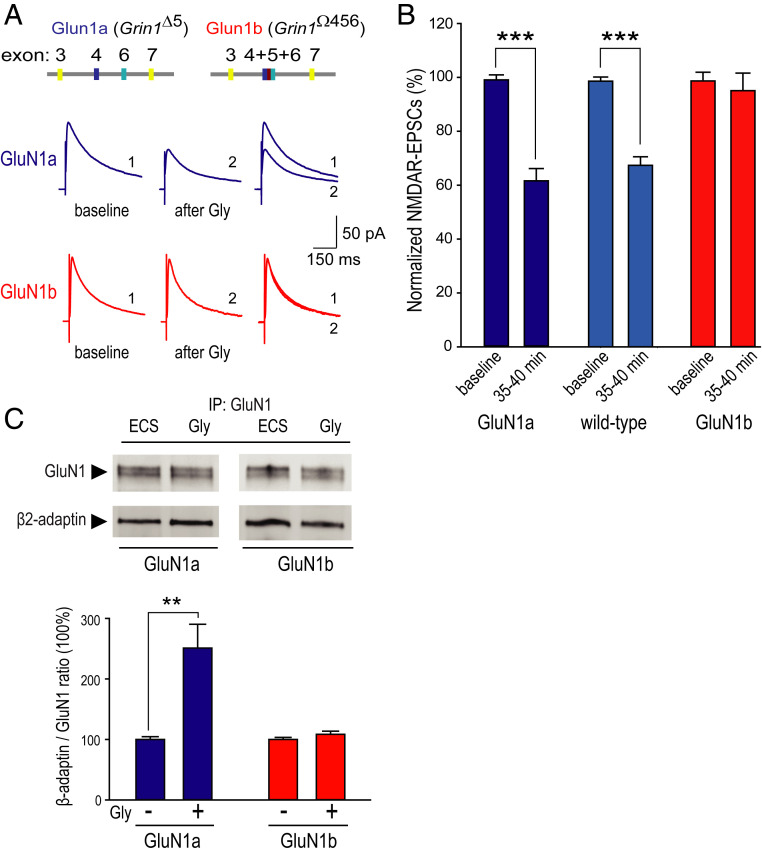
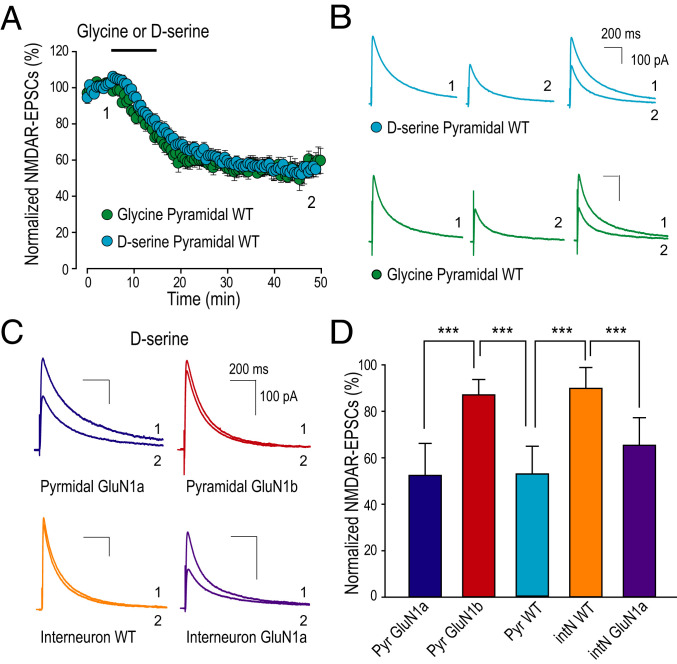
N-methyl-D-aspartate (NMDA) receptors (NMDARs), a principal subtype of excitatory neurotransmitter receptor, are composed as tetrameric assemblies of two glycine-binding GluN1 subunits and two glutamate-binding GluN2 subunits. NMDARs can signal nonionotropically through binding of glycine alone to its cognate site on GluN1. A consequence of this signaling by glycine is that NMDARs are primed such that subsequent gating, produced by glycine and glutamate, drives receptor internalization. The GluN1 subunit contains eight alternatively spliced isoforms produced by including or excluding the N1 and the C1, C2, or C2' polypeptide cassettes. Whether GluN1 alternative splicing affects nonionotropic signaling by NMDARs is a major outstanding question. Here, we discovered that glycine priming of recombinant NMDARs critically depends on GluN1 isoforms lacking the N1 cassette; glycine priming is blocked in splice variants containing N1. On the other hand, the C-terminal cassettes-C1, C2, or C2'-each permit glycine signaling. In wild-type mice, we found glycine-induced nonionotropic signaling at synaptic NMDARs in CA1 hippocampal pyramidal neurons. This nonionotropic signaling by glycine to synaptic NMDARs was prevented in mice we engineered, such that GluN1 obligatorily contained N1. We discovered in wild-type mice that, in contrast to pyramidal neurons, synaptic NMDARs in CA1 inhibitory interneurons were resistant to glycine priming. But we recapitulated glycine priming in inhibitory interneurons in mice engineered such that GluN1 obligatorily lacked the N1 cassette. Our findings reveal a previously unsuspected molecular function for alternative splicing of GluN1 in controlling nonionotropic signaling of NMDARs by activating the glycine site.

Keywords: GluN1; endocytosis; interneuron; nonionotropic; splicing.


Conflict of interest statement

The authors declare no competing interest.

Figures

Fig. 1.
Fig. 1.
GluN1 splice variants regulate glycine-primed NMDAR internalization in HEK293 cells. (A) Schematic of the eight alternative splice variants of GluN1. (B) Anti-GluN1 labeling of impermeabilized HEK293 cells transfected with a GluN1 splice variant and either GluN2A or GluN2B, as indicated. Anti-GluN1 labeling was quantified using ELISA, and cell surface expression of GluN1 was calculated after receptor priming (Glycine 100 µM, 5 min) and activation (NMDA 50 µM, Gly 1 µM, 5 min) relative to control ECS. The ELISA signal from cells expressing GluN1 subunits lacking the N1 cassette decreased to a range from 42.9 ± 13.1 to 76.8 ± 5.2% of unprimed NMDARs, whereas the signal from cells expressing GluN1 subunits containing the N1 cassette remained within the range of 91.2 ± 6.8 to 129.5 ± 24.3% of unprimed NMDARs. Statistical significance is indicated with *P < 0.05 and **P < 0.01 by Student’s t test. (C) Representative confocal microscopy images of HEK293 cells expressing recombinant NMDARs with either BBS-tagged GluN1-1a or GluN1-1b, coexpressed with either GluN2A or GluN2B. Internalized NMDAR receptors are visible in the red channel (BTX-Cypher5E) versus total NMDAR expression in the green channel (BTX-AF488). Differential interference contrast images reveal the location of cells in the corresponding field of view with conditioning glycine (Glycine 100 µM) or NMDA+glycine treatment (NMDA 50 µM, Gly 1 µM). A high resolution version of this figure can be found on Figshare (DOI: 10.6084/m9.figshare.14802654).
Fig. 2.
Fig. 2.
N1 cassette prevents the glycine priming–induced decrease of NMDAR current in HEK293 cells. Time series of normalized NMDAR peak current evoked by 50 µM NMDA and 1 µM glycine following conditioning treatment with ECS containing 100 µM glycine and D-APV (Gly, filled circles) or ECS containing D-APV (open circles) from HEK293 cells expressing the following: (A) GluN1-1a/GluN2A receptors (58.9 ± 3.8 versus 88.4 ± 5.8%, n = 6 and 7, respectively, **P < 0.01); (B) GluN1-1a/GluN2B receptors (58.1 ± 3.8 versus 87.3 ± 2.5%, n = 5 and 7, respectively, ***P ≤ 0.001); (C) GluN1-1b/GluN2A receptors (91.3 ± 8.6, versus 88.6 ± 8.0, n = 4 and 5 per group); and (D) GluN1-1b/GluN2B receptors (84.8 ± 3.5% versus 92.5 ± 8.6, n = 5 and 4, respectively). All values are calculated from the end of each recording. Bath application is denoted by the gray bar. At the Bottom of each panel are representative averaged traces from five consecutive evoked currents at the indicated times (1, 2). (Scale bar, 100 pA, 1 sec.) (E) Representative immunoblot of GluN1 and β2-adaptin after immunoprecipitation by anti–β2-adaptin of HEK293 cell lysates expressing GluN1-1a or GluN1-1b together with GluN2A (Top) or GluN2B (Bottom) after cells were conditioned with ECS+D-APV or ECS+glycine+D-APV. (F and G) Histogram of average GluN1/β2-adaptin ratio following conditioning with 100 µM glycine and D-APV in HEK293 cells expressing (F) GluN1-1a/GluN2A (191.9 ± 19.2%) versus GluN1-1b/GluN2A (126.1 ± 9.8%, *P < 0.05) and (G) GluN1-1a/GluN2B (153.3 ± 12.3%) versus GluN1-1b/GluN2B (110.2 ± 22.5%, *P < 0.05). Student’s t test is used for all statistic comparisons.
Fig. 3.
Fig. 3.
Glycine-primed decline in synaptic NMDAR current is dynamin dependent in rats and mice. (A) Scatter plot of NMDAR EPSC peak amplitude over time from rat CA1 pyramidal neurons recorded following 5 min of bath-applied ACSF (gray), glycine (Gly 0. 2 mM, blue), or glycine (0.2 mM) with intracellularly applied dynasore (50 µM, green). Bath application is denoted by the white bar. Representative average NMDAR EPSC traces were recorded at membrane potential of +60 mV at the times indicated (1, 2). (B) Histogram of averaged NMDAR EPSCs measured before (baseline) and after treatment of ACSF (89.9 ± 4.4%, n = 6, gray), glycine (61.0 ± 2.9%, n = 12, blue, ***P ≤ 0.001 versus ACSF), or dynasore (85.7 ± 6.9%, n = 6, green, ***P ≤ 0.001 versus glycine, one-way ANOVA). (C) Representative average NMDAR EPSC traces from mouse CA1 pyramidal neurons recorded at baseline and 20 min after bath-applied treatment of glycine (Gly 1 mM, 10 min, blue) or glycine plus dynasore (50 µM in intracellular solution, purple). (D) Histogram of average NMDAR EPSC peak amplitudes measured before (baseline) and after treatment with ACSF (98.9 ± 4.1%, n = 6, gray), glycine (67.7 ± 3.6%, n = 15, blue, ***P ≤ 0.001 versus ACSF), and intracellularly applied dynasore (94.0 ± 4.7%, n = 6, green, ***P ≤ 0.001 versus glycine, one-way ANOVA). (E) Scatter plots with representative traces showing the current (I)–voltage (V) relationship and reversal potential of NMDAR EPSCs before (white) and 25 min after glycine treatment (1 mM, 10 min, blue). Statistical significance (*P < 0.05) was detected at holding potential of −10 mV, +30 mV, +40 mV, +50 mV, and +60 mV (n = 12, P < 0.05 between two plots, two-way ANOVA). (F) Histogram of averaged β2-adaptin/GluN1 ratio with glycine treatment (Gly 1mM, 10min) in hippocampal slices from wild-type mice (135.0 ± 8.10%, n = 13, ***P ≤ 0.001 versus ECS, Student’s t test). (Top) Representative immunoblot of GluN1 and β2-adaptin after anti-GluN1 immunoprecipitation.
Fig. 4.
Fig. 4.
Glycine-primed decline in synaptic NMDAR current is dependent on the exclusion of the N1 cassette. (A, Top) Schematic representation of Grin1 loci for GluN1a and GluN1b mice depicting removal of exon 5 (Grin1Δ5) or fusion of exons 4 to 6 (Grin1Ω456). (Bottom) Representative average NMDAR EPSC traces from GluN1a (blue) and GluN1b (red) mice CA1 pyramidal neurons recorded at baseline (black) and 20 min after bath-applied treatment of glycine (Gly 1 mM, 10 min). (B) Histogram of averaged NMDAR EPSCs peak amplitude measured before glycine treatment as baseline and at the end of each recordings shown as the following: GluN1a (60.8 ± 4.8%, n = 13, ***P ≤ 0.001 versus baseline, dark blue), GluN1b (94.8 ± 4.2%, n = 7, P > 0.05 versus baseline, red), and WT (67.7 ± 3.6%, n = 15, blue, same data as Fig. 3D Gly). (C) Histogram of averaged β2-adaptin/GluN1 ratio with glycine treatment (Gly 1mM, 10 min) in hippocampal slices from GluN1a (250.9 ± 43.0%, n = 6, **P < 0.01 versus ECS, blue) and GluN1b mice (108.4 ± 5.4%, n = 11, P > 0.05 versus ECS, red). (Top) Representative immunoblot of GluN1 and β2-adaptin with GluN1 immunoprecipitation. Student’s t test was used for all statistic comparisons.
Fig. 5.
Fig. 5.
Glycine-primed NMDAR internalization is inhibited in hippocampal interneurons. (A) Representative traces of voltage responses to hyperpolarizing current (−200 pA, 600 ms) and action potentials to depolarizing current injections recorded in CA1 pyramidal neurons (+160 pA, 600 ms) and interneurons (+60 pA, 600 ms). (B) Plot of average action potential peaks in a train normalized to the first action potential for both cell types. (Inset, Left) Diagram of a hippocampal slice showing recordings on CA1 pyramidal neuron (Pyr) and interneuron (intN) projected by Schaffer collaterals inputs. (Inset, Right) Two-photon imaging of an interneuron from CA1 stratum radiatum loaded with Alexa Fluor 594 via a patch pipette. (Scale bar, 100 µm.) (C) Histogram of after-hyperpolarization potentials (AHPs) for both cell types. (Top) Representative traces of single action potential and AHPs evoked by rheobase depolarizations. (D) Scatter plot of NMDAR EPSC peak amplitude over time from mouse CA1 pyramidal (blue) and interneurons (red) recorded with treatment of 10 min bath-applied glycine (0.2 mM, white bar). The magnitudes of NMDAR EPSCs amplitude at time point 2 were as follows: Pyr (65.5 ± 3.9%, n = 7) versus intN (98.9 ± 5.4%, n = 6, ***P ≤ 0.001). (E) representative average NMDAR EPSC traces recorded at membrane potential of +60 mV at the times indicated in 1 and 2. (F) Scatter plot of NMDAR EPSC peak amplitude over time from GluN1a mouse CA1 pyramidal (purple) and interneurons (dark red) recorded with treatment of 10 min bath-applied glycine (0.2 mM, open bar). The magnitudes of NMDAR EPSCs amplitude at time point 2 were as follows: Pyr (57.7 ± 7.8%, n = 6) versus intN (57.8 ± 5.9%, n = 6, P > 0.05). (G) representative average NMDAR EPSC traces recorded at membrane potential of +60 mV at the times indicated in 1 and 2. Student’s t test used for all statistic comparisons. A high resolution version of this figure can be found on Figshare (DOI: 10.6084/m9.figshare.14802663).
Fig. 6.
Fig. 6.
D-serine primes depression of synaptic NMDARs. (A) Scatter plot of NMDAR EPSC peak amplitude over time from mouse CA1 pyramidal neurons recorded with 10 min treatment (black bar) of bath-applied D-serine (0.1 mM) or glycine (0.2 mM). The magnitudes of NMDAR EPSCs amplitude at time point 2 were as follows: D-serine (53.0 ± 4.0%, n = 9) and glycine (55.4 ± 4.0%, n = 6). (B) Representative average NMDAR EPSC traces recorded at membrane potential of +60 mV as the times indicated (1, 2) in A in the presence of NBQX. (C) Representative average NMDAR EPSC traces recorded at membrane potential of +60 mV before (1) and 30 min after D-serine treatment (2) in the presence of NBQX. Traces recorded from pyramidal neurons shown as GluN1a (blue), GluN1b (dark red), and traces from interneurons shown as wild type (orange), GluN1a (purple). (D) Histogram of averaged NMDAR EPSCs peak amplitude measured at 30 to 35 min after D-serine conditioning: Pyramidal neuron (Pyr) GluN1a (blue, 52.4 ± 4.9%, n = 8) versus GluN1b (dark red, 87.1 ± 2.7%, n = 6, ***P ≤ 0.001) and Interneuron (intN) GluN1a (purple, 65.3 ± 4.9%, n = 6) versus wild type (orange, 89.9 ± 3.0, n = 9, ***P = 0.001). One-way ANOVA test was used for all statistic comparisons, a statistically significant difference (***P < 0.001).

Similar articles

Cited by

References

    1. Bliss T. V., Collingridge G. L., A synaptic model of memory: Long-term potentiation in the hippocampus. Nature 361, 31–39 (1993). - PubMed
    1. Lau C. G., Zukin R. S., NMDA receptor trafficking in synaptic plasticity and neuropsychiatric disorders. Nat. Rev. Neurosci. 8, 413–426 (2007). - PubMed
    1. Hansen K. B., et al. ., Structure, function, and allosteric modulation of NMDA receptors. J. Gen. Physiol. 150, 1081–1105 (2018). - PMC - PubMed
    1. Traynelis S. F., et al. ., Glutamate receptor ion channels: Structure, regulation, and function. Pharmacol. Rev. 62, 405–496 (2010). - PMC - PubMed
    1. Aow J., Dore K., Malinow R., Conformational signaling required for synaptic plasticity by the NMDA receptor complex. Proc. Natl. Acad. Sci. U.S.A. 112, 14711–14716 (2015). - PMC - PubMed

Publication types

MeSH terms

Grants and funding

LinkOut - more resources