. 2021 Jul 6;118(27):e2100356118.
doi: 10.1073/pnas.2100356118.

Acute Trem2 reduction triggers increased microglial phagocytosis, slowing amyloid deposition in mice

Affiliations

Acute Trem2 reduction triggers increased microglial phagocytosis, slowing amyloid deposition in mice

Kathleen M Schoch et al. Proc Natl Acad Sci U S A. .

Abstract

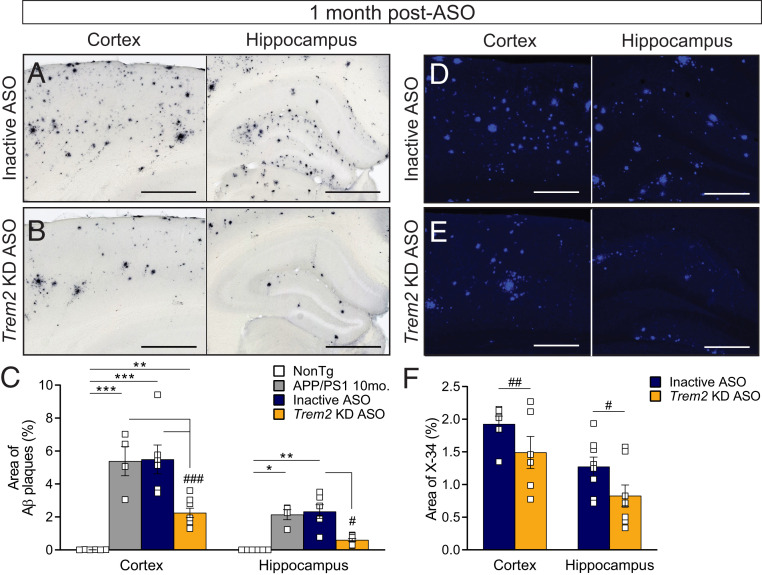
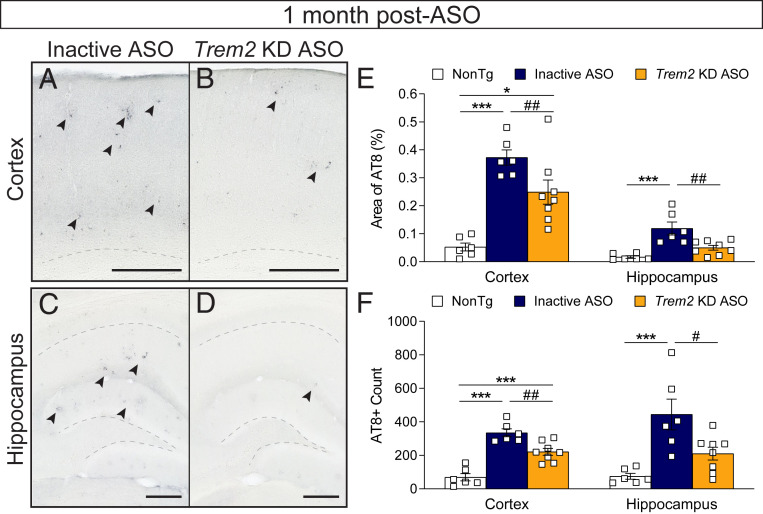
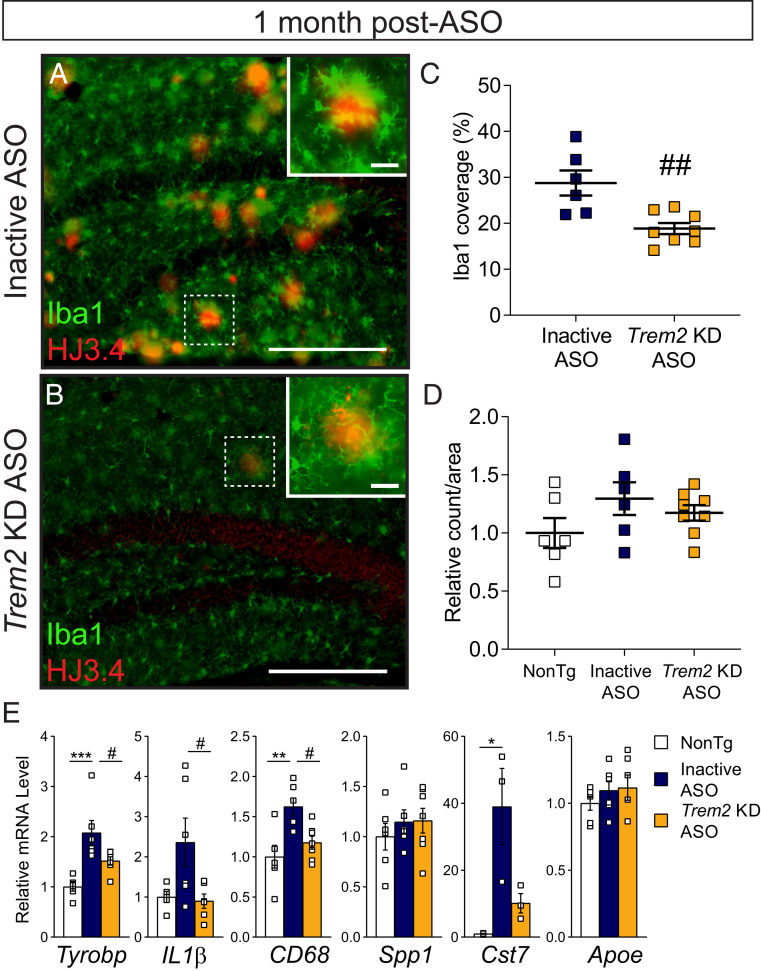
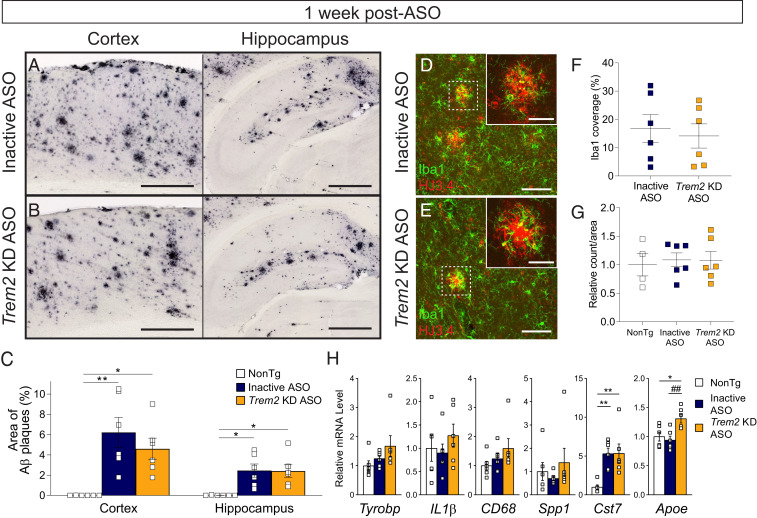
Heterozygous genetic variants within the TREM2 gene show a strong association with increased Alzheimer's disease (AD) risk. Amyloid beta-depositing mouse models haploinsufficient or null for Trem2 have identified important relationships among TREM2, microglia, and AD pathology; however, results are challenging to interpret in the context of varying microglial phenotypes and disease progression. We hypothesized that acute Trem2 reduction may alter amyloid pathology and microglial responses independent of genetic Trem2 deletion in mouse models. We developed antisense oligonucleotides (ASOs) that potently but transiently lower Trem2 messenger RNA throughout the brain and administered them to APP/PS1 mice at varying stages of plaque pathology. Late-stage ASO-mediated Trem2 knockdown significantly reduced plaque deposition and attenuated microglial association around plaque deposits when evaluated 1 mo after ASO injection. Changes in microglial gene signatures 1 wk after ASO administration and phagocytosis measured in ASO-treated cells together indicate that microglia may be activated with short-term Trem2 reduction. These results suggest a time- and/or dose-dependent role for TREM2 in mediating plaque deposition and microglial responses in which loss of TREM2 function may be beneficial for microglial activation and plaque removal in an acute context.

Keywords: Alzheimer’s disease; Trem2; amyloid; antisense oligonucleotide; microglia.


Conflict of interest statement

Competing interest statement: P.J.-N. and F.R. are paid employees of Ionis Pharmaceuticals. Washington University in St. Louis has an existing licensing agreement with Ionis Pharmaceuticals for use of antisense oligonucleotides in these studies. T.M.M. is a consultant for Ionis Pharmaceuticals.

Figures

Fig. 1.
Fig. 1.
ASOs reduce TREM2 throughout the brain of APP/PS1 mice. (A) Brain tissue from 11-mo-old APP/PS1 and nontransgenic (NonTg, n = 5) mice was analyzed for Trem2 mRNA by qRT-PCR 1 mo following intracerebroventricular injection of inactive ASO or Trem2 KD ASO (n = 3/group). Tissues from untreated APP/PS1 mice at 10 mo of age (n = 3) were included as a control. mRNA was normalized to GAPDH and expressed as mean ± SEM; one-way ANOVA with Tukey’s multiple comparison test; *P < 0.05, **P < 0.01, ***P < 0.001 versus NonTg; ###P < 0.001 versus APP/PS1 10 mo and inactive ASO; ns, nonsignificant. Individual mice are depicted as open squares. (B) Representative images of Trem2 immunohistochemistry from brain tissue contralateral to the ASO injection from NonTg and ASO-treated APP/PS1 mice. The CA3 regions of the hippocampus are shown, with arrowheads indicating TREM2-positive areas. (Scale bar, 250 μm.) (C) Representative images of Iba1 (green) and TREM2 (red) immunofluorescence within the retrosplenial cortex are shown, with arrowheads indicating colocalized (yellow) regions. (Scale bar, 50 μm.)
Fig. 2.
Fig. 2.
Trem2-lowering ASO treatment reverses amyloid deposition during late stages of plaque development. Cortical and hippocampal regions from 11-mo-old nontransgenic (NonTg) and APP/PS1 mice were analyzed for amyloid beta (Aβ) deposition (antibody: HJ3.4) 1 mo following treatment with (A) inactive or (B) Trem2 KD ASO. Representative images are shown. (Scale bar, 500 µm.) (C) The area of Aβ plaques was quantified within the cortex and hippocampus of ASO-treated mice. Untreated APP/PS1 mice at 10 mo of age were included for comparison. Data are mean ± SEM. Open squares represent individual mice: n = 6 NonTg, n = 4 10-mo APP/PS1, n = 6 inactive ASO, and n = 8 Trem2 KD ASO. One-way ANOVA with Tukey’s multiple comparison test; *P < 0.05, **P < 0.01, and ***P < 0.001 versus NonTg; #P < 0.05 and ###P < 0.001 versus untreated or inactive ASO. Brains were similarly analyzed for Aβ deposition by X-34 staining following (D) inactive or (E) Trem2 KD ASO treatment. Representative images are shown. (Scale bar, 250 µm.) (F) The area of X-34 staining was quantified within the cortex and hippocampus of ASO-treated mice. Data are mean ± SEM. Open squares represent individual mice: n = 6 inactive ASO and n = 8 Trem2 KD ASO. Unpaired t test; #P < 0.05, ##P < 0.01 versus inactive ASO.
Fig. 3.
Fig. 3.
Phosphorylated tau levels are reduced following Trem2 reduction. Brain tissue from 11-mo-old nontransgenic (NonTg) and APP/PS1 mice were immunostained for phosphorylated tau (antibody: AT8) 1 mo following treatment with inactive or Trem2 KD ASO. Representative images from the (A and B) cortex and (C and D) hippocampus are shown. (Scale bar, 250 µm.) Arrows indicate regions of AT8 positivity. Dotted lines denote the subcortical white matter in A and B and the CA1 and dentate gyrus layers in C and D. (E) The area of AT8 reactivity and (F) number of AT8 puncta were quantified within the cortex and hippocampus. Data are mean ± SEM; one-way ANOVA with Tukey’s multiple comparison test. *P < 0.05, ***P < 0.001 versus NonTg; #P < 0.05, ##P < 0.01 versus inactive ASO. Open squares represent individual mice: n = 6 NonTg, n = 6 inactive ASO, and n = 8 Trem2 KD ASO.
Fig. 4.
Fig. 4.
Microglial localization and genetic responses are blunted 1 mo following late-stage Trem2 reduction. Brain tissue from 11-mo-old APP/PS1 mice treated with (A) inactive or (B) Trem2 KD ASO 1 mo prior was labeled with Iba1 to identify microglia (green) and HJ3.4 to identify amyloid beta plaques (red). Representative images are shown. (Scale bar, 250 μm, inset 25 μm.) (C) The area of Iba1+ coverage of plaques per animal and (D) total Iba1+ counts were quantified within the hippocampus following inactive ASO (n = 6) or Trem2 KD ASO (n = 8) treatment. Nontransgenic (NonTg) mice (n = 6) included for total microglia quantification. Data are mean ± SEM; unpaired t test or one-way ANOVA; ##P < 0.01. (E) mRNA levels of select inflammatory or microglial markers were measured by qRT-PCR and normalized to GAPDH (open square represent individual mice; n = 3 to 7/treatment). Data are mean ± SEM relative to NonTg; one-way ANOVA with Tukey’s multiple comparison test; *P < 0.05, **P < 0.01, ***P < 0.001 versus NonTg; #P < 0.05 versus inactive ASO.
Fig. 5.
Fig. 5.
Select activation markers are up-regulated 1 wk following late-stage Trem2 reduction despite no change in amyloid deposition or microglial clustering. Nontransgenic (NonTg) and APP/PS1 mice were treated with (A) inactive or (B) Trem2 KD ASO at 10 mo of age. One week after ASO injection, mice were euthanized and brain tissue labeled with HJ3.4 to identify amyloid beta plaques. Representative images are shown. (Scale bar, 500 µm.) (C) Amyloid deposition was quantified within the cortex and hippocampus and expressed as a percentage of the total area measured. Data are mean ± SEM; one-way ANOVA with Tukey’s multiple comparison test; *P < 0.05, **P < 0.01 versus NonTg. Squares are individual mice (n = 6 per genotype/treatment). Brain tissue from mice treated with (D) inactive or (E) Trem2 KD ASO were also immunofluorescently labeled with HJ3.4 (red) and Iba1 (green). Representative images are shown. (Scale bars, 100 µm, 25 µm for insets.) (F) The area of Iba1+ coverage of plaques per animal and (G) total Iba1+ counts were quantified within the hippocampus following inactive ASO (n = 6) or Trem2 KD ASO (n = 6) treatment. Data are mean ± SEM. (H) mRNA levels of select inflammatory or microglial markers were measured by qRT-PCR, normalized to GAPDH (open square represent individual mice; n = 3 to 7/treatment). Data are mean ± SEM relative to NonTg; one-way ANOVA with Tukey’s multiple comparison test; *P < 0.05 and **P < 0.01 versus NonTg; ##P < 0.01 versus inactive ASO.
Fig. 6.
Fig. 6.
ASO-mediated Trem2 reduction increases phagocytosis in cultured cells. Phagocytosis of fluorescently labeled beads was measured in (AC) BV2 cells and (DF) primary nontransgenic mouse microglia following treatment with saline, inactive ASO, or Trem2 KD ASO. Cytochalasin D (CytoD), an inhibitor of actin polymerization, was included as a control. Representative images are shown at 60× (BV2) or 20× (primary microglia). (Scale bar, 50 µM.) The percentage of bead colocalization with DAPI-positive cells (C) or with Iba1-positive cells (F) was quantified and shown as mean ± SEM relative to saline treatment. Triangles/circles represent individual wells (n = 4 to 8 wells/treatment in BV2 cells; n = 6 to 8 wells/treatment in primary microglia). One-way ANOVA with Tukey’s multiple comparison test; ***P < 0.001 versus saline, #P < 0.05 versus inactive ASO.

Similar articles

Cited by

References

    1. Bateman R. J.et al. .; Dominantly Inherited Alzheimer Network , Clinical and biomarker changes in dominantly inherited Alzheimer’s disease. N. Engl. J. Med. 367, 795–804 (2012). - PMC - PubMed
    1. Jack C. R. Jr, et al. ., Tracking pathophysiological processes in Alzheimer’s disease: An updated hypothetical model of dynamic biomarkers. Lancet Neurol. 12, 207–216 (2013). - PMC - PubMed
    1. Calsolaro V., Edison P., Neuroinflammation in Alzheimer’s disease: Current evidence and future directions. Alzheimers Dement. 12, 719–732 (2016). - PubMed
    1. Ismail R., et al. ., The relationships between neuroinflammation, beta-amyloid and tau deposition in Alzheimer’s disease: A longitudinal PET study. J. Neuroinflammation 17, 151 (2020). - PMC - PubMed
    1. Kinney J. W., et al. ., Inflammation as a central mechanism in Alzheimer’s disease. Alzheimers Dement. (N. Y.) 4, 575–590 (2018). - PMC - PubMed

Publication types

MeSH terms

LinkOut - more resources