. 2021 Jun 29;12(1):3922.
doi: 10.1038/s41467-021-24077-w.

Non-invasive plasma glycomic and metabolic biomarkers of post-treatment control of HIV

Affiliations

Non-invasive plasma glycomic and metabolic biomarkers of post-treatment control of HIV

Leila B Giron et al. Nat Commun. .

Abstract

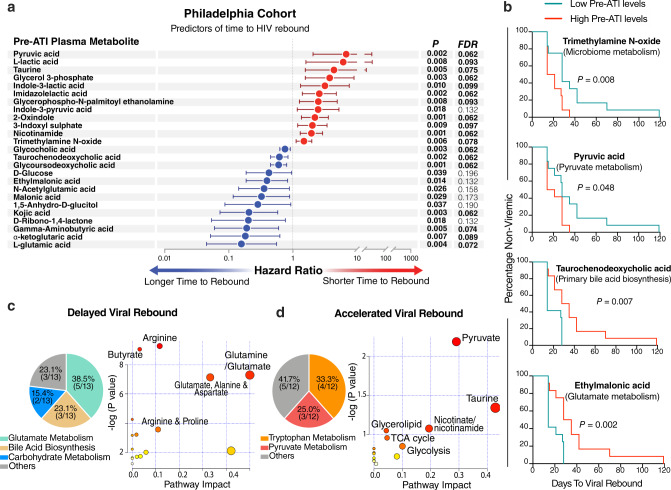
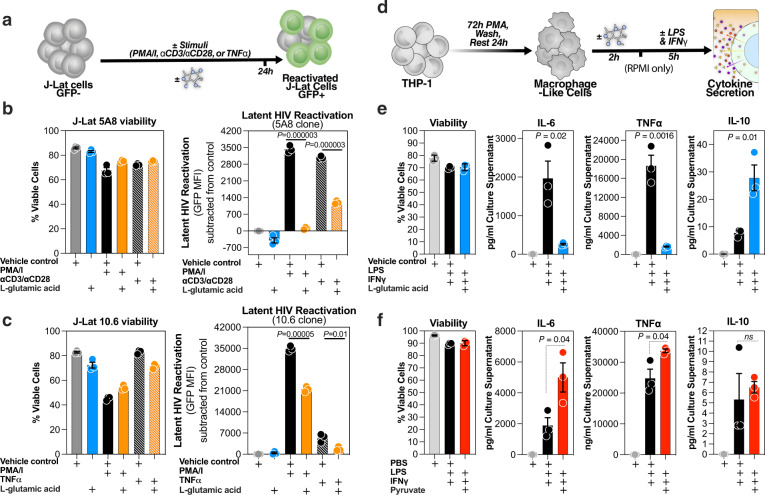
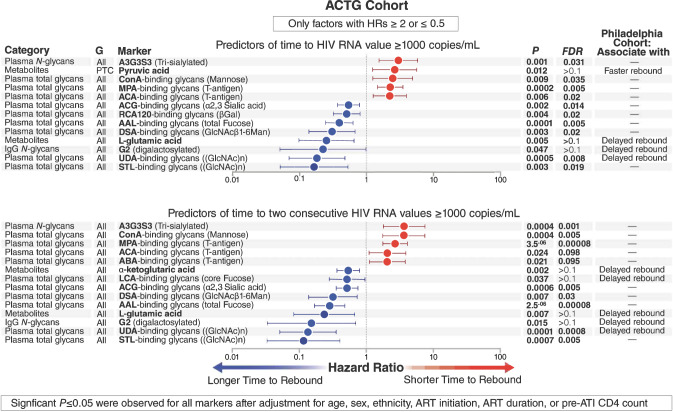
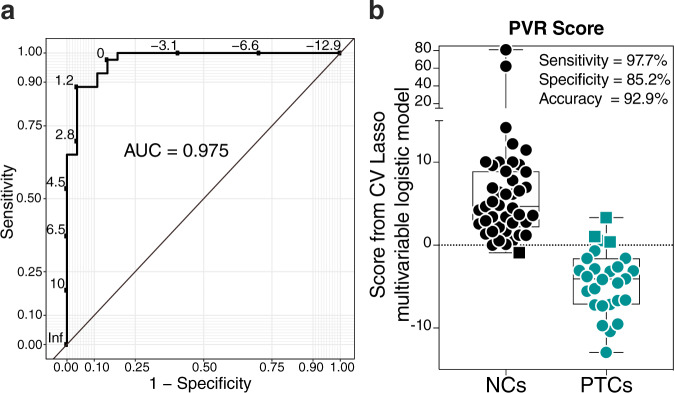
Non-invasive biomarkers that predict HIV remission after antiretroviral therapy (ART) interruption are urgently needed. Such biomarkers can improve the safety of analytic treatment interruption (ATI) and provide mechanistic insights into the host pathways involved in post-ART HIV control. Here we report plasma glycomic and metabolic signatures of time-to-viral-rebound and probability-of-viral-remission using samples from two independent cohorts. These samples include a large number of post-treatment controllers, a rare population demonstrating sustained virologic suppression after ART-cessation. These signatures remain significant after adjusting for key demographic and clinical confounders. We also report mechanistic links between some of these biomarkers and HIV latency reactivation and/or myeloid inflammation in vitro. Finally, machine learning algorithms, based on selected sets of these biomarkers, predict time-to-viral-rebound with 74% capacity and probability-of-viral-remission with 97.5% capacity. In summary, we report non-invasive plasma biomarkers, with potential functional significance, that predict both the duration and probability of HIV remission after treatment interruption.


Conflict of interest statement

The authors declare no competing interests.

Figures

Fig. 1
Fig. 1. Plasma metabolites associate with time-to-viral-rebound in the Philadelphia Cohort.
a Cox proportional-hazards model of metabolites associated with a longer (blue) or a shorter (red) time-to-viral rebound during Analytic Treatment Interruption (ATI). n = 24 biologically independent samples. Data are presented as hazard ratios with 95% confidence intervals. Two-sided P value of each independent variable in the model was used. False Discovery Rate (FDR) was calculated using Benjamini–Hochberg method to correct for multiple comparisons. b Two-sided Mantel–Cox test analysis of four selected metabolites from a. Low pre-ATI levels = lower than group median; High pre-ATI levels = higher than group median. n = 24 biologically independent samples. c Pathway analysis of the 13 metabolites (blue circles in a) whose pre-ATI levels are associated with a delayed viral rebound. Left image: a multi-analysis approach combining KEGG and STRING Interaction Network. Right image: unbiased analysis using MetaboAnalyst 3.0 (http://www.metaboanalyst.ca/) where the node color is based on P value, and the node radius is based on the pathway impact value. The pathway impact is determined by normalizing the sum of matched metabolites to the sum of all metabolites in each pathway. d Pathway analysis of the 12 metabolites (red circles in a) whose pre-ATI levels are associated with an accelerated viral rebound. Analysis was performed as in panel (c). Source data are provided as a Source Data file.
Fig. 2
Fig. 2. l-glutamic acid and pyruvate directly impact latent HIV reactivation and/or macrophage inflammation.
a JLat 5A8 or 10.6 clones were stimulated with appropriate stimuli in the presence or absence of l-glutamic acid or vehicle control (cell culture suitable HCl solution). Geometric mean fluorescence intensity (MFI) of HIV-regulated green fluorescent protein (GFP) expression was measured by flow cytometry. Cell viability was determined by LIVE/DEAD aqua staining. b J-Lat 5A8 cells (n = 3 independent experiments) and (c) J-Lat 10.6 cells (n = 3 independent experiments), were treated with PMA/I (16 nM/500 nM), ImmunoCult Human CD3/CD28 T Cell Activator (25 µl per 106 cells), or TNFα (10 ng/ml) in the presence or absence of l-glutamic acid (5 mM) or appropriate control. Bar graphs display mean ± SD values, and statistical comparisons were performed using two-tailed unpaired t-tests. d THP-1 cells (n = 3 independent experiments) were differentiated into macrophage-like cells using PMA. Cells were then treated with l-glutamic acid (5 mM), pyruvate (2 mM), or appropriate controls for 2 h prior to LPS/IFNγ stimulation for 5 h. Cell viability was determined by LIVE/DEAD aqua staining, and cytokine secretion was measured in the supernatants using ELISA and MSD platform multiplex assay (e) l-glutamic acid significantly inhibited LPS/IFNγ-mediated secretion of pro-inflammatory cytokines such as IL-6 and TNFα but significantly increased the anti-inflammatory IL-10 release. Bar graphs display mean ± SD, and statistical comparisons were performed using two-tailed unpaired t-tests. f Pyruvate significantly increased LPS/IFNγ-mediated secretion of IL-6 and TNFα. Bar graphs display mean ± SD, and statistical comparisons were performed using two-tailed unpaired t-tests. Source data are provided as a Source Data file.
Fig. 3
Fig. 3. Hazard ratios of plasma glycomic and metabolic markers that associated with time-to-viral-rebound in the ACTG Cohort.
Cox proportional-hazards model of glycomic and metabolic markers of time to (top panel) VL ≥ 1000 copies/ml or (bottom panel) two constitutive VL ≥ 1000 copies/ml within the ACTG Cohort. Data are presented as hazard ratios with 95% confidence intervals. Two-sided P value of each independent variable in the model was used. False Discovery Rate (FDR) was calculated using Benjamini–Hochberg method to correct for multiple comparisons. n = 74 biologically independent samples. G = group (All = using data from all 74 participants and PTC = using data from only the 27 PTCs within the ACTG Cohort). HRs = hazard ratios. Source data are provided as a Source Data file.
Fig. 4
Fig. 4. Mantel–Cox plots of plasma glycomic and metabolic markers that associated with time-to-viral-rebound in the ACTG Cohort.
Graphic representation of two-sided Mantel–Cox test illustrating six glycans (af) and one metabolite (g) that predicted time-to-viral-rebound in Fig. 3. Nominal P values are reported. Low pre-ATI levels = lower than the median; high pre-ATI levels = higher than the median. n = 74 biologically independent samples. Source data are provided as a Source Data file.
Fig. 5
Fig. 5. Plasma glycomic and metabolic markers of time-to-viral-rebound associate with levels of PBMC-associated HIV DNA (total, intact, and defective) and RNA in the ACTG Cohort.
a Two-sided Spearman’s correlation heat-map showing associations between markers associated with time-to-viral-rebound (in rows) and levels of cell-associated HIV DNA and RNA (measured by qPCR) or levels of intact, defective, and hypermutated HIV DNA (measured by near-full length sequencing) (in columns). The size and color of circles represent the strength of the correlation, with blue shades represent negative correlations and red shades represent positive correlations. Numbers inside the circles are nominal P values. b, c Inverse associations between pre-ATI plasma levels of total fucose and levels of pre-ATI cell-associated (b) HIV DNA or (c) HIV RNA. d Positive association between pre-ATI plasma levels of the metabolite pyruvic acid and levels of cell-associated HIV DNA. e, f Inverse associations between pre-ATI plasma levels of the metabolite l-glutamic acid and levels of intact (e) or defective (f) HIV DNA. All correlations were done using two-sides Spearman’s rank correlation coefficient tests. For all panels, n = 32, 31, 19, 19, and 19 biologically independent samples were used for correlations with total HIV DNA (by qPCR), cell-associated HIV RNA (by qPCR), intact HIV DNA (by sequencing), defective HIV DNA (by sequencing), and hypermutated HIV DNA (by sequencing), respectively. Source data are provided as a Source Data file.
Fig. 6
Fig. 6. Plasma glycomic and metabolic markers that distinguish post-treatment controllers (PTCs) from non-controllers (NCs).
Pre-ATI levels of three glycan structures are lower in PTCs compared to NCs: (a) the disialylated glycans, A2, in the IgG glycome, (b) the highly sialylated glycan structure (A3G3S3), and (c) T/Tn antigen (measured as binding to ABA lectin). Pre-ATI levels of four glycan structures were higher in PTCs compared to NCs: (d) total fucose (binding to AAL lectin) in plasma, (e, f) core fucose (binding to LCA and PSA lectins) in plasma, and (g, h) (GlcNAc)n (binding to STL and UDA lectins). Pre-ATI levels of two metabolites were higher in PTCs compared to NCs: (i) α-ketoglutaric acid and (j) l-glutamic acid. All statistical comparisons were performed using a two-sided Mann–Whitney test. Truncated violin plots showing median. False Discovery Rate (FDR) was calculated using Benjamini–Hochberg (BH) method to correct for multiple comparison in panels (af) and nominal P values are reported in panels (g, h). Source data are provided as a Source Data file.
Fig. 7
Fig. 7. A multivariable logistic model using Lasso selected variables predicts the probability of viral remission post-ATI.
The machine-learning algorithm, Lasso regularization, selected seven markers from the ten markers in Fig. 6. Analysis using this model demonstrates that when these seven markers are combined, their predictive ability is better than the predictive ability of any marker individually (Supplementary Table 9). a Receiver operator characteristic (ROC) curve showing the area under the curve (AUC) is 97.5% from the multivariable logistic regression model with seven variables. n = 70 biologically independent samples. b Coefficients from the multivariable logistic model were used to estimate risk score for each individual and then tested for the ability of these scores to accurately classify post-treatment controllers (PTCs) and non-controllers (NCs) at an optimal cut-point. The model correctly classified 97.7 of NCs (sensitivity), 85.2% of PTCs (specificity) with an overall accuracy of 92.9%. Squares represent individuals the model failed to identify correctly. The center of the box showing median with the whiskers going from each quartile (25th and 75th percentiles) to the minimum and maximum, respectively. n = 70 biologically independent samples. PVR probability of viral rebound score. Source data are provided as a Source Data file.

References

    1. Deeks SG, Barre-Sinoussi F. Public health: towards a cure for HIV. Nature. 2012;487:293–294. doi: 10.1038/487293a. - DOI - PubMed
    1. Abdel-Mohsen M, et al. Recommendations for measuring HIV reservoir size in cure-directed clinical trials. Nat. Med. 2020;26:1339–1350. doi: 10.1038/s41591-020-1022-1. - DOI - PMC - PubMed
    1. Julg B, et al. Recommendations for analytical antiretroviral treatment interruptions in HIV research trials-report of a consensus meeting. Lancet HIV. 2019;6:e259–e268. doi: 10.1016/S2352-3018(19)30052-9. - DOI - PMC - PubMed
    1. Hurst J, et al. Immunological biomarkers predict HIV-1 viral rebound after treatment interruption. Nat. Commun. 2015;6:8495. doi: 10.1038/ncomms9495. - DOI - PMC - PubMed
    1. Williams JP, et al. HIV-1 DNA predicts disease progression and post-treatment virological control. Elife. 2014;3:e03821. doi: 10.7554/eLife.03821. - DOI - PMC - PubMed

Publication types