. 2021 Jun 29;11(1):13460.
doi: 10.1038/s41598-021-92601-5.

Chromosome anchoring in Senegalese sole (Solea senegalensis) reveals sex-associated markers and genome rearrangements in flatfish

Affiliations

Chromosome anchoring in Senegalese sole (Solea senegalensis) reveals sex-associated markers and genome rearrangements in flatfish

Israel Guerrero-Cózar et al. Sci Rep. .

Abstract

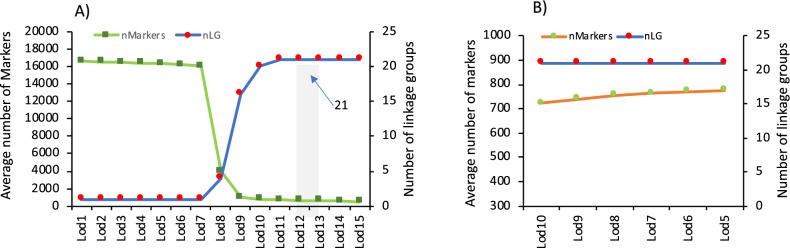
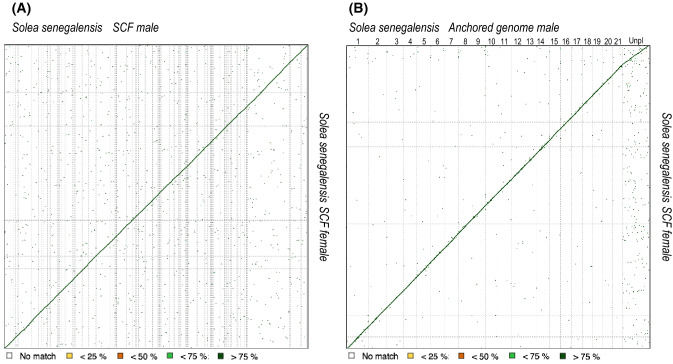
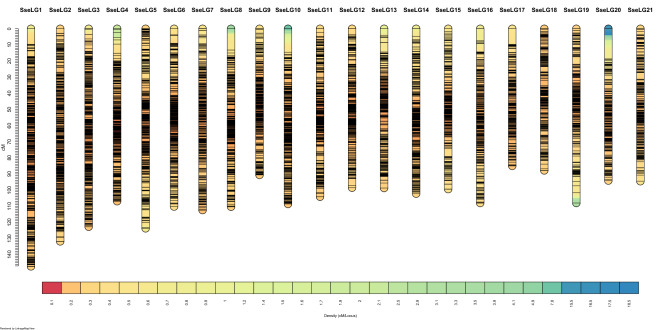
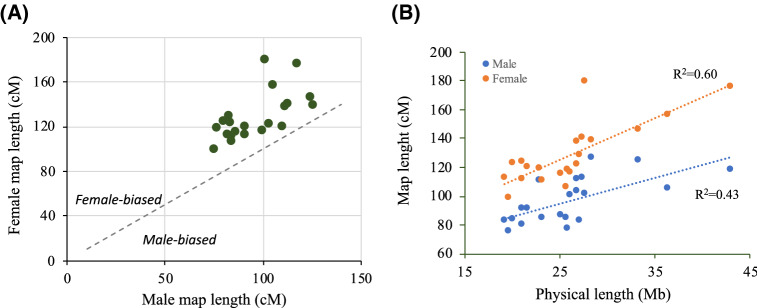
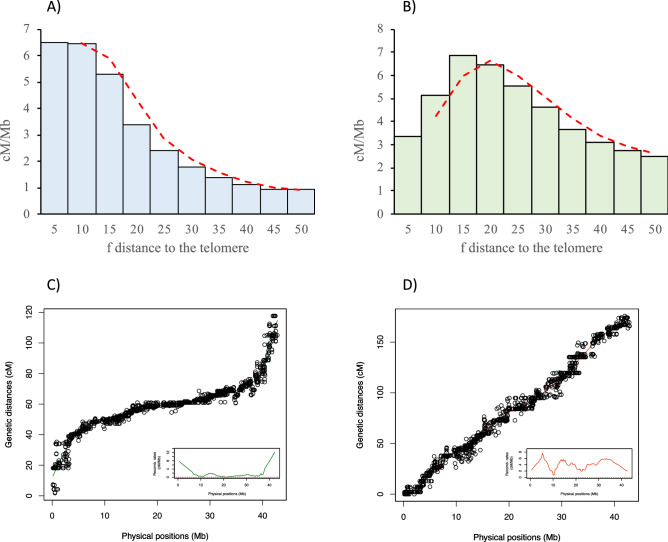
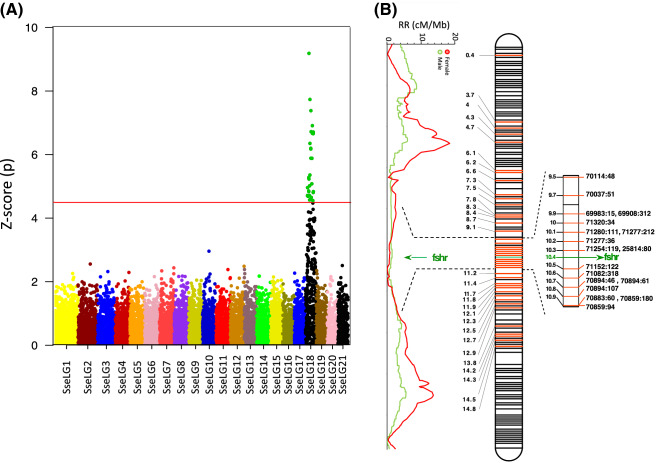
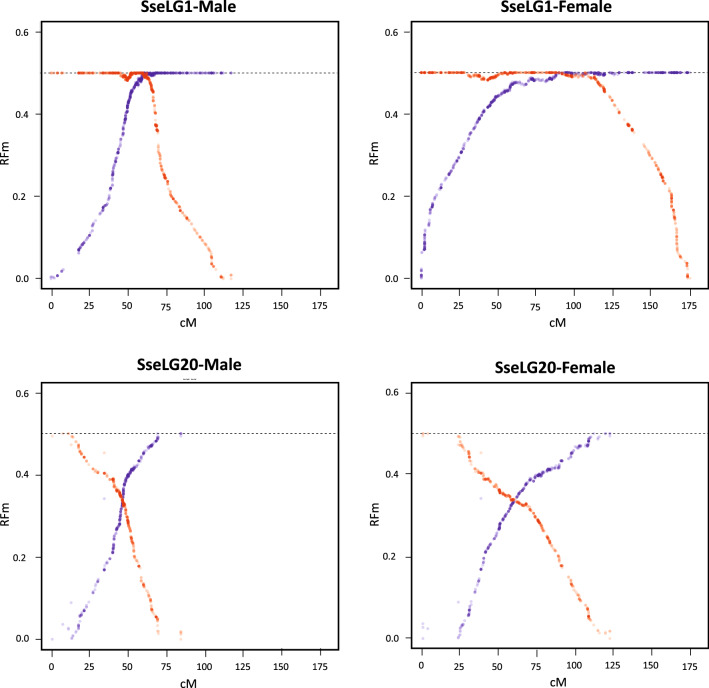
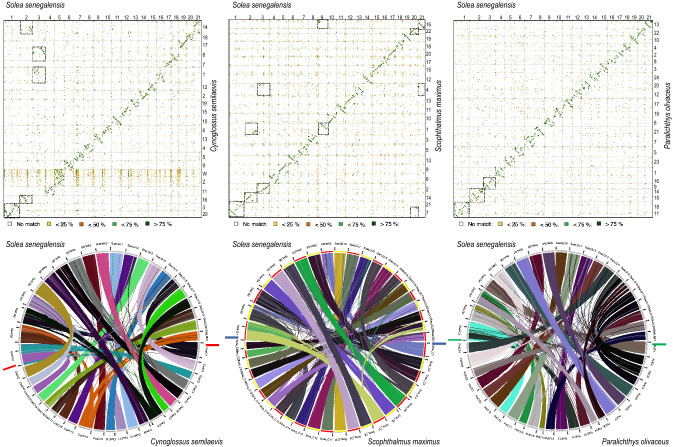
The integration of physical and high-density genetic maps is a very useful approach to achieve chromosome-level genome assemblies. Here, the genome of a male Senegalese sole (Solea senegalensis) was de novo assembled and the contigs were anchored to a high-quality genetic map for chromosome-level scaffolding. Hybrid assembled genome was 609.3 Mb long and contained 3403 contigs with a N50 of 513 kb. The linkage map was constructed using 16,287 informative SNPs derived from ddRAD sequencing in 327 sole individuals from five families. Markers were assigned to 21 linkage groups with an average number of 21.9 markers per megabase. The anchoring of the physical to the genetic map positioned 1563 contigs into 21 pseudo-chromosomes covering 548.6 Mb. Comparison of genetic and physical distances indicated that the average genome-wide recombination rate was 0.23 cM/Mb and the female-to-male ratio 1.49 (female map length: 2,698.4 cM, male: 2,036.6 cM). Genomic recombination landscapes were different between sexes with crossovers mainly concentrated toward the telomeres in males while they were more uniformly distributed in females. A GWAS analysis using seven families identified 30 significant sex-associated SNP markers located in linkage group 18. The follicle-stimulating hormone receptor appeared as the most promising locus associated with sex within a region with very low recombination rates. An incomplete penetrance of sex markers with males as the heterogametic sex was determined. An interspecific comparison with other Pleuronectiformes genomes identified a high sequence similarity between homologous chromosomes, and several chromosomal rearrangements including a lineage-specific Robertsonian fusion in S. senegalensis.


Conflict of interest statement

The authors declare no competing interests.

Figures

Figure 1
Figure 1
Selection of LOD score limit (Lod) to construct genetic map in LepMap3. (A) The average of number of markers (nMarkers) positioned in linkage groups (left Y axis) and the number of linkage groups (nLG; right Y axis) for Lod values from 1 to 15 as implemented in the "SeparateChromosomes” module. Lod11 (shaded) indicates the value selected that grouped the markers in 21 LGs. (B) Average number of markers recovered and added to the 21 LGs using decreasing LOD score iterations from 10 to 5 in the JoinSingles2 module.
Figure 2
Figure 2
Dot plot comparison of scaffolds (SCF) assembled (A) or 21 pseudo-chromosomes (B) in the male with respect to SCF in the female. Scale is indicated below.
Figure 3
Figure 3
Genetic distance (cM) and SNP distribution across 21 linkage groups (SseLG) of the Senegalese sole.
Figure 4
Figure 4
Comparison of male and female genetic maps. (A) Male vs female linkage groups lengths (cM) for the 21 Senegalese sole chromosomes. All chromosomes exhibit female-biased recombination. (B) Correlation between recombination map and physical map lengths in both males (blue) and females (orange). The determination coefficient R2 is shown separately for each sex.
Figure 5
Figure 5
Recombination landscape averaged across linkage groups for (A) male and (B) female. The recombination rates (cM/Mb) and the relative distance from the nearest telomere scaled by the chromosome length (f) is represented. The red dashed line indicates the observed tendency. Panels (C,D) show the relationship between physical and genetic distances for SseLG1 in male and female, respectively. The square inside the panels (C,D) show the specific recombination landscape. The complete information for all SseLGs is shown in Supplementary Fig. S2 and S3.
Figure 6
Figure 6
Sex-associated SNPs and RR landscape for males and females in SseLG18. (A) Manhattan plot of GWAS results for sex-associated SNPs using seven families. Significant markers are indicated in green. The horizontal red line represents the Bonferroni significance threshold. (B) Distribution of all 66 sex-associated significant markers using seven families and by family (in red, Supplementary Table S5) and RR (cM/Mb) landscape of males and females. A hot region from 9.5 to 10.9 Mb containing the candidate gene fshr is indicated on the right side. Physical positions of SseLG18 in Mb are indicated in black. Black lines indicate non-significant markers in SseLG18.
Figure 7
Figure 7
Plots illustrating the recombination frequency estimates (RFm) for intervals between markers along SseLG1 and SseLG20 in the male and female. For each LG, RFm was calculated from both chromosomal extremities (right: red circles; left: blue circles), using each of the two terminal markers as a reference starting point. The RFm plots of SseLG1 and SseLG20 show a classical metacentric and acrocentric pattern, respectively. The RFm plots of all SseLGs are illustrated in Supplementary Fig. S4.
Figure 8
Figure 8
Chromosomal alignment and synteny analysis between flatfish genomes. Top panel, Dot plot comparison of 21 pseudo-chromosomes of S. senegalensis with the genomes of the flatfish C. semilaevis (left), S. maximus (center) and P. olivaceus (right). Chromosome numbers or SseLGs are indicated. The chromosome fusions are boxed. Identity scale is indicated below. Bottom panel, syntenic comparison between flatfish genomes.

References

    1. Bouza C, et al. A microsatellite genetic map of the turbot (Scophthalmus maximus) Genetics. 2007;177:2457–2467. doi: 10.1534/genetics.107.075416. - DOI - PMC - PubMed
    1. Reid DP, et al. A genetic linkage map of Atlantic halibut (Hippoglossus hippoglossus L.) Genetics. 2007;177:1193–1205. doi: 10.1534/genetics.107.075374. - DOI - PMC - PubMed
    1. Maroso F, et al. Highly dense linkage maps from 31 full-sibling families of turbot (Scophthalmus maximus) provide insights into recombination patterns and chromosome rearrangements throughout a newly refined genome assembly. DNA Res. 2018;25:439–450. doi: 10.1093/dnares/dsy015. - DOI - PMC - PubMed
    1. Nguyen NH, Rastas PMA, Premachandra HKA, Knibb W. First high-density linkage map and single nucleotide polymorphisms significantly associated with traits of economic importance in Yellowtail Kingfish Seriola lalandi. Front. Genet. 2018;9:127. doi: 10.3389/fgene.2018.00127. - DOI - PMC - PubMed
    1. Liu ZJ, Cordes FJ. DNA marker technology and their applications in aquaculture genetics. Aquaculture. 2004;238:1–37. doi: 10.1016/j.aquaculture.2004.05.027. - DOI

Publication types