. 2021 Jun 29;11(1):13456.
doi: 10.1038/s41598-021-92644-8.

Concept for using magnetic particle imaging for intraoperative margin analysis in breast-conserving surgery

Affiliations

Concept for using magnetic particle imaging for intraoperative margin analysis in breast-conserving surgery

Erica E Mason et al. Sci Rep. .

Abstract

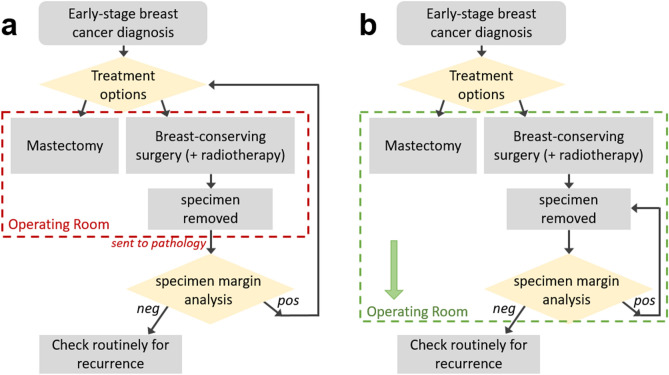
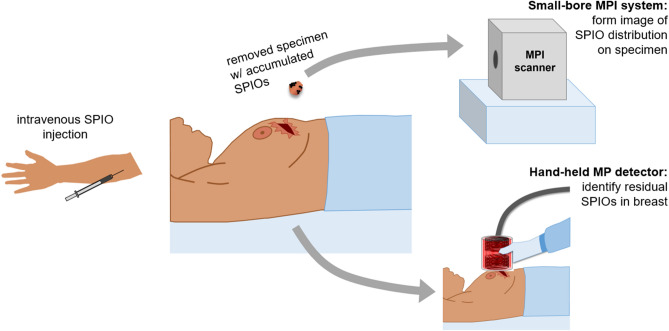
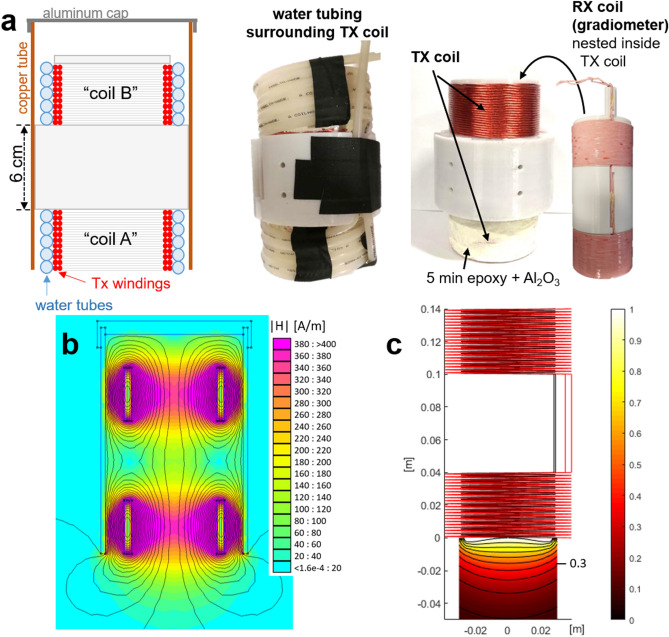
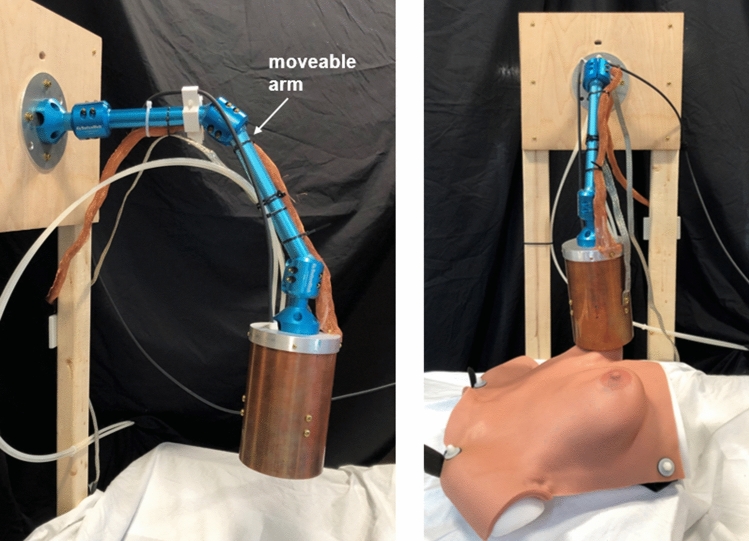
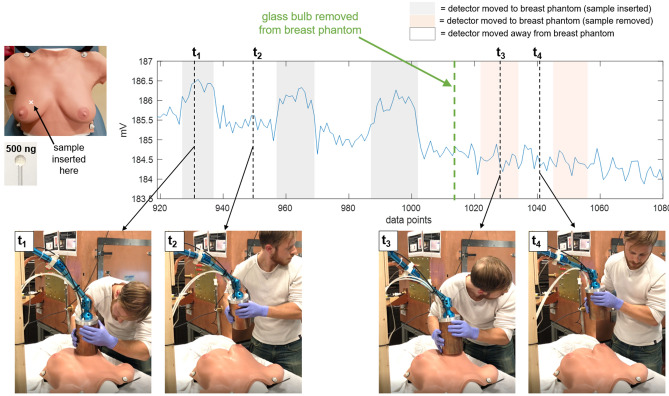
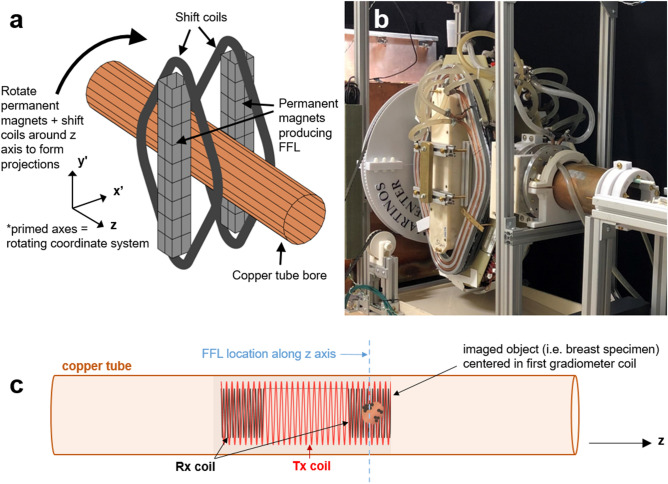
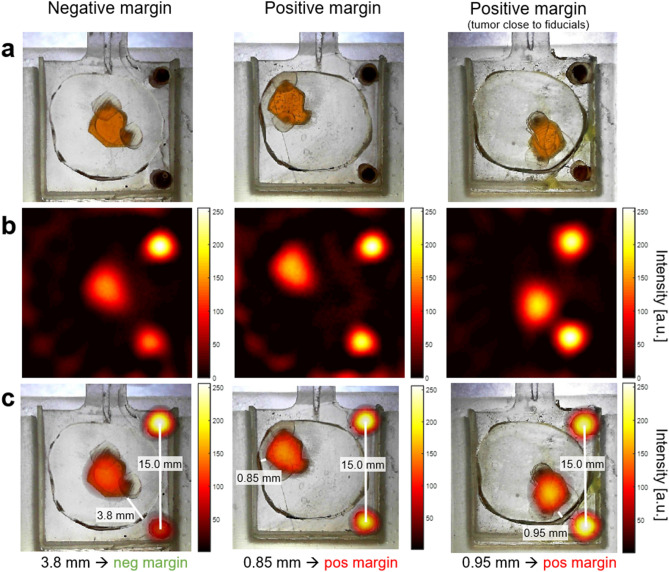
Breast-conserving surgery (BCS) is a commonly utilized treatment for early stage breast cancers but has relatively high reexcision rates due to post-surgical identification of positive margins. A fast, specific, sensitive, easy-to-use tool for assessing margins intraoperatively could reduce the need for additional surgeries, and while many techniques have been explored, the clinical need is still unmet. We assess the potential of Magnetic Particle Imaging (MPI) for intraoperative margin assessment in BCS, using a passively or actively tumor-targeted iron oxide agent and two hardware devices: a hand-held Magnetic Particle detector for identifying residual tumor in the breast, and a small-bore MPI scanner for quickly imaging the tumor distribution in the excised specimen. Here, we present both hardware systems and demonstrate proof-of-concept detection and imaging of clinically relevant phantoms.


Conflict of interest statement

The authors declare no competing interests.

Figures

Figure 1
Figure 1
Flowchart of treatment options for early stage breast cancer. (a) In current clinical practice, the lumpectomy specimen is removed; after completion of the surgery, the specimen is sent to pathology for analysis. Positive margin results require additional surgeries, either a second lumpectomy or conversion to mastectomy. In contrast, (b) shows an improved workflow, in which the specimen margin analysis happens within the operating room, mid-surgery. This would provide the surgeon with immediate feedback, enabling additional tumor removal during a single surgery for a higher likelihood of negative margins.
Figure 2
Figure 2
Envisioned MPI workflow during breast-conserving surgery. SPIOs would be injected intravenously prior to surgery with sufficient time for the nanoparticles to accumulate at the tumor and the background signal in the vasculature to be cleared. During surgery, the specimen is removed, and is placed in a small-bore MPI scanner to quickly image the distribution of SPIOs. A hand-held detector would be used at the incision site to detect residual SPIOs still in the breast, indicative of tumor remaining in the breast. Figure created using MS PowerPoint.
Figure 3
Figure 3
Hand-held MP detector. (a) A schematic of the coils and housing is shown on the far left, with coil A and B both wound on a single former, the center section of which extends to the copper tube to which is it mounted. The Tx windings are illustrated in red (as a cross-section), with water tubes wound around them. An aluminum cap shields the back end of the detector. Note the asymmetry of the coil positioning within the copper tube. Figure created using MS PowerPoint. The middle left photo shows the coils wound in water tubing (the black is tape). The middle right photo shows the Tx coil (coil A is covered in the thermally conductive, MPI-inert Al2O3 epoxy mixture, which had not yet been applied to coil B). The far right photo shows the Rx coil (gradiometer). (b) Finite element simulation (FEMM 4.2) of the Tx coils in copper tube at 25 kHz to show field-shaping effect of tube. Colormap shows H in A/m per 1 A current. (c) Custom simulation of detection sensitivity profile (Tx and Rx coils, no copper tube), using MATLAB (R2018b, https://www.mathworks.com/products/matlab.html). Tx (red coil) simulated with 25 kHz 30 Apk field, SPIO model based on measured spectrometer data of VivoTrax (Magnetic Insight, Alameda, CA) nanoparticles. Colormap normalized to 1 at center surface of detector (x, y, z) = (0, 0, 0). Iso-contour lines are shown with spacing 0.1, with the 0.3 line indicated.
Figure 4
Figure 4
MP detector mounted on moveable arm. Photos at two angles, one with the breast phantom and one without, are shown. The copper tube and aluminum cap are attached to an articulating arm made of anodized aluminum with three joints, enabling a wide range of motion so that the detector can be moved by hand to and from any desired positions. Water tubes and wires are visible and secured to the arm.
Figure 5
Figure 5
Experimental setup for surface detection. A plastic stand holds the glass bulb SPIO samples, and the detector is positioned such that the samples are approximately at the center of the surface/end plane of the coils. The detector’s mounting arm can be tightened so that it stays in place. The holder can be moved up to and away from this position in a repeatable manner. Samples between 1 µg and 100 ng Fe are tested as well as a control bulb filled only with DI H2O (data shown in Fig. 6).
Figure 6
Figure 6
Surface detection results, sample moved. Samples of VivoTrax SPIOs (Magnetic Insight, Alameda, CA) of varying concentrations in 18 µL glass bulbs are moved to (gray shaded region) and away from (not shaded) the surface/end of the detector. The transmit field at the detector’s surface is 25 kHz, 14.3 mT peak, produced with 29.5 A peak current. This is pulsed in 72 ms bursts with a 450 ms pause time, for a 16% duty cycle. The first quarter of the received pulse is discarded to remove transient effects, for a total 54 ms received pulse every 450 ms, and each data point shows the magnitude of the 3f0 frequency component of the received pulse. Preamplifier gain is 500. In post-processing, a two-term exponential magnitude drift is removed in order to overlay the trials. DI water in the same glass bulb and plastic sample holder serves as an experimental control. A plot of the measured signal magnitudes (“avg sig diff”) as a function of SPIO quantity can be found in supplementary figure S4 to illustrate the linearity of MPI signal with iron content.
Figure 7
Figure 7
Surface detection results, detector moved. Detection of a 500 ng Fe SPIO sample, for which the sample is stationary and the detector is moved by hand to and away from it. Shaded gray regions indicate when the detector is moved such that the sample is near its surface. A slow drift of a few mV in the baseline signal is apparent over the 2-min. time-series. For two time points, t1 and t2, still frames from a video of the experiment are shown. (See supplementary material S1 for video.) Each data point is the magnitude at 3f0 of the FFT of a 36 ms long time trace acquired during the application of a 48 ms long drive pulse. A 300 ms pause follows each 48 ms drive pulse. Tx amplitude is 14.3 mT peak, produced with 29.5 A peak current. Rx chain includes Ithaco 1201 preamp with G = 500 and SR650 band-pass filtering 40–99.9 kHz. No post-processing used.
Figure 8
Figure 8
Breast phantom detection results, detector moved, left breast lower outer quadrant. Detection of a 500 ng Fe SPIO sample embedded in the anthropomorphic breast phantom in the lower outer quadrant of the left breast. The detector is held by hand and moved around during data acquisition to and away from the breast at the sample’s location. Four time points (t1–t4) are selected to show still frames from a video of the experiment. (See S2 for video.) The SPIO sample (in glass bulb) is removed from the breast phantom at data point 855 (thick green dashed line). The acquisition scheme, receive chain setup, and data analysis are the same as described in the caption of Fig. 7.
Figure 9
Figure 9
Breast phantom detection results, detector moved, right breast upper inner quadrant. Detection of a 500 ng Fe SPIO sample embedded in the anthropomorphic breast phantom in the upper inner quadrant of the right breast. The detector is held by hand and moved around during data acquisition to and away from the breast at the sample’s location. Four time points (t1–t4) are selected to show still frames from a video of the experiment. (See S3 for video.) The SPIO sample (in glass bulb) is removed from the breast phantom at data point 1016 (thick green dashed line). The acquisition scheme, receive chain setup, and data analysis are the same as described in the caption of Fig. 7.
Figure 10
Figure 10
Small-bore imager. (a) Schematic of imager, showing the permanent and electromagnet hardware (permanent magnets and shift coils) which rotates about the copper tube bore with the illustrated (x,y,z) coordinate system. Figure made using MATLAB (R2018b, https://www.mathworks.com/products/matlab.html). (b) Photo of the imager. The permanent magnets are in an ABS plastic housing, the diamond-shaped shift coils are covered by copper tubing for water cooling (fitted in a milled aluminum plate), and the large gear (3D printed plastic) used to rotate the hardware can be seen behind them. (c) The Tx coil (red) and gradiometer Rx coil (black) are illustrated within the copper tube; the tube axis is along z. A dashed blue line indicates the imaging plane, i.e., the location of the FFL. The object to be imaged (excised breast specimen), is positioned in the first of the two gradiometer coils. Figure created with MS PowerPoint and MATLAB (R2018b, https://www.mathworks.com/products/matlab.html).
Figure 11
Figure 11
Lumpectomy specimen phantoms, MPI images, and co-registration. (a) Optical images of lumpectomy specimen phantoms. The “tumor” is a cavity with a maximum diameter of 6.5 mm filled with 0.5 mg/mL VivoTrax (51.2 µg total Fe quantity). The fiducials are 1.75 mm diameter cylinders filled with undiluted (5.5 mg/mL) VivoTrax (61.1 µg total Fe quantity). The “healthy tissue” is 3D print material containing no SPIOs. Negative margin is defined as tumor > 1 mm from specimen’s surface; positive margin is defined as tumor 1 mm from surface. (b) Each MPI image is acquired in 10.7 s using a triangular-waveform shift field with 27 projections, 66 readouts per projection, and 150 Tx cycles per readout. Receive chain has total G = 1000. Image reconstructed with model-based preconditioned conjugate gradient recon. Each MPI image is scaled to its individual maximum. (c) MPI images from (b) are co-registered with the optical images of the phantoms from (a) using the fiducial locations. The distances between the tumor edge and the specimen margin are measured (using the Distance Tool in MATLAB (R2018b, https://www.mathworks.com/products/matlab.html)), correctly classifying the specimen phantoms as negative or positive.

Similar articles

Cited by

References

    1. Bray F, et al. Global cancer statistics 2018: GLOBOCAN estimates of incidence and mortality worldwide for 36 cancers in 185 countries. CA Cancer J. Clin. 2018;68:394–424. doi: 10.3322/caac.21492. - DOI - PubMed
    1. Kummerow KL, Du L, Penson DF, Shyr Y, Hooks MA. Nationwide trends in mastectomy for early-stage breast cancer. JAMA Surg. 2015;150:9–16. doi: 10.1001/jamasurg.2014.2895. - DOI - PubMed
    1. Fisher B, et al. Twenty-year follow-up of a randomized trial comparing total mastectomy, lumpectomy, and lumpectomy plus irradiation for the treatment of invasive breast cancer. N. Engl. J. Med. 2002;347:1233–1241. doi: 10.1056/NEJMoa022152. - DOI - PubMed
    1. Jacobson JA, et al. Ten-year results of a comparison of conservation with mastectomy in the treatment of stage i and ii breast cancer. N. Engl. J. Med. 1995;332:907–911. doi: 10.1056/NEJM199504063321402. - DOI - PubMed
    1. Gage I, et al. Pathologic margin involvement and the risk of recurrence in patients treated with breast-conserving therapy. Cancer. 1996;78:1921–1928. doi: 10.1002/(SICI)1097-0142(19961101)78:9<1921::AID-CNCR12>3.0.CO;2-#. - DOI - PubMed

Publication types