Clinical Trial
. 2021 Jun 29;11(1):13447.
doi: 10.1038/s41598-021-92890-w.

Uncovering complexity details in actigraphy patterns to differentiate the depressed from the non-depressed

Affiliations
Clinical Trial

Uncovering complexity details in actigraphy patterns to differentiate the depressed from the non-depressed

Sandip Varkey George et al. Sci Rep. .

Abstract

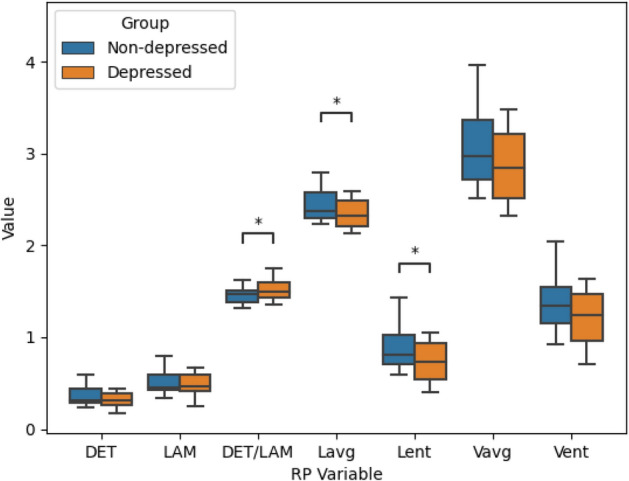
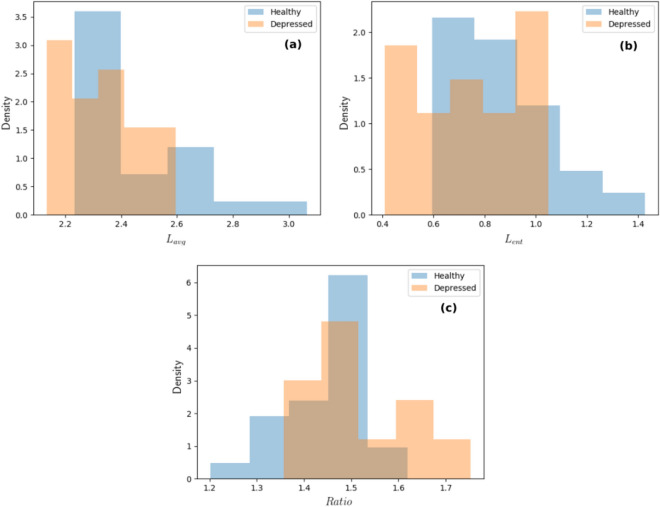
While the negative association between physical activity and depression has been well established, it is unclear what precise characteristics of physical activity patterns explain this association. Complexity measures may identify previously unexplored aspects of objectively measured activity patterns, such as the extent to which individuals show repetitive periods of physical activity and the diversity in durations of such repetitive activity patterns. We compared the complexity levels of actigraphy data gathered over 4 weeks ([Formula: see text] data points each) for every individual, from non-depressed ([Formula: see text]) and depressed ([Formula: see text]) groups using recurrence plots. Significantly lower levels of complexity were detected in the actigraphy data from the depressed group as compared to non-depressed controls, both in terms of lower mean durations of periods of recurrent physical activity and less diversity in the duration of these periods. Further, diagnosis of depression was not significantly associated with mean activity levels or measures of circadian rhythm stability, and predicted depression status better than these.


Conflict of interest statement

The authors declare no competing interests.

Figures

Figure 1
Figure 1
Schematic describing the construction of a recurrence plot. The upper panel shows the series of observations vs time. A region centered on the first data point, with width 2ϵ is shaded in blue. The lower panel shows the corresponding recurrence plot. The elements of the recurrence plot corresponding to the first point are shaded in blue, in the lower panel. When a point falls within the blue rectangle in the upper panel, it is shown as a black point in the lower panel. This analysis is repeated for every point in the time series resulting in the complete recurrence plot. The x and y axes of the recurrence plot represent the time of observation (x axis of the upper panel). Hence, when an observation y(t1) at time t1 and y(t2) at time t2 are within ϵ distance of each other, the point (t1,t2) is marked in black in the recurrence plot.
Figure 2
Figure 2
Flowchart indicating the analysis procedure, described in this paper, to extract recurrence plot measures from actigraphy data.
Figure 3
Figure 3
Sample time series and corresponding recurrence plots for (a) a pure sine wave (b) random noise (c) sine wave contaminated with additive white noise with signal to noise ratio (SNR) 5 and (d) sine wave contaminated with additive white noise with signal to noise ratio (SNR) 1. A higher SNR implies that the signal is more prominent as compared to the noise.
Figure 4
Figure 4
Sample recurrence plots for two individuals. (a) Shows the recurrence plot constructed from a non-depressed individual and (b) shows one constructed from a depressed individual.
Figure 5
Figure 5
Box plots showing the differences between the non-depressed and depressed groups for the different recurrence plot variables. Significant differences (p<.05) are marked with asterisks ().
Figure 6
Figure 6
Histograms showing the difference in (a) mean diagonal length, (b) entropy and (c) ratio of determinism to laminarity between the non-depressed and depressed groups.

References

    1. Dunn, A. L., Trivedi, M. H. & O’Neal, H. A. Physical activity dose-response effects on outcomes of depression and anxiety. In Database of Abstracts of Reviews of Effects (DARE): Quality-assessed Reviews [Internet] (Centre for Reviews and Dissemination (UK), 2001). - PubMed
    1. Rebar AL, et al. A meta-meta-analysis of the effect of physical activity on depression and anxiety in non-clinical adult populations. Health psychology review. 2015;9:366–378. doi: 10.1080/17437199.2015.1022901. - DOI - PubMed
    1. Teychenne M, Ball K, Salmon J. Sedentary behavior and depression among adults: a review. International journal of behavioral medicine. 2010;17:246–254. doi: 10.1007/s12529-010-9075-z. - DOI - PubMed
    1. Marques A, et al. Cross-sectional and prospective relationship between physical activity and depression symptoms. Scientific reports. 2020;10:1–8. doi: 10.1038/s41598-019-56847-4. - DOI - PMC - PubMed
    1. Weyerer S, Kupfer B. Physical exercise and psychological health. Sports Medicine. 1994;17:108–116. doi: 10.2165/00007256-199417020-00003. - DOI - PubMed

Publication types