. 2021 Jun 29;4(1):814.
doi: 10.1038/s42003-021-02305-9.

Attention expedites target selection by prioritizing the neural processing of distractor features

Affiliations

Attention expedites target selection by prioritizing the neural processing of distractor features

Mandy V Bartsch et al. Commun Biol. .

Abstract

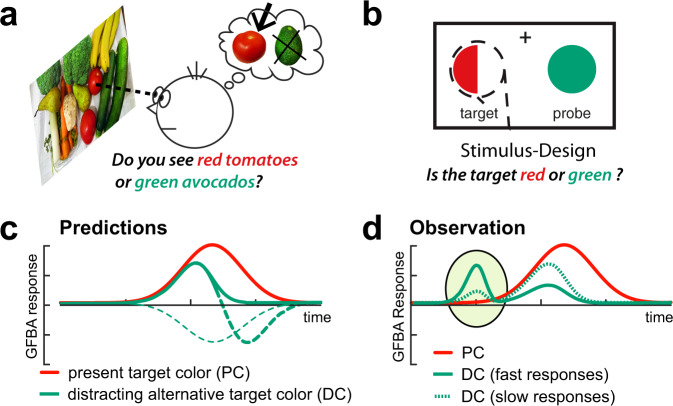
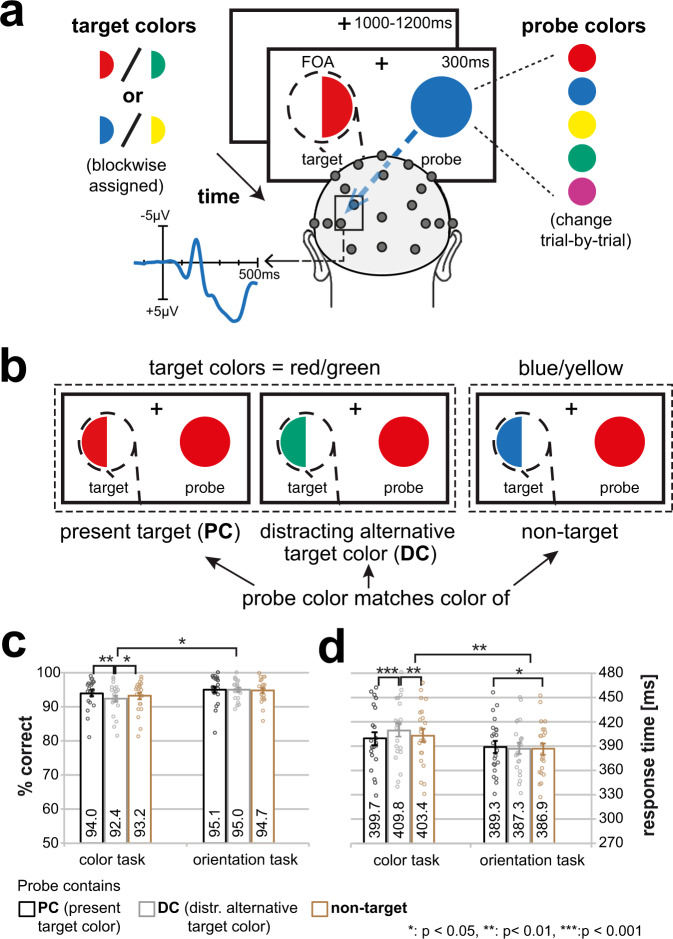
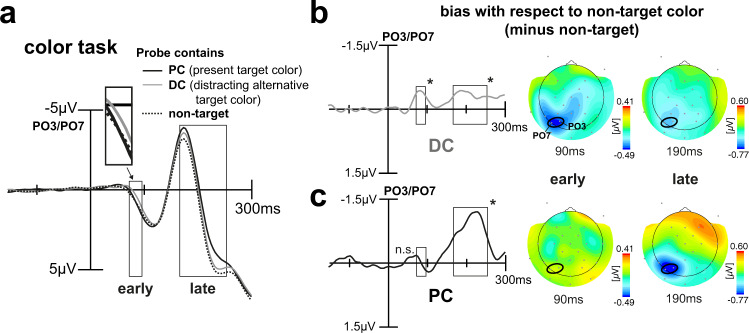
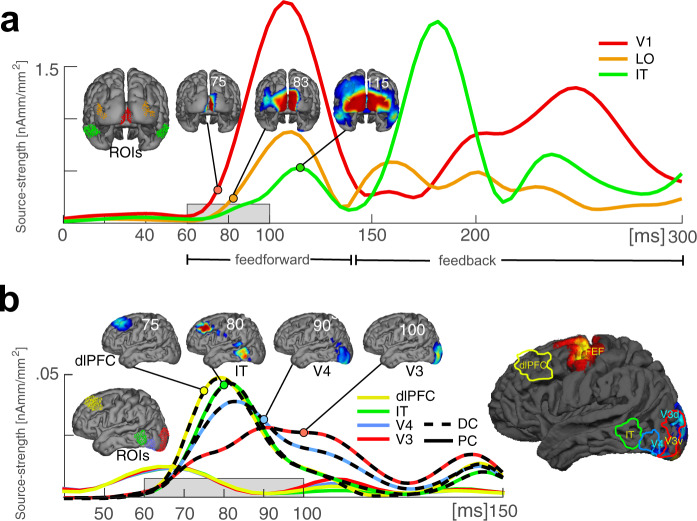
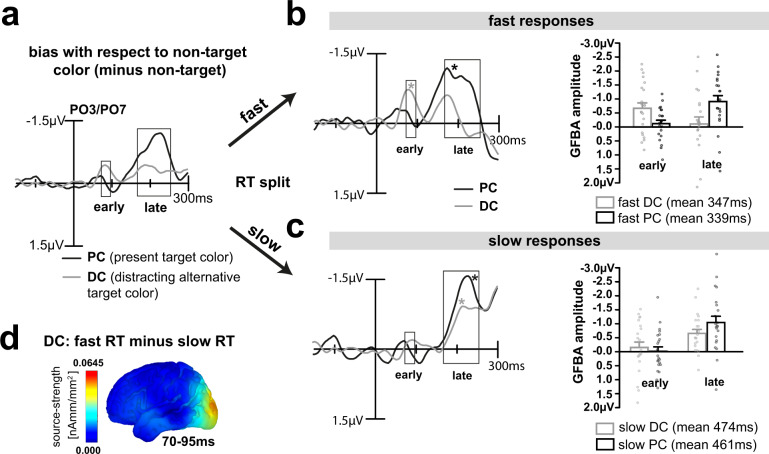
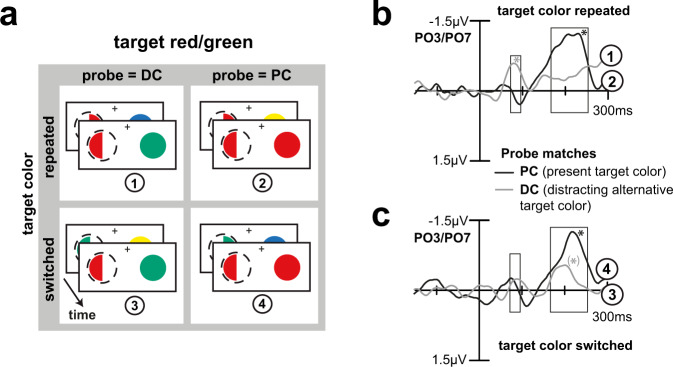
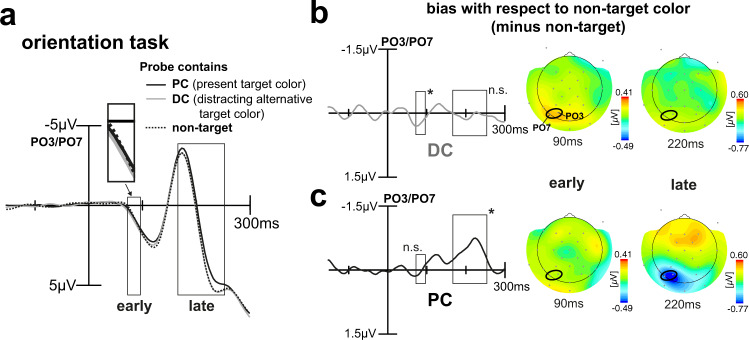
Whether doing the shopping, or driving the car - to navigate daily life, our brain has to rapidly identify relevant color signals among distracting ones. Despite a wealth of research, how color attention is dynamically adjusted is little understood. Previous studies suggest that the speed of feature attention depends on the time it takes to enhance the neural gain of cortical units tuned to the attended feature. To test this idea, we had human participants switch their attention on the fly between unpredicted target color alternatives, while recording the electromagnetic brain response to probes matching the target, a non-target, or a distracting alternative target color. Paradoxically, we observed a temporally prioritized processing of distractor colors. A larger neural modulation for the distractor followed by its stronger attenuation expedited target identification. Our results suggest that dynamic adjustments of feature attention involve the temporally prioritized processing and elimination of distracting feature representations.


Conflict of interest statement

The authors declare no competing interests.

Figures

Fig. 1
Fig. 1. Dynamics of attentional color biasing.
a Motivation. When searching for both red and green items, not knowing what we will encounter first, our brain must decide ‘on the fly’ which color is currently contained in a target object (here: red) and which color would be rather distracting (here: green), and adjust the color bias in the brain accordingly. b Experimental idea. To investigate this color biasing dynamic independent of other influences like object location, we created simplified stimuli where the target location was fixed, but its color changed unpredictably between two colors (see Fig. 2 for details). c Predictions. The color selection bias in the brain was assessed as the amplitude of the global feature-based attention (GFBA) response to that color (for details see Methods). Participants may initially bias both possible target colors (here: red and green). The response to the distracting color alternative (DC, here: green), will then decay (green solid) as the neural bias for this color declines in favor of the present target color (PC). Alternatively, the DC might become actively suppressed below baseline either with a delay (green thick dashed), or right from the beginning of the GFBA modulation (green thin dashed). d Observation. Contrary to our predictions, the processing of the distracting target color alternative (DC, green) gained temporal priority (marked by the ellipse). On trials with a fast response time—i.e., fast identification of the target’s color—participants showed a prominent early selection of the DC followed by its stronger attenuation in the time range of maximal biasing of the present target color (PC, red). For slow responses (green dashed), the early response to the DC and its subsequent attenuation were less pronounced.
Fig. 2
Fig. 2. Experimental design and behavioral results.
a Participants attended to a colored hemicircle presented in the left VF (dashed line = spatial focus of attention, FOA) and reported by button press either its color (color task blocks) or the side (left/right) of its convexity (orientation task blocks). The target varied trial-by-trial unpredictably between the two blockwise-assigned target colors (i.e., between red and green, or between blue and yellow). On each trial, the color probe simultaneously presented in the right VF was randomly drawn from five colors (red, green, blue, yellow, and magenta). The effects of global feature-based attention (GFBA)—as a measure for attentional color selectivity in the visual cortex—were assessed by comparing the event-related brain response elicited by an unattended color probe as a function of whether it matched the present target (PC), the distracting alternative target color (DC), or neither of them (non-target). b Trial types. The probe (here: red) could either contain the PC, the DC (here: red probe but green target in an attend red/green block), or could represent a non-target color currently not relevant (here: red probe in an attend blue/yellow block). Behavioral performance. Shown are the percentage of correct responses c and response times d of both the color and the orientation task for all trial types. Participants (n = 22) responded highly accurately and fast across all conditions. However, the performance was slightly lower in the color task, most prominent as a response delay on trials where the probe matched the distracting alternative target color (DC, gray bars). The error bars represent the standard error of the mean (SEM). Black, gray and brown dots represent data points of individual participants.
Fig. 3
Fig. 3. ERP results for the color task.
a Shown is the ERP elicited by the probe at PO3/PO7 (signal averaged) for the different trial types when participants (n = 22, signal averaged) were to discriminate the color of the target. Rectangles highlight time ranges of significant brain response variations as derived by the 2×3 rANOVA. Surprisingly, participants show a pretty early modulation (higher relative negativity around 73–96 ms) for the DC (gray line), see inset for an amplified depiction. Significant modulation for the color of the PC emerges later (167–254 ms). Difference waveforms for DC minus non-target color (b) and PC minus non-target color (c). The respective topographical field maps on the right display representative time points at early and late modulation maxima, positions of electrodes used for analyses are highlighted (black ellipses). In the early time range, there is a prominent modulation for the DC but not the PC. In the late time range, this pattern becomes inverted with a strong modulation for the PC and a comparably small modulation for the DC.
Fig. 4
Fig. 4. Time course of cortical current source activity for the color task.
a Shown is the propagation of stimulus-elicited activity in the visual cortex after stimulus onset (current source activity of the average across target (PC), non-target and distractor (DC) color probes; signal averaged across participants (n = 22)). The waveforms show time courses of source strength at selected ROIs (red: primary visual cortex, orange: lateral occipital (LO) cortex, and green: IT cortex) (see Methods). Small 3D views show current source-density maps at selected time points illustrating the initial feedforward sweep of processing. b Time course of the source activity underlying the very early distractor selection (DC minus non-target, color dashed, shown between 40 and 150 ms) at selected ROIs depicted in middle-sized and large 3D view (yellow: dorsolateral prefrontal cortex, green: IT cortex, blue: V4, and red: V3). For target-colored probes, the time course of source activity at the respective ROIs does not show comparable modulations (PC minus non-target, color solid). Small 3D views show source-density maps at selected time points illustrating the prefrontral-to-ventral extrastriate propagation of the DC biasing. As can be seen, the very early selection bias for the distracting color appears already during the initial feedforward sweep of information processing (compare time range highlighted by gray horizontal rectangles in a and b).
Fig. 5
Fig. 5. Median response time-split analysis.
a Difference waveforms for the PC (black) and DC (gray) replotted together from Fig. 3b, c for better comparison. Rectangles indicate previously determined early and late time ranges of significant experimental variation. Median split into fast (b) and slow (c) response times (RT) for DC (gray) and PC (black). ERPs: fast and slow minus non-target difference waveforms averaged across participants (n = 22). Stars indicate significant mean amplitude modulations in the early and late time ranges (p < 0.05). An explorative sample-by-sample sliding t-test (0–100 ms, 11.8-ms window) found no effect for fast PC trials within or before the early time window. Bar graphs: mean GFBA amplitudes of the early and late time range are shown for fast (b) and slow (c) responses. For DC, the early negativity was higher when participants responded fast compared to slow, which was inversely correlated to the size of the late bias (significant early/late GFBA amplitude × fast/slow RT interaction, p = 0.00035, see text for details). For the PC, in contrast, there was no significant difference in GFBA amplitudes between fast and slow responses but always a strong late bias. The error bars represent the standard error of the mean (SEM). Black and gray dots represent data points of individual participants. d 3D current source-density map for the early DC biasing (fast RT trials minus slow RT trials) between 70 and 95 ms (25-ms average). As can be seen, differences in source activity for fast and slow DC trials emerge in posterior extrastriate visual cortex (around V3).
Fig. 6
Fig. 6. Target repetition analysis.
a Trials in which the probe contained the DC, or the PC were sorted according to whether the color of the previous target was repeated (stronger priming-driven color bias for the PC), or switched (weaker priming-driven color bias for the PC). Here exemplarily shown for trials of an attend red/green block and a red target. Difference waveforms (minus non-target) for PC (black) and DC (gray) probes for repeat (b) and switch (c) trials, signal averaged across participants (n = 22). Rectangles indicate previously determined time ranges of early and late color biasing. A stronger priming-driven bias for the PC (repeat trials) entailed a pronounced early modulation for the DC (p = 0.0130), which was much smaller and not statistically significant on switch trials (p = 0.2761). Corroborating the response time split (see Fig. 5), a strong early processing of the DC was followed by its weaker selection in the late GFBA time range and linked to faster target identification. Stars indicate significant mean amplitude modulations in the indicated time ranges (p < 0.05), the late GFBA response for DC under switch conditions (c, gray line) was only significant when considering a shorter time window (i.e., from 167 to 210 ms).
Fig. 7
Fig. 7. ERP results for the orientation task.
a Shown is the ERP elicited by the probe at PO3/PO7 (signal averaged) for the different trial types when participants (n = 22, signal averaged) were to discriminate the orientation of the target. Rectangles highlight time ranges of significant brain response variations as previously derived by the 2 × 3 rANOVA. This time, participants show no relative negativity for the DC (gray line), see inset for an amplified depiction. Again, there is a late negativity for the color of the present target object (PC) (167–254 ms). Difference waveforms for DC minus non-target (b) and PC minus non-target (c). The respective topographical field maps on the right display representative time points at early and late modulation maxima with the positions of the electrodes used for the analyses being highlighted (black ellipses). The difference waveforms reveal a small positive modulation for color in the early time range and a late enhancement (higher negativity in the N1/N2 time range) that is present for the color of the object being under discrimination only.

References

    1. Wolfe JM. Guided Search 2.0 A revised model of visual search. Psychonomic Bull. Rev. 1994;1:202–238. doi: 10.3758/BF03200774. - DOI - PubMed
    1. Wolfe JM, Horowitz TS. What attributes guide the deployment of visual attention and how do they do it? Nat. Rev. Neurosci. 2004;5:495–501. doi: 10.1038/nrn1411. - DOI - PubMed
    1. Andersen SK, Hillyard SA, Müller MM. Global facilitation of attended features is obligatory and restricts divided attention. J. Neurosci. 2013;33:18200–18207. doi: 10.1523/JNEUROSCI.1913-13.2013. - DOI - PMC - PubMed
    1. Andersen SK, Fuchs S, Müller MM. Effects of feature-selective and spatial attention at different stages of visual processing. J. Cogn. Neurosci. 2011;23:238–246. doi: 10.1162/jocn.2009.21328. - DOI - PubMed
    1. Bartsch MV, et al. Determinants of global color-based selection in human visual cortex. Cereb. Cortex. 2015;25:2828–2841. doi: 10.1093/cercor/bhu078. - DOI - PubMed

Publication types