. 2021 Jun;53(6):1092-1108.
doi: 10.1038/s12276-021-00643-6. Epub 2021 Jun 29.

Disruption of nucleocytoplasmic trafficking as a cellular senescence driver

Affiliations

Disruption of nucleocytoplasmic trafficking as a cellular senescence driver

Ji-Hwan Park et al. Exp Mol Med. 2021 Jun.

Abstract

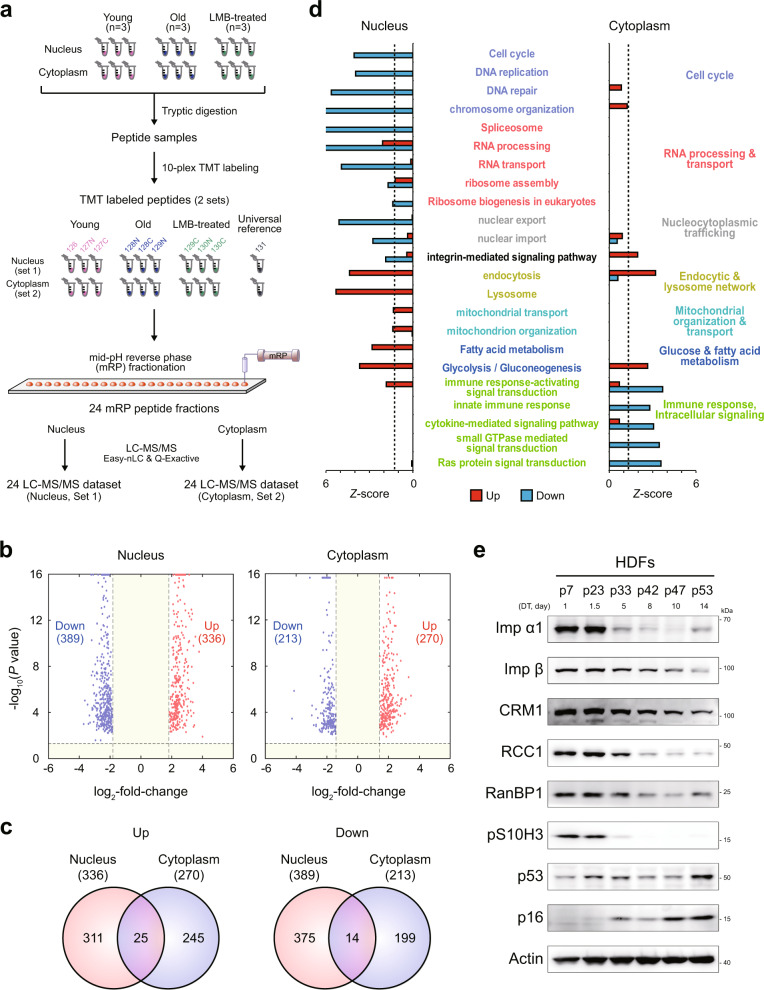
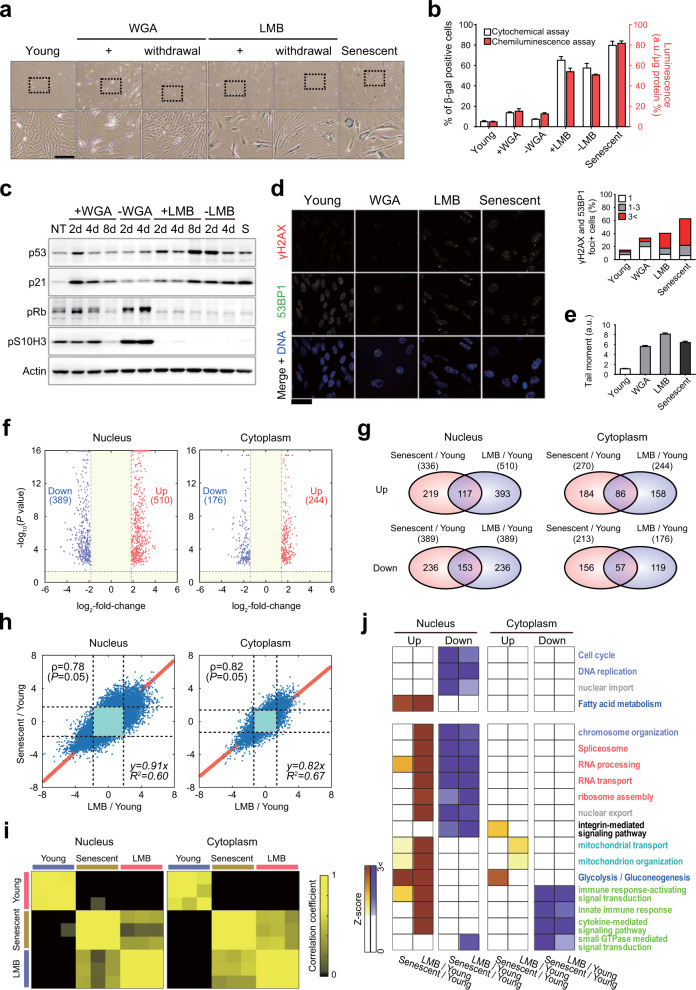
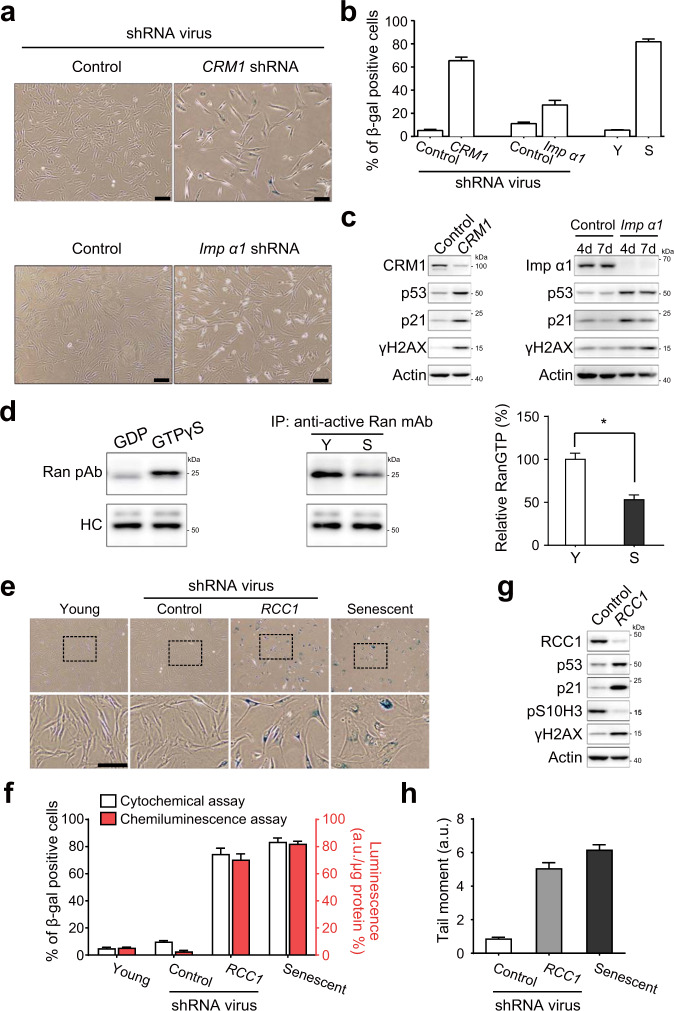
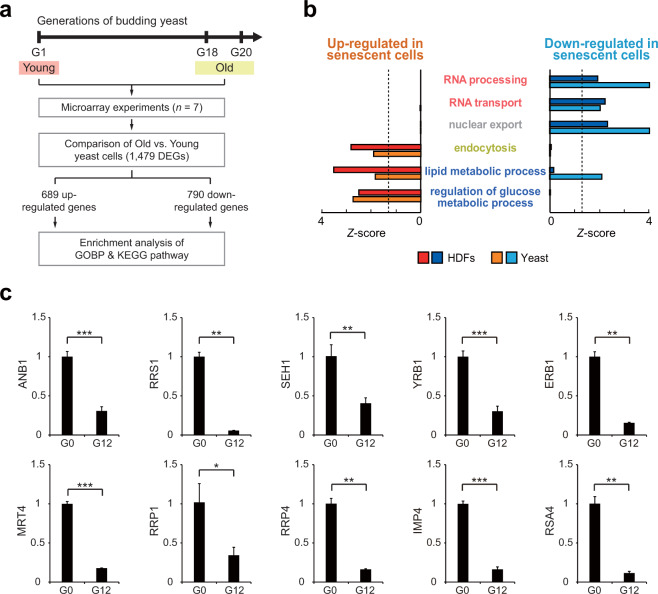
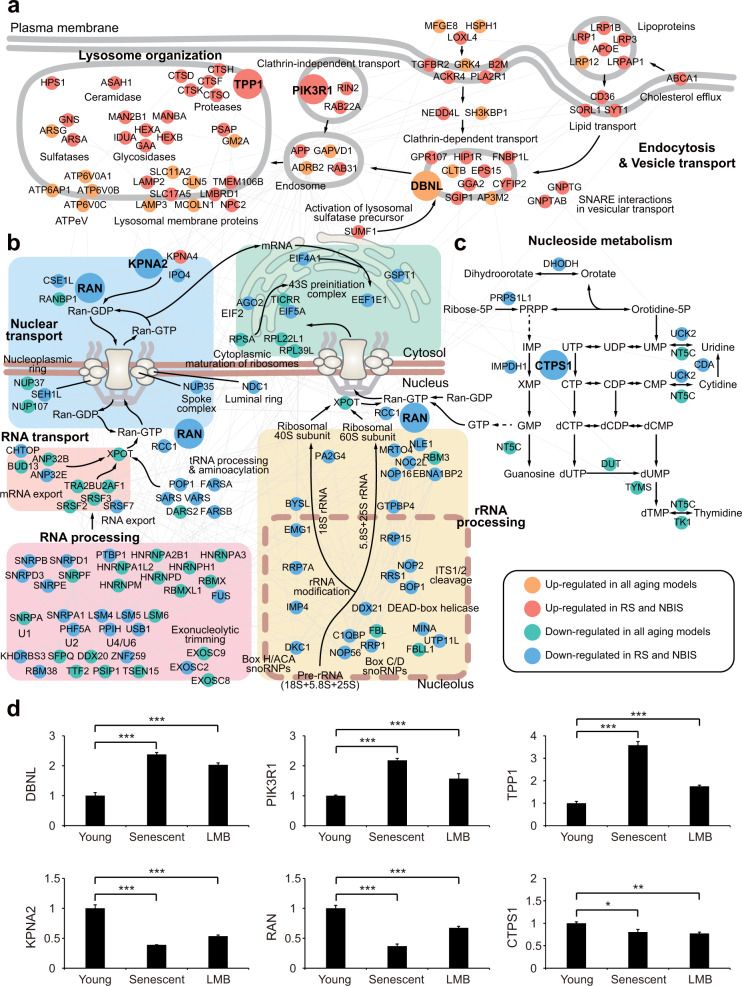
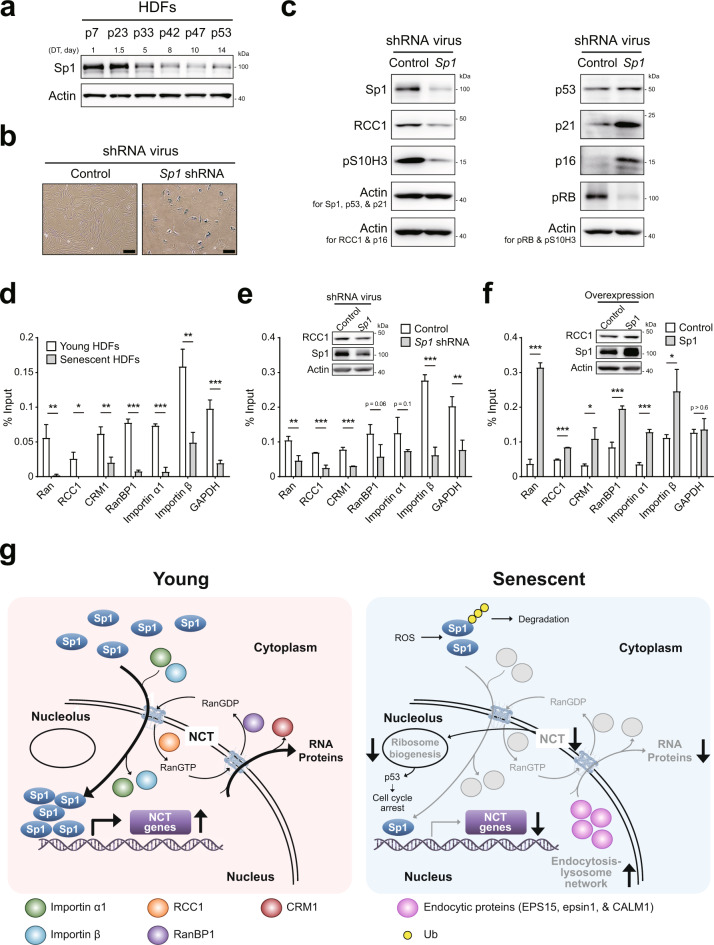
Senescent cells exhibit a reduced response to intrinsic and extrinsic stimuli. This diminished reaction may be explained by the disrupted transmission of nuclear signals. However, this hypothesis requires more evidence before it can be accepted as a mechanism of cellular senescence. A proteomic analysis of the cytoplasmic and nuclear fractions obtained from young and senescent cells revealed disruption of nucleocytoplasmic trafficking (NCT) as an essential feature of replicative senescence (RS) at the global level. Blocking NCT either chemically or genetically induced the acquisition of an RS-like senescence phenotype, named nuclear barrier-induced senescence (NBIS). A transcriptome analysis revealed that, among various types of cellular senescence, NBIS exhibited a gene expression pattern most similar to that of RS. Core proteomic and transcriptomic patterns common to both RS and NBIS included upregulation of the endocytosis-lysosome network and downregulation of NCT in senescent cells, patterns also observed in an aging yeast model. These results imply coordinated aging-dependent reduction in the transmission of extrinsic signals to the nucleus and in the nucleus-to-cytoplasm supply of proteins/RNAs. We further showed that the aging-associated decrease in Sp1 transcription factor expression was critical for the downregulation of NCT. Our results suggest that NBIS is a modality of cellular senescence that may represent the nature of physiological aging in eukaryotes.


Conflict of interest statement

The authors declare no competing interests.

Figures

Fig. 1
Fig. 1. Proteomic analysis reveals the presence of a nuclear barrier in senescent cells.
a Overall scheme of proteomic analysis of nuclear and cytoplasmic fractions of young, senescent (RS), and leptomycin B-treated (LMB-NBIS) HDFs. Three biological replicates (n = 3) were analyzed. Sets 1 and 2, nuclear and cytoplasmic fractions, respectively; tandem mass tag (TMT) 126, 127N, and 127C for young HDFs; TMT 128N, 128C, and 129N for RS; and TMT 129C, 130N, and 130C for LMB-NBIS. b Volcano plots showing upregulated (red) and downregulated (blue) proteins in the nucleus (left) and cytoplasm (right). c Relationships between upregulated (left) or downregulated (right) proteins in the nucleus and cytoplasm of RS. d Cellular processes (GOBPs) significantly (P < 0.1) enriched by upregulated (red) or downregulated (blue) genes in RS. The Z-score indicates –N-1(P), where P is the enrichment P value determined with DAVID software and N−1(·) is the inverse normal distribution. e Immunoblot of NCT-related proteins using whole-cell lysates of HDFs at different passages during senescence. Doubling times (DTs) corresponding to passage numbers are shown.
Fig. 2
Fig. 2. A chemically induced nuclear barrier leads to RS-like senescence.
a HDFs stained for SA β-gal activity by the cytochemical (X-gal) method. Young HDFs were treated with 6 μg/ml wheat germ agglutinin (WGA) or 0.1 μg/ml leptomycin B (LMB) for 8 days and then cultured for an additional 4 days after WGA and LMB removal. Bottom panels show 3× magnified versions of images, as indicated by the dashed box on top. Scale bar, 50 μm. b Percentages of β-gal-positive cells (n > 200 cells). Left (white) and right (red) bars indicate the percentages estimated by cytochemical and chemiluminescence assays, respectively. The means ± SD (n = 3) are reported; a.u., arbitrary unit. c Immunoblot using whole-cell lysates of young HDFs (NT), young HDFs treated with WGA or LMB, or RS HDFs (S). d Immunocytochemical detection of DNA damage repair markers (53BP1 and γH2AX foci) in HDFs treated with WGA or LMB. Scale bar, 50 μm. Quantitative analysis of γH2AX and 53BP1 double-positive nuclear foci was performed using micrographs of cells labeled with DNA damage repair markers (n > 200 cells). e Comet assay of young HDFs, WGA- and LMB-treated young HDFs, and RS HDFs (n > 50 cells). f Volcano plots showing upregulated (red) and downregulated (blue) proteins in the nucleus (left) and cytoplasm (right). g Relationships between upregulated (top) or downregulated (bottom) proteins in the nucleus (left) and cytoplasm (right) of cells undergoing RS or LMB-NBIS. h Scatter plots showing significant (P < 0.05) Pearson correlations (ρ) of log2-fold-changes for the differentially expressed sibling peptides with consistent alteration directions for all DEPs measured from the nucleus (left) and cytoplasm (right) between cells undergoing RS and LMB-NBIS. Red lines denote regression lines, and the regression equations are shown together with R2 values. i Heat maps showing correlations of protein levels measured from individual samples of young, senescent (RS), and LMB-treated (LMB-NBIS) HDFs. Color bar, gradient of the Pearson correlation. j Heat map showing the gene enrichment patterns of GOBPs and KEGG pathways by upregulated and downregulated proteins in the nucleus or cytoplasm of cells undergoing RS or LMB-NBIS. Color bar, gradient of Z-score for the enrichment P value determined with DAVID software.
Fig. 3
Fig. 3. A genetically induced nuclear barrier results in RS-like senescence.
a HDFs infected with lentivirus expressing CRM1 shRNA or importin-α1 shRNA for 9 days and treated with 1 μg/ml puromycin 2 days after infection. Representative images of cells stained for SA-β-gal activity by the cytochemical method. Scale bar, 50 μm. b Percentages of β-gal-positive cells in control and CRM1- or importin-α1-knockdown HDFs (n > 200 cells). Y and S, young and senescent HDFs, respectively. The β-gal assay was carried out 7 days after the start of puromycin selection. c Immunoblot of whole-cell lysates from HDFs infected with virus expressing CRM1 shRNA or importin-α1 shRNA. d Cell lysates immunoprecipitated with an anti-RanGTP antibody. As positive and negative controls, young cell lysates were used to pull down RanGTP after treatment with GDP or GTPγS. Immunoblotting of immunoprecipitates (IP) with an anti-Ran antibody. The right panel shows the quantitative analysis of RanGTP expression normalized to that of heavy chain. The results are representative of three independent experiments that are shown in the bar graph as the means ± SD. *, P < 0.05 (Student’s t-test). Y and S, young and senescent HDFs, respectively. e HDFs infected with lentivirus expressing RCC1 shRNA for 10 days. The cells were selected by treatment with 1 μg/ml puromycin 2 days after infection. Assays were performed 10 days after infection. Wide-field micrographs of cells stained for SA-β-gal activity by the cytochemical (X-gal) method. Bottom panels show 3× magnified versions of images as indicated by the dashed boxes on top. Scale bar, 50 μm. f Percentages of β-gal-positive cells among young, control shRNA-treated, RCC1-knockdown HDF, and RS HDF populations (Senescent) (n > 200 cells). Left (white) and right (red) bars indicate the percentages estimated by cytochemical and chemiluminescence assays, respectively. The data represent the means ± SD (n = 3); a.u., arbitrary unit. g Immunoblot using whole-cell lysates of HDFs infected with a lentivirus expressing control or RCC1 shRNA. h Comet assay with RCC1-knockdown HDFs and RS HDFs. The data represent the means ± SD (n > 50 cells).
Fig. 4
Fig. 4. Disruption of NCT is conserved in aging yeast.
a Schematic overview of the experimental design and microarray and data analyses. The number of DEGs between young and old yeast cells is presented. b Cellular processes (GOBPs) significantly (P < 0.1) enriched consistently by upregulated (red) or downregulated (blue) genes in aged yeast cells and HDFs undergoing RS. The Z-score indicates –N−1(P), where P is the enrichment P value determined with DAVID software and N−1(·) is the inverse normal distribution. c qRT-PCR analysis of representative genes involved in common NBIS-RS cellular pathways in the replicative aging yeast model. For the replicative aging model, the analysis was performed at 0 generations (young) and 12 generations (old). mRNA expression levels were first normalized to those of CDC19 (internal control) and then further normalized by the mean mRNA expression level in young yeast cells. In this analysis, two additional non-DEGs, SEH1 and YRB1, with P values close to the cutoff value, were included to confirm the downregulation of NCT. The values are presented as the means ± SD (n = 2 or 3). *, P < 0.05; **, P < 0.01; and ***, P < 0.001 by Student’s t-test.
Fig. 5
Fig. 5. The senescence-associated changes in NBIS are most similar to those in RS.
a Hierarchical clustering of seven cellular senescence models (RS-, WGA- and LMB-treated HDFs, RCC1-knockdown HDFs, OIS, OSIS, and DDIS) based on DEGs in at least one of the seven models (as determined by Euclidean distance and average linkage method). Colors represent the increase (red) and the decrease (blue) in mRNA expression levels for each senescence model with respect to its corresponding control. The color bar denotes the gradient of log2-fold-change between each senescence model and its corresponding control. b Top 10 clusters of DEGs identified by NMF clustering analysis based on their differential expression patterns across the seven cellular senescence models. The color scheme is the same as that shown in (a). c, d Process network models constructed for upregulated genes in C1-5 (c) and downregulated genes in C6-10 (d) using cellular process association analysis. Magenta and purple nodes represent GOBPs/KEGG pathways significantly (P < 0.1) enriched with genes in at least one of the upregulated (C1-5) and downregulated clusters (C6-10). Edges represent significant genes overlap between the connected GOBPs/KEGG pathways. Label colors or circle colors indicate that the corresponding GOBPs/KEGG pathways are enriched by the genes in the corresponding clusters (see legend at the bottom of the figures). Circles are used only for a GOBP/KEGG pathway enriched by two or more types of clusters, including ‘All shared clusters’.
Fig. 6
Fig. 6. Processes common to NBIS and RS coordinate the reduction of NCT.
ac Network models showing interactions among DEGs involved in endocytosis and lysosomal degradation (a), nuclear transport and RNA processing (b), or nucleotide metabolism (c). Node colors represent the clusters to which the corresponding belong (see legend box). Gray lines denote protein-protein interactions, arrows represent the transport of molecules or metabolic reactions, the dotted line denotes the membrane of the nucleolus, and the two thick lines represent the plasma or nuclear membrane. Names of complexes or functional modules for the closely located genes are shown. d qRT-PCR analysis of representative genes in the cellular pathways common to both NBIS and RS. The analyzed genes are shown as large nodes in the network models (ac). mRNA expression changes were first normalized to those of RPS11 (internal control) and then further normalized by the mean mRNA expression change in young HDFs. The values are presented as the means ± SD (n = 2 or 3). *, P < 0.05; **, P < 0.01; and ***, P < 0.001 by one-way analysis of variance with Dunnett’s post hoc test.
Fig. 7
Fig. 7. The expression of NCT regulators is regulated by Sp1 expression.
a Immunoblot of whole-cell lysates of HDFs at different passages while undergoing senescence. Doubling time (DTs) corresponding to passage number are shown. b HDFs were infected with a lentivirus expressing Sp1 shRNA for 14 days; cells were selected by treatment with 5 μg/ml puromycin starting 2 days postinfection. Wide-field micrographs of cells stained for SA-β-gal activity by the cytochemical (X-gal) method. Scale bar, 50 μm. c Immunoblot of whole-cell lysates of HDFs infected with a lentivirus expressing Sp1 shRNA. d ChIP analysis with an anti-Sp1 antibody using young or senescent HDFs. The binding of Sp1 to the gene promoter was assessed by qPCR. The results are representative of three independent experiments; histograms show the means ± SD (n = 3). *, P < 0.05; **, P < 0.01; and ***, P < 0.001 by Student’s t-test. e Immunoblot and ChIP analyses with an anti-Sp1 antibody using HDFs infected with a lentivirus expressing Sp1 shRNA or control shRNA. The binding of Sp1 to the gene promoter was assessed by qPCR. The details are same as those shown in (d). f Immunoblot and ChIP analyses with an anti-Sp1 antibody using HDFs transfected with Sp1 expression or empty vector. The details are same as those shown in (d). g Proposed mechanistic model of NBIS.

References

    1. Lopez-Otin C, Blasco MA, Partridge L, Serrano M, Kroemer G. The hallmarks of aging. Cell. 2013;153:1194–1217. - PMC - PubMed
    1. Casella G, Munk R, Kim KM, Piao Y, De S, Abdelmohsen K, et al. Transcriptome signature of cellular senescence. Nucleic Acids Res. 2019;47:7294–305. - PMC - PubMed
    1. Campisi J. Aging, cellular senescence, and cancer. Annu. Rev. Physiol. 2013;75:685–705. - PMC - PubMed
    1. Chen QM. Replicative senescence and oxidant-induced premature senescence. Beyond the control of cell cycle checkpoints. Ann. N. Y Acad. Sci. 2000;908:111–25. - PubMed
    1. Kuilman T, Michaloglou C, Mooi WJ, Peeper DS. The essence of senescence. Genes Dev. 2010;24:2463–79. - PMC - PubMed

Publication types