. 2021;126(8):6761-6784.
doi: 10.1007/s11192-021-04059-x. Epub 2021 Jun 23.

Publication patterns' changes due to the COVID-19 pandemic: a longitudinal and short-term scientometric analysis

Affiliations

Publication patterns' changes due to the COVID-19 pandemic: a longitudinal and short-term scientometric analysis

Shir Aviv-Reuven et al. Scientometrics. 2021.

Abstract

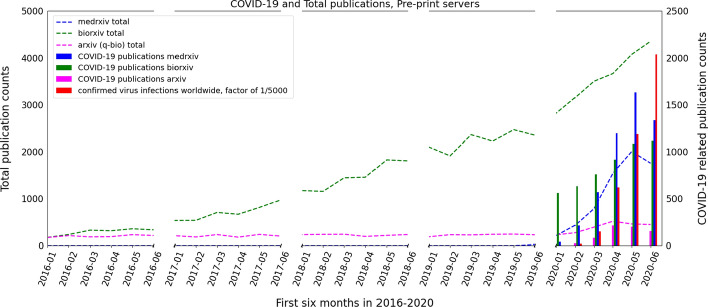
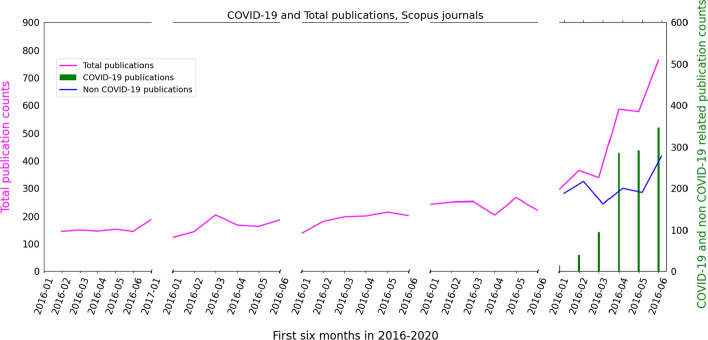
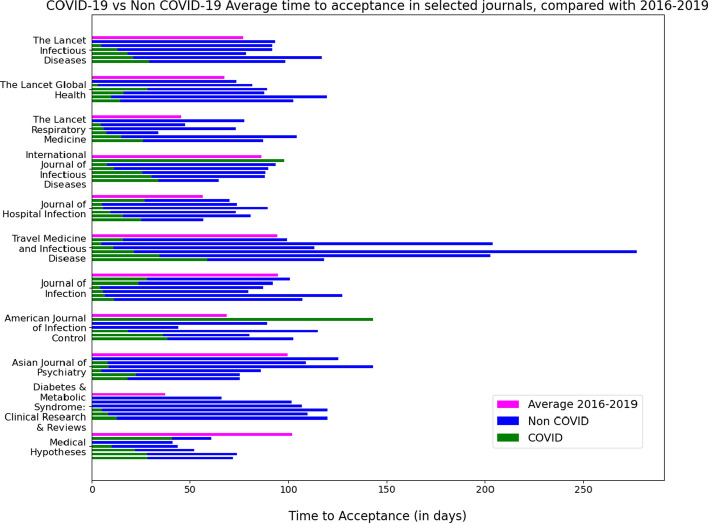
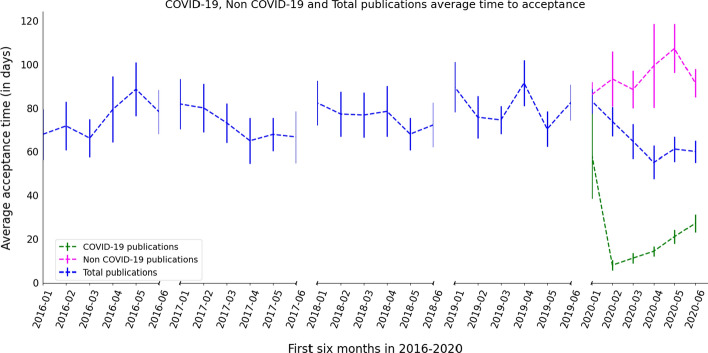
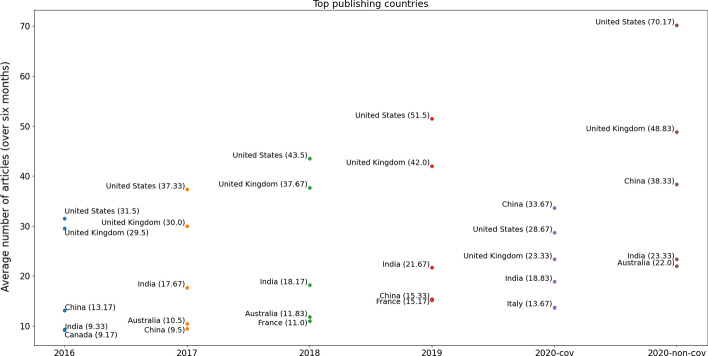
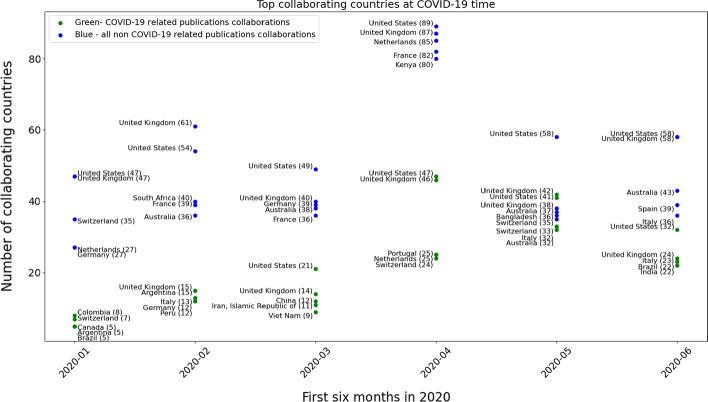
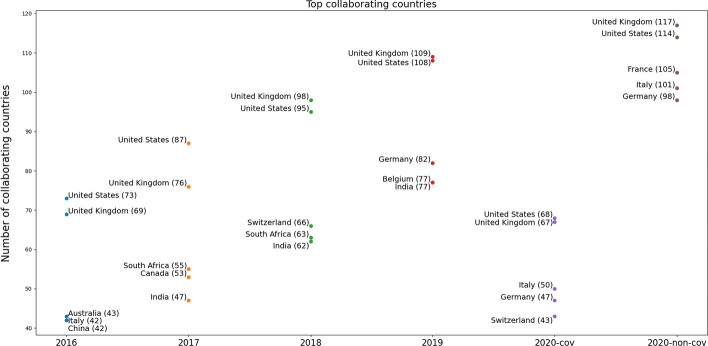
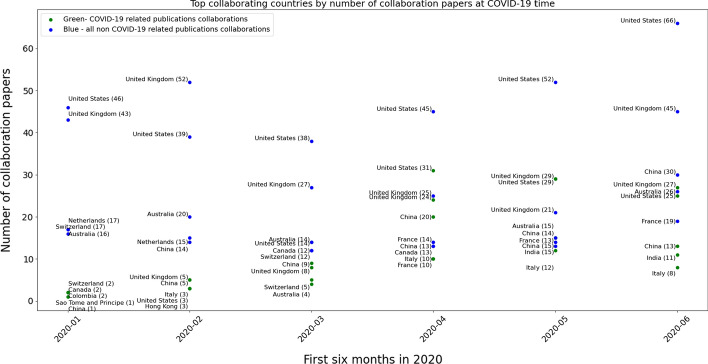
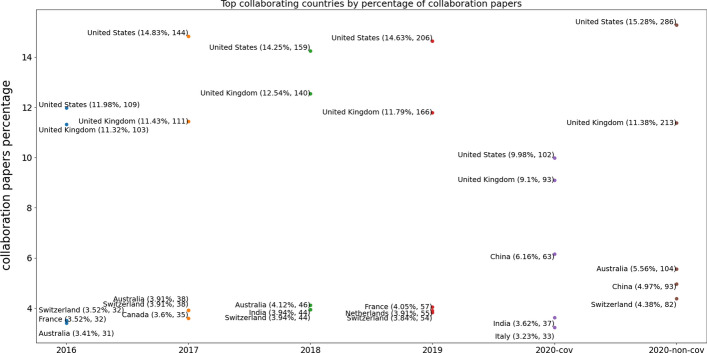
In recent months the COVID-19 (also known as SARS-CoV-2 and Coronavirus) pandemic has spread throughout the world. In parallel, extensive scholarly research regarding various aspects of the pandemic has been published. In this work, we analyse the changes in biomedical publishing patterns due to the pandemic. We study the changes in the volume of publications in both peer reviewed journals and preprint servers, average time to acceptance of papers submitted to biomedical journals, international (co-)authorship of these papers (expressed by diversity and volume), and the possible association between journal metrics and said changes. We study these possible changes using two approaches: a short-term analysis through which changes during the first six months of the outbreak are examined for both COVID-19 related papers and non-COVID-19 related papers; and a longitudinal approach through which changes are examined in comparison to the previous four years. Our results show that the pandemic has so far had a tremendous effect on all examined accounts of scholarly publications: A sharp increase in publication volume has been witnessed and it can be almost entirely attributed to the pandemic; a significantly faster mean time to acceptance for COVID-19 papers is apparent, and it has (partially) come at the expense of non-COVID-19 papers; and a significant reduction in international collaboration for COVID-19 papers has also been identified. As the pandemic continues to spread, these changes may cause a slow down in research in non-COVID-19 biomedical fields and bring about a lower rate of international collaboration.

Keywords: COVID-19; Journals; Preprint; Publication analysis; Scientometrics; Scopus.


Conflict of interest statement

Conflict of interestThe authors declare that they have no conflict of interest.

Figures

Fig. 1
Fig. 1
Publication growth in the examined preprint repositories during the first six months of the years 2016–2020. Dotted plots - Total papers published. Bars - COVID-19 related papers, compared with the pandemic spread (factor of 1/5000)
Fig. 2
Fig. 2
Publication growth in the examined Scopus journals during the first six months of the years 2016–2020. Plots - Total papers published (Magenta) and non COVID-19 related papers (Blue). Bars (Green) - COVID-19 related papers. (The list of journals is shown in Table 1)
Fig. 3
Fig. 3
Mean time to acceptance in examined Scopus journals during the first six months of the year 2020 and the average of the first six months of 2016–2019. For each journal - Average in preceding years (magenta), COVID-19 (green), non-COVID-19 (blue). From top: preceding years’ average, January, February, March, April, May and June (Bottom bar). Journals are ordered according to SJR score, as shown in Table 1
Fig. 4
Fig. 4
Mean time to acceptance in the examined Scopus journals for COVID-19 papers compared with non-COVID-19 and all published papers during the first six months of 2016–2020. The mean for each month is averaged over the number of journals (a ist of journals is shown in Table 1). SEM is calculated and displayed separately for each month
Fig. 5
Fig. 5
Top publishing countries for the Scopus selected journals in 2016–2020 and the number of publications by them. For each year the numbers are averaged over the first six months. 2020-cov and 2020-non-cov show the average number of COVID-19 and non-COVID-19 related publications respectively. (Numbers in parenthesis display the average number of papers)
Fig. 6
Fig. 6
Top five diversely collaborative countries in the examined Scopus journals during the first six months of 2020 and the number of countries collaborating with them. Collaborating countries are shown for COVID-19 related publications (green) and non-COVID-19 related publications (blue). (Numbers in parentheses display the number of collaborating countries)
Fig. 7
Fig. 7
Top five diversely collaborative countries in the examined Scopus journals in 2016–2020 and the number of countries collaborating with them. For each year the numbers are aggregated over the first six months (repeating countries were removed). 2020-cov and 2020-non-cov show the top five collaborative countries for COVID-19 and non-COVID-19 related publications, respectively. (Numbers in parentheses display the number of collaborating countries)
Fig. 8
Fig. 8
Top five collaborative countries by volume in the examined Scopus journals during the first six months of 2020 and the number of collaborative publications. The number of collaborative publications is shown for COVID-19 related publications (green) and non-COVID-19 related publications (blue), (Numbers in parentheses display the number of collaborative papers
Fig. 9
Fig. 9
Top five collaborative countries by volume in the examined Scopus journals in 2016–2020 and the percentage of collaborative publications. 2020-cov and 2020-non-cov show the top five collaborative countries for COVID-19 and non-COVID-19 related publications, respectively. Percentage calculated is the number of collaborative papers relative to all of the papers published in the same time period by the same country. (Numbers in parentheses display the percentage and the number of collaborative papers)

Comment in

References

    1. Ahmad, M., & Batcha, M.S. (2020). Identifying and mapping the global research output on coronavirus disease: A scientometric study. Library Philosophy and Practice (e-journal) 4125.
    1. Cai X, Fry CV, Wagner CS. International collaboration during the COVID-19 crisis: Autumn 2020 developments. Scientometrics. 2021;126(4):3683–3692. doi: 10.1007/s11192-021-03873-7. - DOI - PMC - PubMed
    1. Chahrour M, Assi S, Bejjani M, Nasrallah AA, Salhab H, Fares MY, Khachfe HH. A bibliometric analysis of COVID-19 research activity: A call for increased output. Cureus. 2020 doi: 10.7759/cureus.7357. - DOI - PMC - PubMed
    1. Costa, I. C. P., Sampaio, R. S., Souza, F. A. C. D., Dias, T. K. C., Costa, B. H. S., & Chaves, E. D. C. L. (2020). Scientific production in online journals about the new coronavirus (Covid-19): Bibliometric research. Texto & Contexto - Enfermagem, 29. 10.1590/1980-265x-tce-2020-0235.
    1. Da Silva JAT, Tsigaris P, Erfanmanesh M. Publishing volumes in major databases related to Covid-19. Scientometrics. 2020;126(1):831–842. doi: 10.1007/s11192-020-03675-3. - DOI - PMC - PubMed

LinkOut - more resources