. 2021 Nov:102:105937.
doi: 10.1016/j.cnsns.2021.105937. Epub 2021 Jun 24.

Modeling the impact of SARS-CoV-2 variants and vaccines on the spread of COVID-19

Affiliations

Modeling the impact of SARS-CoV-2 variants and vaccines on the spread of COVID-19

A M Ramos et al. Commun Nonlinear Sci Numer Simul. 2021 Nov.

Abstract

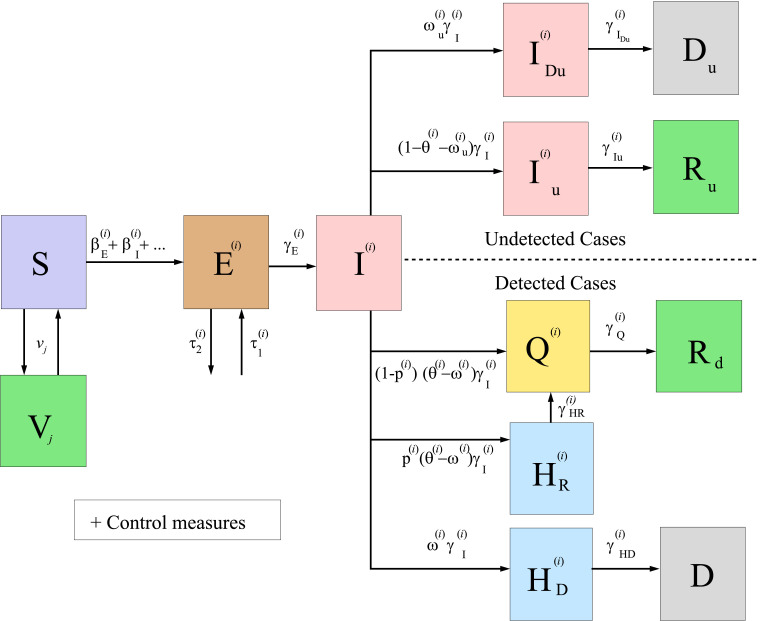
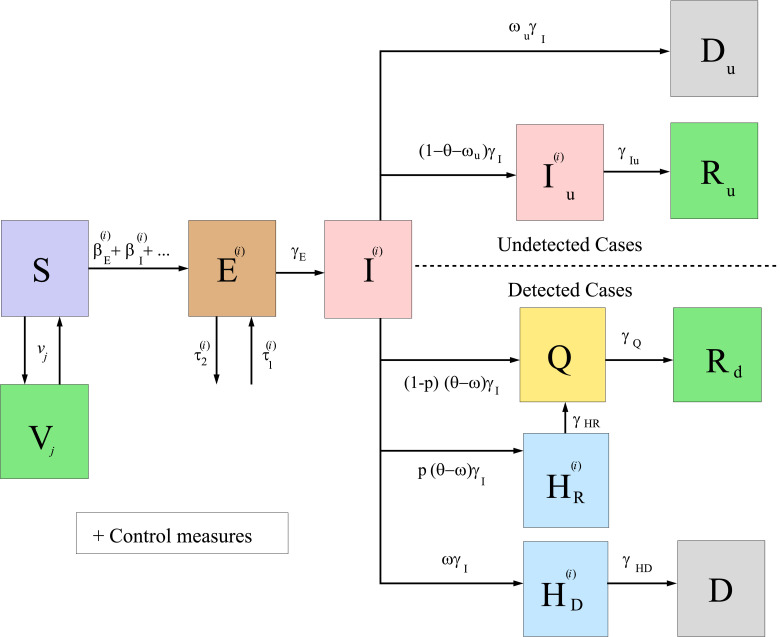
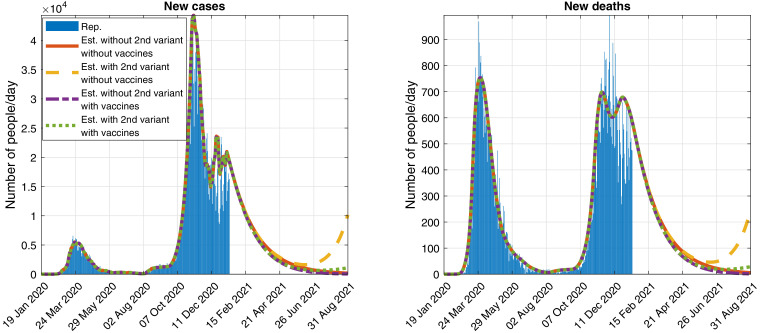
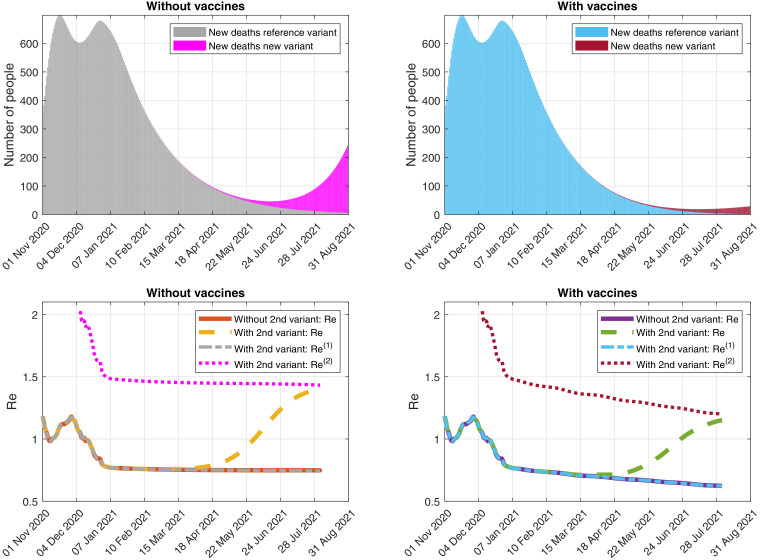
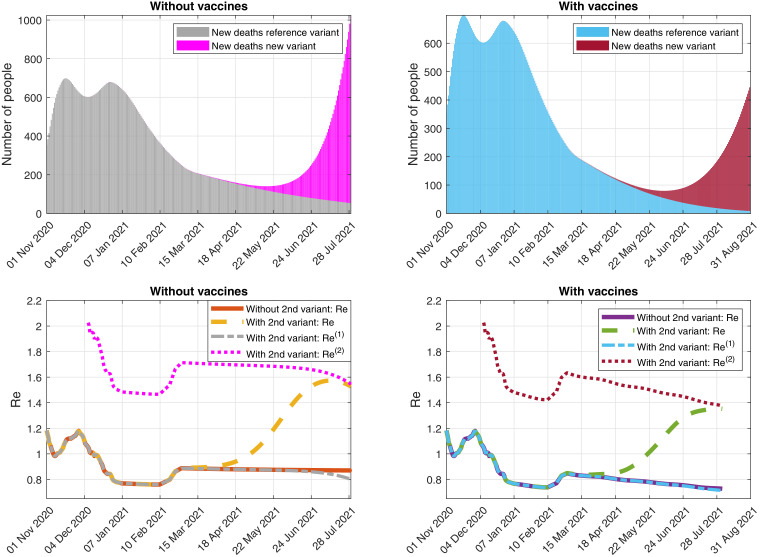
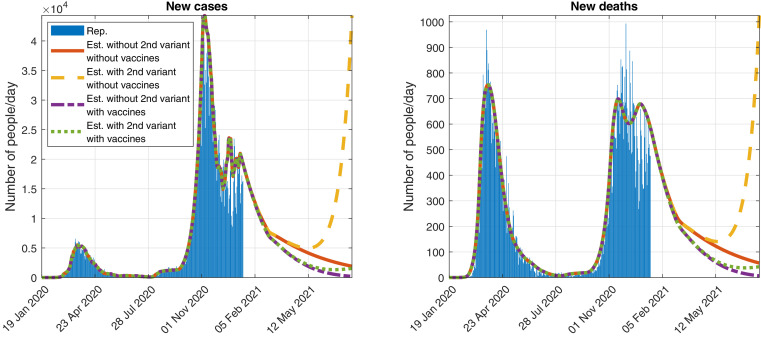
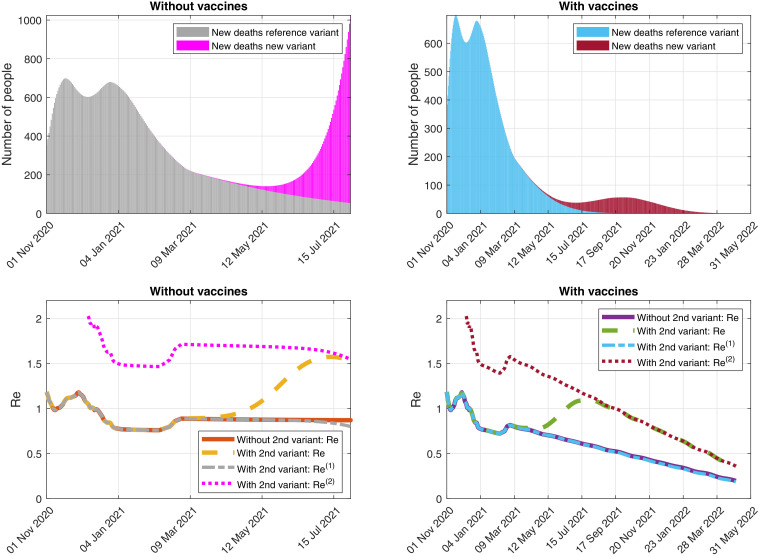
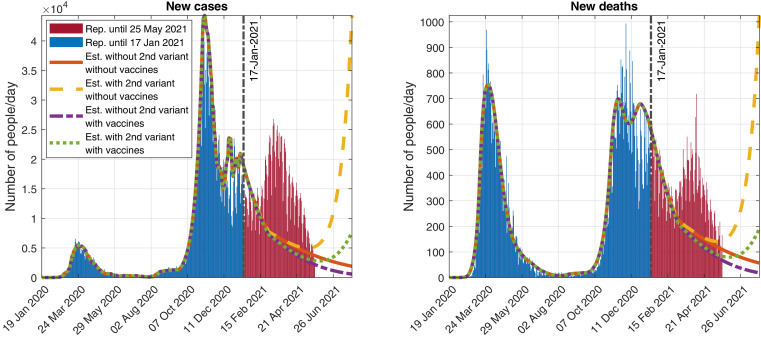
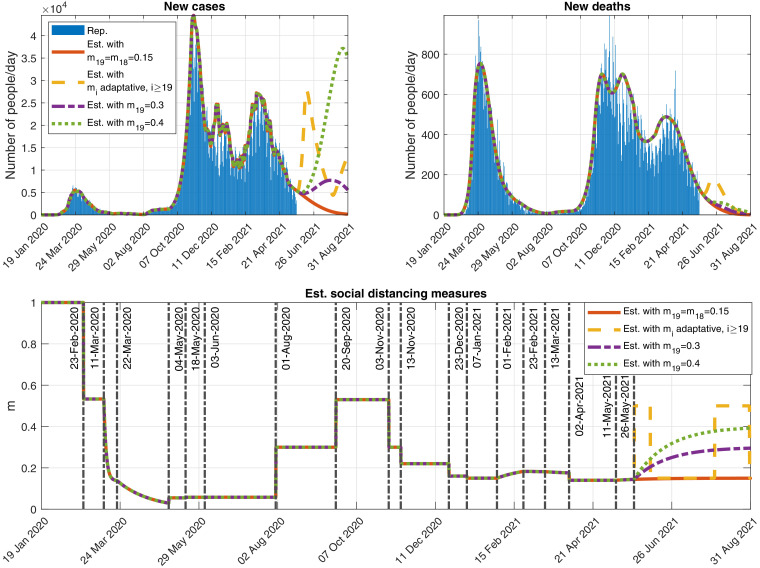
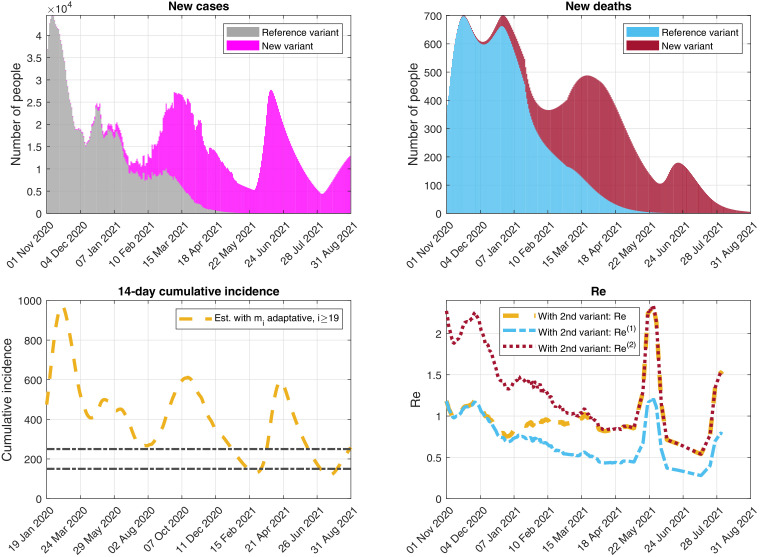
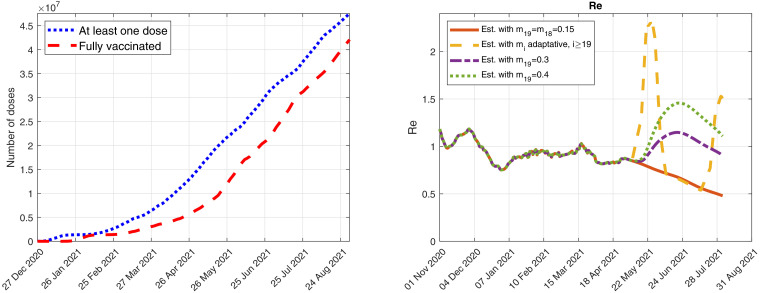
The continuous mutation of SARS-CoV-2 opens the possibility of the appearance of new variants of the virus with important differences in its spreading characteristics, mortality rates, etc. On 14 December 2020, the United Kingdom reported a potentially more contagious coronavirus variant, present in that country, which is referred to as VOC 202012/01. On 18 December 2020, the South African government also announced the emergence of a new variant in a scenario similar to that of the UK, which is referred to as variant 501.V2. Another important milestone regarding this pandemic was the beginning, in December 2020, of vaccination campaigns in several countries. There are several vaccines, with different characteristics, developed by various laboratories and research centers. A natural question arises: what could be the impact of these variants and vaccines on the spread of COVID-19? Many models have been proposed to simulate the spread of COVID-19 but, to the best of our knowledge, none of them incorporates the effects of potential SARS-CoV-2 variants together with the vaccines in the spread of COVID-19. We develop here a θ - i j -SVEIHQRD mathematical model able to simulate the possible impact of this type of variants and of the vaccines, together with the main mechanisms influencing the disease spread. The model may be of interest for policy makers, as a tool to evaluate different possible future scenarios. We apply the model to the particular case of Italy (as an example of study case), showing different outcomes. We observe that the vaccines may reduce the infections, but they might not be enough for avoiding a new wave, with the current expected vaccination rates in that country, if the control measures are relaxed. Furthermore, a more contagious variant could increase significantly the cases, becoming the most common way of infection. We show how, even with the pandemic cases slowing down (with an effective reproduction number less than 1) and the disease seeming to be under control, the effective reproduction number of just the new variant may be greater than 1 and, eventually, the number of infections would increase towards a new disease wave. Therefore, a rigorous follow-up of the evolution of the number of infections with any potentially more dangerous new variant is of paramount importance at any stage of the pandemic.

Keywords: θ -SIR Type model; 501.V2; COVID-19 vaccines; SARS-CoV-2 variants; VOC 202012/01; effective reproduction number.


Conflict of interest statement

The authors declare that they have no known competing financial interests or personal relationships that could have appeared to influence the work reported in this paper.

Figures

Fig. 1
Fig. 1
Diagram summarizing the general model for COVID-19 given by system (1)–(2).
Fig. 2
Fig. 2
Diagram summarizing the simplified model for COVID-19 given by system (9)–(10), applied to the case of Italy.
Fig. 3
Fig. 3
Total daily amount of remaining and administered doses of the Comirnaty vaccine, as determined by function u1. The darker colors correspond to first doses (i.e., the values of u1), and the lighter colors correspond to second doses. The last plateau corresponds to 470,000/7 doses.
Fig. 4
Fig. 4
Total daily amount of remaining and administered doses of the Moderna vaccine, as determined by function u2. The darker colors correspond to first doses (i.e., the values of u2), and the lighter colors correspond to second doses. The last plateau corresponds to 536,000/24 doses.
Fig. 5
Fig. 5
Official reported (Rep.) data and simulation (Est.) of the evolution of the daily detected (Left) cases and (Right) deaths, assuming that the control measures as of 17 January 2021 are maintained and considering the reference virus and a second variant of SARS-CoV-2 that spreads a 93% faster.
Fig. 6
Fig. 6
Simulation of the evolution of (Top) the daily detected deaths caused by each variant and (Bottom) the effective reproduction numbers, assuming that the control measures as of 17 January 2021 are maintained and considering the reference virus and a second variant of SARS-CoV-2 that spreads a 93% faster. (Right) With and (Left) without vaccines.
Fig. 7
Fig. 7
Official reported data and simulation of the evolution of the daily detected (Left) cases and (Right) deaths, assuming that the control measures are relaxed on 1 March 2021 (with m14=0.20) and considering a second variant of SARS-CoV-2 that spreads a 93% faster.
Fig. 8
Fig. 8
Simulation of the evolution of (Top) the daily detected deaths caused by each variant and (Bottom) the effective reproduction numbers, assuming that the control measures are relaxed on 1 March 2021 (with m14=0.20) and considering a second variant of SARS-CoV-2 that spreads a 93% faster. (Right) With and (Left) without vaccines.
Fig. 9
Fig. 9
Official reported data and simulation of the evolution of the daily detected (Left) cases and (Right) deaths, assuming that the control measures are relaxed on 1 March 2021 (with m14=0.20) and the rate of vaccination is twice the one defined by u1 and u2 (see 12 and 14), from 18 January 2021, and considering a second variant of SARS-CoV-2 that spreads a 93% faster.
Fig. 10
Fig. 10
Simulation of the evolution of (Top) the daily detected deaths caused by each variant and (Bottom) the effective reproduction numbers, assuming that the control measures are relaxed on 1 March 2021 (with m14=0.20) and the rate of vaccination is twice the one defined by u1 and u2 (see 12 and 14), from 18 January 2021, and considering a second variant of SARS-CoV-2 that spreads a 93% faster. (Right) With and (Left) without vaccines.
Fig. 11
Fig. 11
Official data reported up to 25 May 2021, compared to the simulations of the scenarios described in Section 3.2, which appeared in the initial version of this article (see Fig. 7), submitted to the journal on 22 January 2022 using official data reported up to 17 January 2021. Evolution of the daily detected (Left) cases and (Right) deaths, assuming several scenarios described in Section 3.2.
Fig. 12
Fig. 12
Evolution of cω(t) and cβH(t) from 27 December 2020 to 31 August 2021.
Fig. 13
Fig. 13
Evolution in time of sHD(z) (days), which is the mean duration in compartment HD of an individual that enters that compartment at time z, from 1 January 2021.
Fig. 14
Fig. 14
Outputs obtained when simulating possible future scenarios described in the Annex. Top-left: New detected cases per day. Top-right: New detected deaths per day. Bottom: Function modeling the social distancing measures.
Fig. 15
Fig. 15
Outputs obtained when simulating the future scenario with adaptative control measures (yellow scenario) described in the Annex. Top-left: Daily detected cases caused by each variant. Top-right: Daily detected deaths caused by each variant. Bottom-left: 14-day cumulative incidence. Bottom-right: Effective reproduction numbers.
Fig. 16
Fig. 16
Outputs obtained when simulating possible future scenarios described in the Annex. Left: number of people who received, at least, one dose of any of the four COVID-19 vaccines and also number of people who have been fully vaccinated against COVID-19. Right: Evolution of the effective reproduction numbers for the four scenarios studied here.

References

    1. Baden L.R. The New England journal of medicine. 2020. Efficacy and safety of the mRNA-1273 SARS-CoV-2 Vaccine. - DOI - PMC - PubMed
    2. https://www.nejm.org/doi/full/10.1056/NEJMoa2035389

    1. Brauer F., Castillo-Chávez C. Texts in applied mathematics. Springer; 2001. Mathematical models in population biology and epidemiology.
    2. https://www.springer.com/gp/book/9781441931825

    1. Castillo-Laborde C., de Wolff T., Gajardo P., Lecaros R., Olivar G., Ramirez H.. Assessment of event-triggered policies of nonpharmaceutical interventions based on epidemiological indicators. 2020. https://arxiv.org/abs/2011.01036. - PMC - PubMed
    1. Centers for Disease Control and Prevention, 2020. https://www.cdc.gov/coronavirus/2019-ncov/more/science-and-research/scie..., 30 December.
    1. Centers for Disease Control and Prevention. COVID-19 vaccines. 2020a. https://www.cdc.gov/coronavirus/2019-ncov/vaccines/index.html, 31 December. - PubMed

LinkOut - more resources