. 2021;80(19):29367-29399.
doi: 10.1007/s11042-021-11153-y. Epub 2021 Jun 24.

Segmentation and quantification of COVID-19 infections in CT using pulmonary vessels extraction and deep learning

Affiliations

Segmentation and quantification of COVID-19 infections in CT using pulmonary vessels extraction and deep learning

João O B Diniz et al. Multimed Tools Appl. 2021.

Abstract

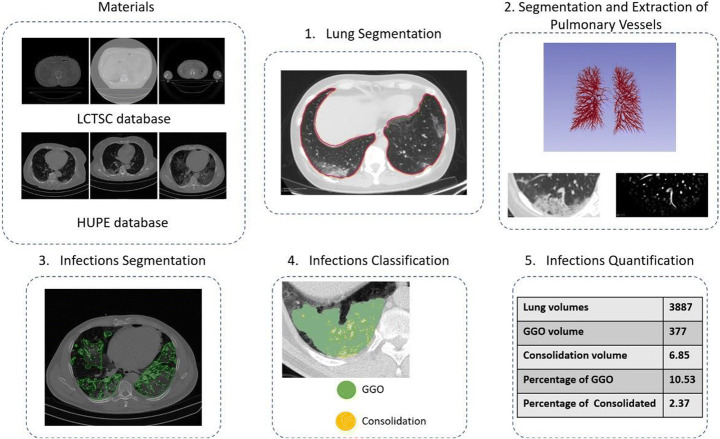
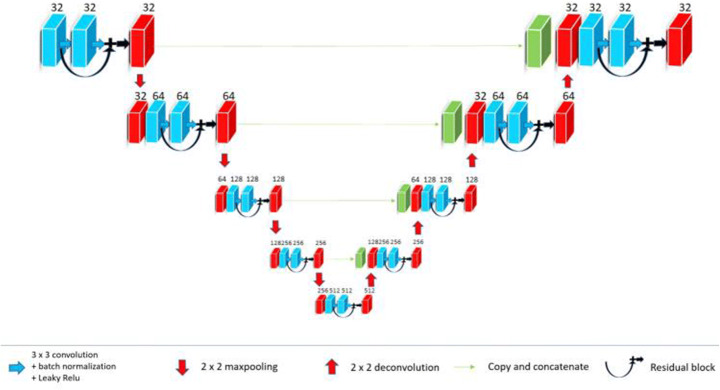
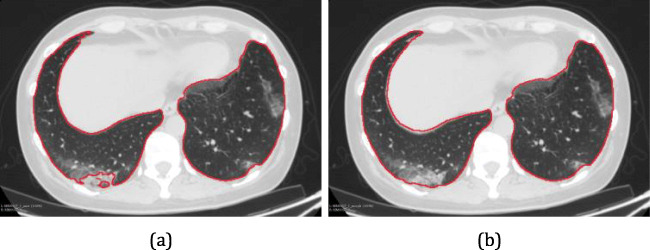
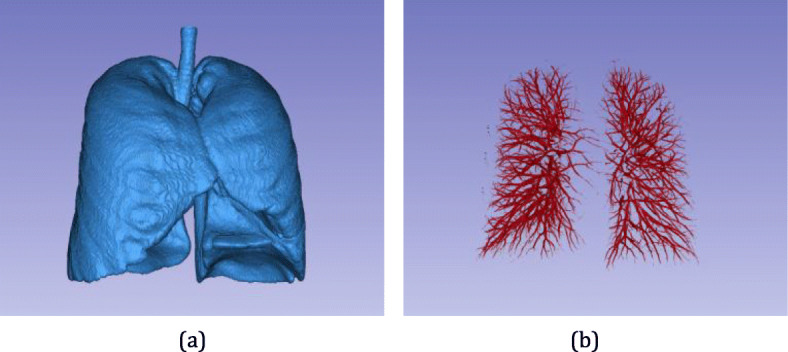
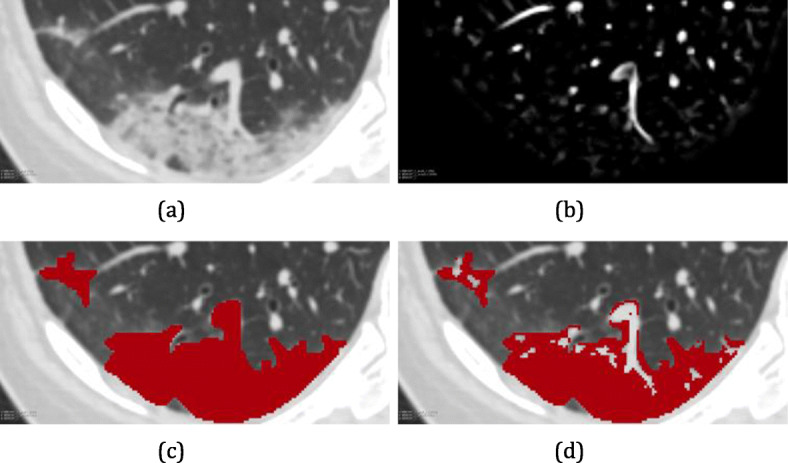
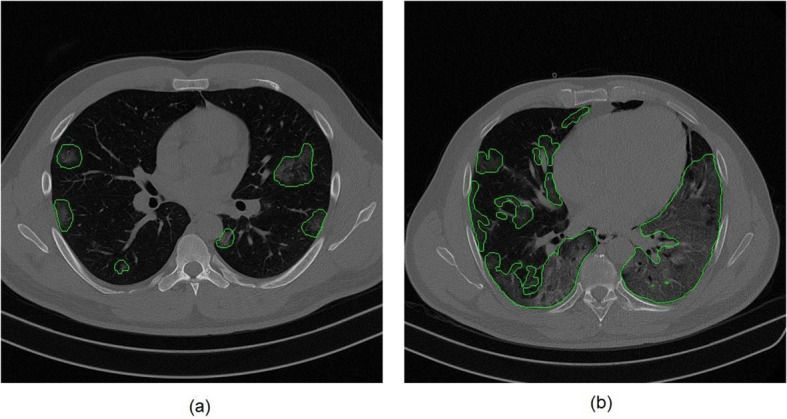
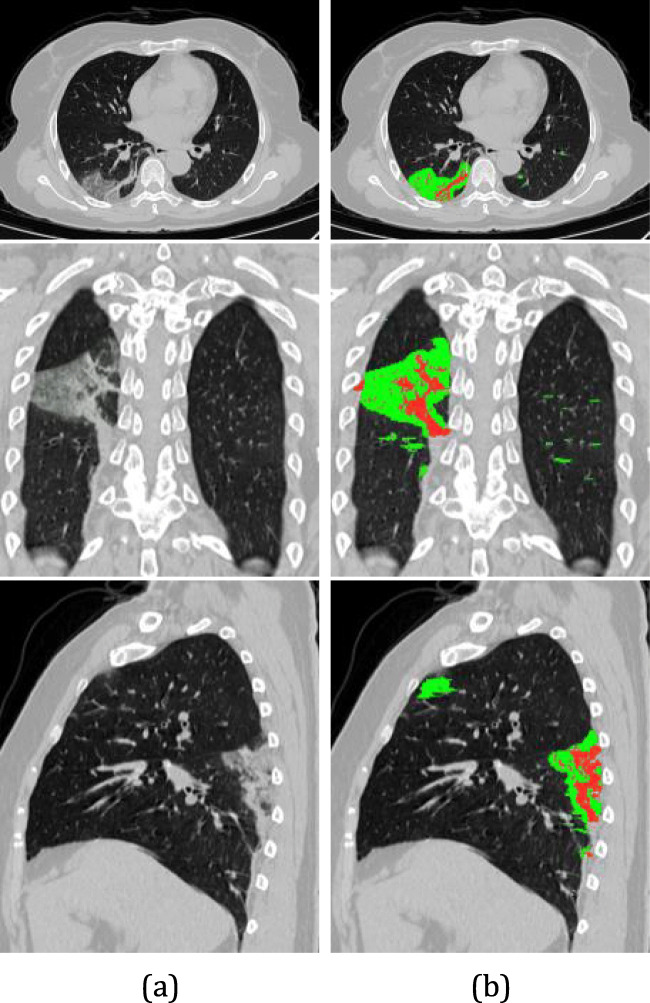
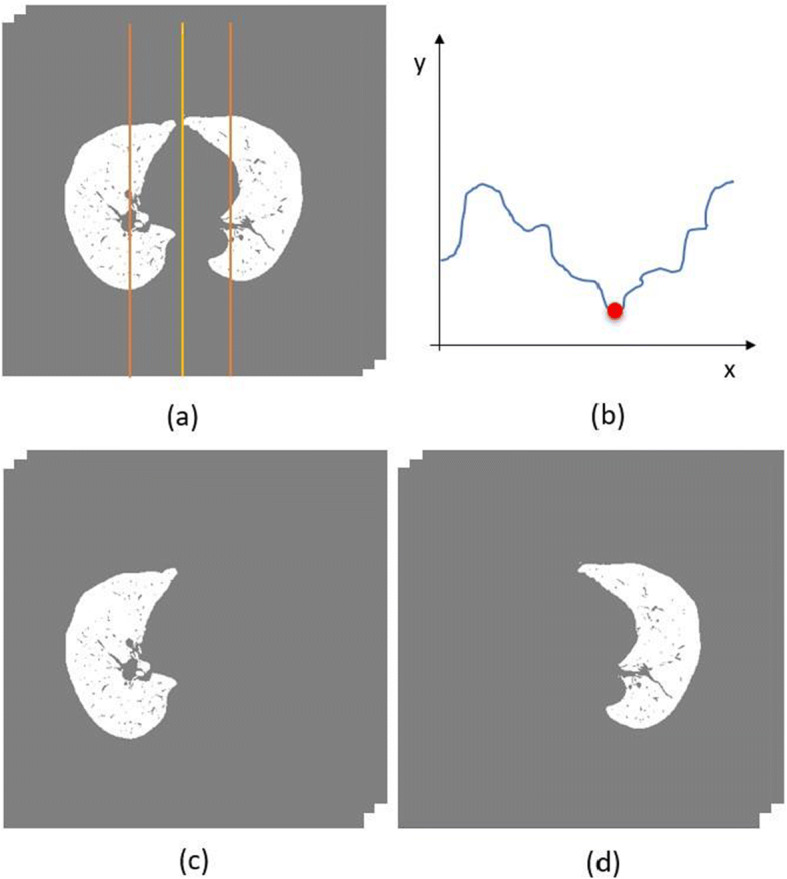
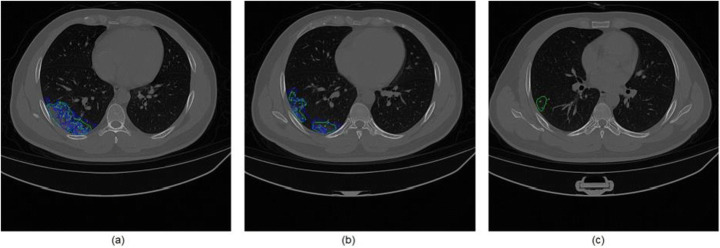
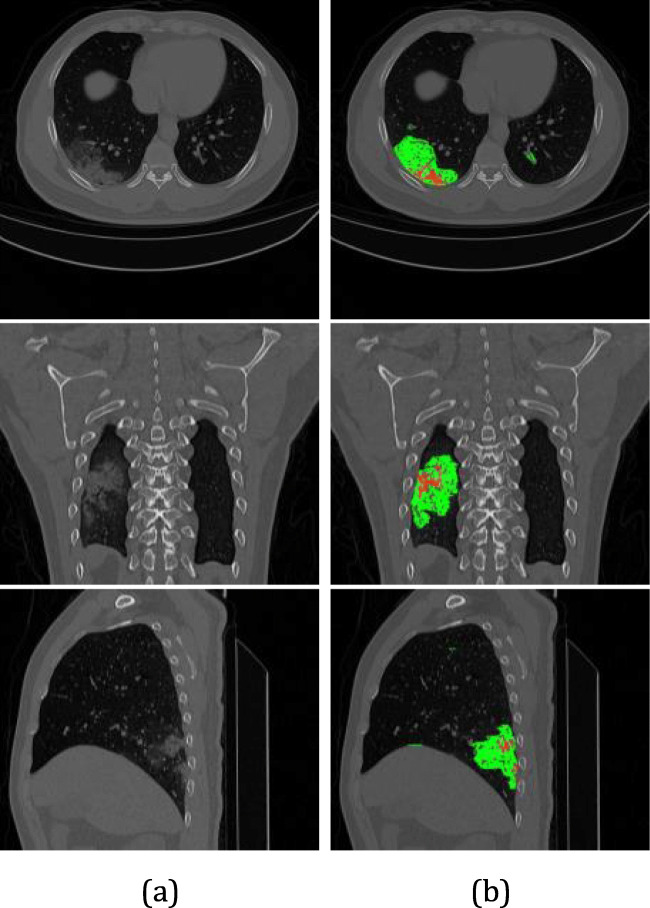
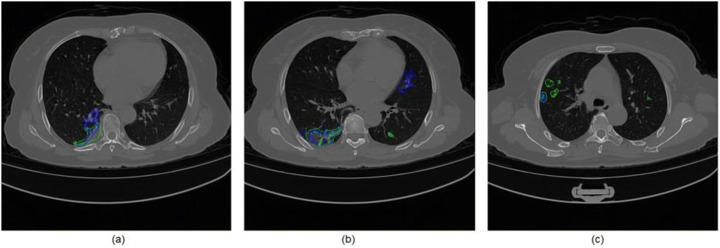
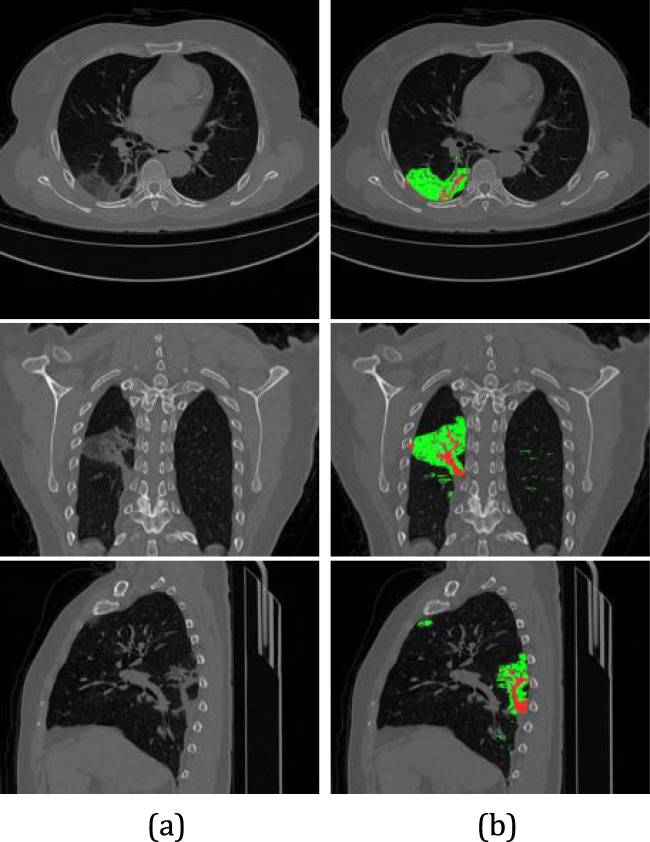
At the end of 2019, the World Health Organization (WHO) reported pneumonia that started in Wuhan, China, as a global emergency problem. Researchers quickly advanced in research to try to understand this COVID-19 and sough solutions for the front-line professionals fighting this fatal disease. One of the tools to aid in the detection, diagnosis, treatment, and prevention of this disease is computed tomography (CT). CT images provide valuable information on how this new disease affects the lungs of patients. However, the analysis of these images is not trivial, especially when researchers are searching for quick solutions. Detecting and evaluating this disease can be tiring, time-consuming, and susceptible to errors. Thus, in this study, we aim to automatically segment infections caused by COVID19 and provide quantitative measures of these infections to specialists, thus serving as a support tool. We use a database of real clinical cases from Pedro Ernesto University Hospital of the State of Rio de Janeiro, Brazil. The method involves five steps: lung segmentation, segmentation and extraction of pulmonary vessels, infection segmentation, infection classification, and infection quantification. For the lung segmentation and infection segmentation tasks, we propose modifications to the traditional U-Net, including batch normalization, leaky ReLU, dropout, and residual block techniques, and name it as Residual U-Net. The proposed method yields an average Dice value of 77.1% and an average specificity of 99.76%. For quantification of infectious findings, the proposed method achieves results like that of specialists, and no measure presented a value of ρ < 0.05 in the paired t-test. The results demonstrate the potential of the proposed method as a tool to help medical professionals combat COVID-19. fight the COVID-19.

Keywords: COVID-19; CT findings; Infection quantification; Infection segmentation; Lung segmentation; Medical imaging.


Conflict of interest statement

Conflict of interestThe authors declare that they have no conflict of interest.

Figures

Fig. 1
Fig. 1
Flowchart of materials and method
Fig. 2
Fig. 2
LCTSC database: (a) slice of institute 1; (b) slice of institute 2; (c) slice of institute 3
Fig. 3
Fig. 3
HUPE database: Example of three patients with different degrees of infections
Fig. 4
Fig. 4
Architecture of residual U-Net
Fig. 5
Fig. 5
Segmentation refinement: Contour of the lungs segmented by Residual U-Net (a) and result of segmentation refinement
Fig. 6
Fig. 6
Enhancement of pulmonary vessels: (a) Result of lung segmentation used to demarcate the region of application of the vessel enhancement filter, which results in (b)
Fig. 7
Fig. 7
Extraction of pulmonary vessels from the markings made by the specialist: (a) original image; (b) image with emphasis on pulmonary vessels; (c) ground truth built by a specialist; and (d) ground truth without pulmonary vessels
Fig. 8
Fig. 8
Examples of CT findings of COVID-19 infections: (a) early stage patient and (b) advanced stage patient
Fig. 9
Fig. 9
Infections classification. (a) Original image. (b) GGO (green color) and consolidation (red color) can be seen in the left lung by axial, coronal and sagittal views, respectively
Fig. 10
Fig. 10
Separation of the lungs. (a) Volume resulting from the lung segmentation step with the range of the projection histogram calculation illustrated by orange, (b) resulting histogram with the cutoff point illustrated by red, (c) left lung, and (d) right lung. Ground glass (GgV), and consolidated (CdV) region volume of the lesions and lung volume (LV). The volume of the lung was calculated by subtracting the volume of the pulmonary vessels. All measures were calculated for the left lung (LL), right lung (RL), and both lungs (BL) in milliliters (mL)
Fig. 11
Fig. 11
Patient case study MM0015 01 in blue marked by the specialist and green marked by the method (a) slice 80, (b) slice 97, and (c) slice 114
Fig. 12
Fig. 12
Infections classification from case studies MM0015 01: (a) original image. (b) GGO (green color) and consolidation (red color) can be seen by axial, coronal and saggittal views, respectively
Fig. 13
Fig. 13
Patient case study MM0016 01 in blue marked by the specialist, green marked by the method (a) slice 93, (b) slice 107, and (c) slice 160
Fig. 14
Fig. 14
Infections classification from case studies MM0016 01: (a) original image. (b) GGO (green color) and consolidation (red color) can be seen by axial, coronal and sagittal views, respectively

References

    1. Agam G, Armato SG, Wu C. Vessel tree reconstruction in thoracic CT scans with application to nodule detection. IEEE Trans Med Imaging. 2005;24(4):486–499. doi: 10.1109/TMI.2005.844167. - DOI - PubMed
    1. Armato SG, III, Sensakovic WF. Automated lung segmentation for thoracic ct: impact on computer-aided diagnosis1. Acad Radiol. 2004;11(9):1011–1021. doi: 10.1016/j.acra.2004.06.005. - DOI - PubMed
    1. Baldi P, Sadowski PJ (2013) Understanding dropout. In: Advances in neural information processing systems, pp. 2814–2822
    1. Bernheim A, Mei X, Huang M, Yang Y, Fayad ZA, Zhang N, Diao K, Lin B, Zhu X, Li K, et al. (2020) Chest ct findings in coronavirus disease-19 (covid-19): relationship to duration of infection. Radiology p 200463 - PMC - PubMed
    1. Boccia S, Ricciardi W, Ioannidis JP (2020) What other countries can learn from Italy during the covid-19 pandemic. JAMA Internal Med - PubMed

LinkOut - more resources