. 2021 Jun 21;5(2):614-630.
doi: 10.1162/netn_a_00194. eCollection 2021.

Infant functional networks are modulated by state of consciousness and circadian rhythm

Affiliations

Infant functional networks are modulated by state of consciousness and circadian rhythm

Rachel J Smith et al. Netw Neurosci. .

Abstract

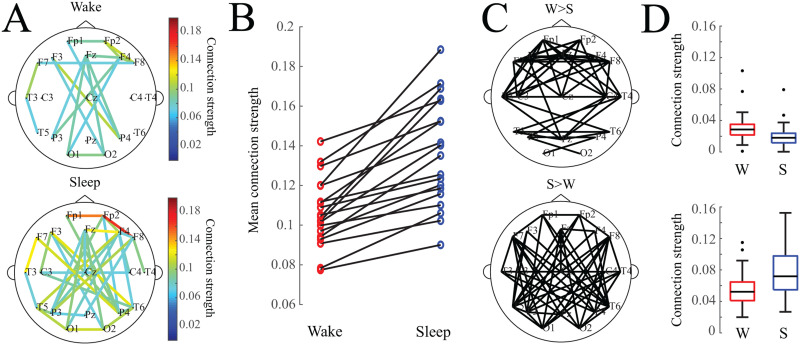
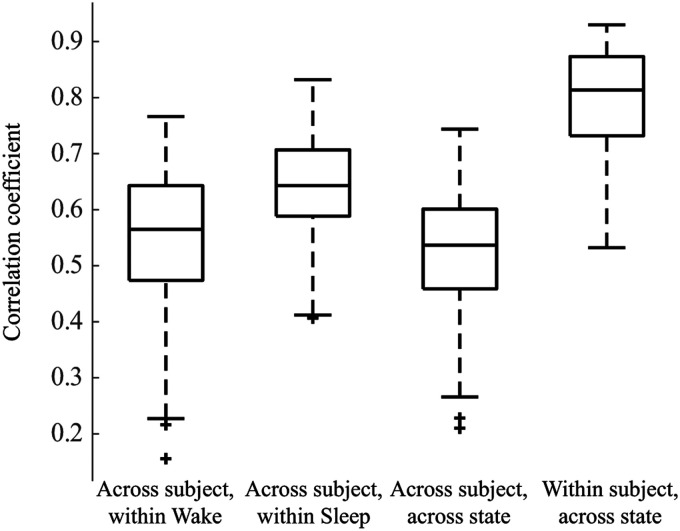
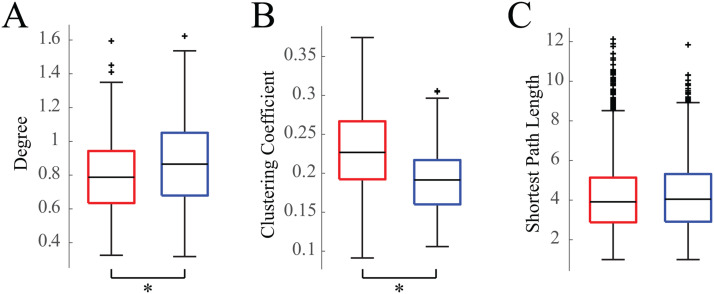
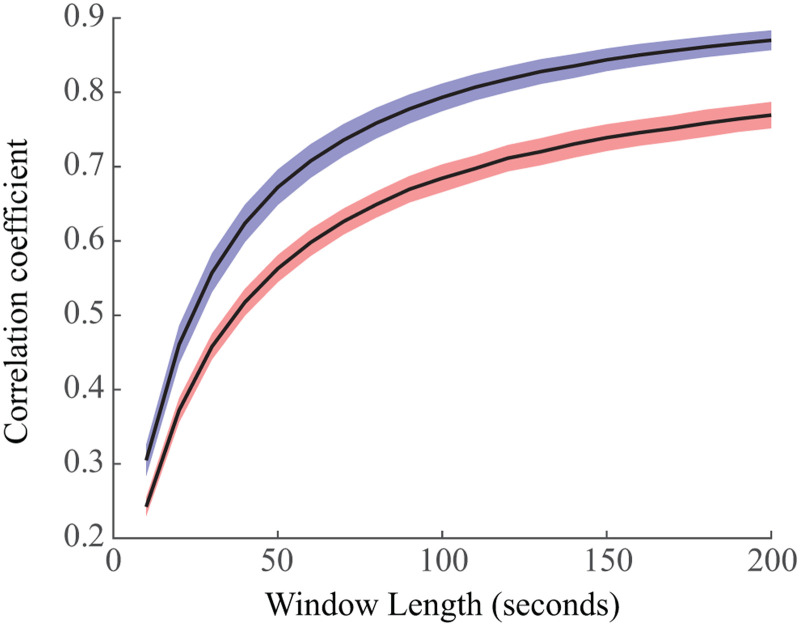
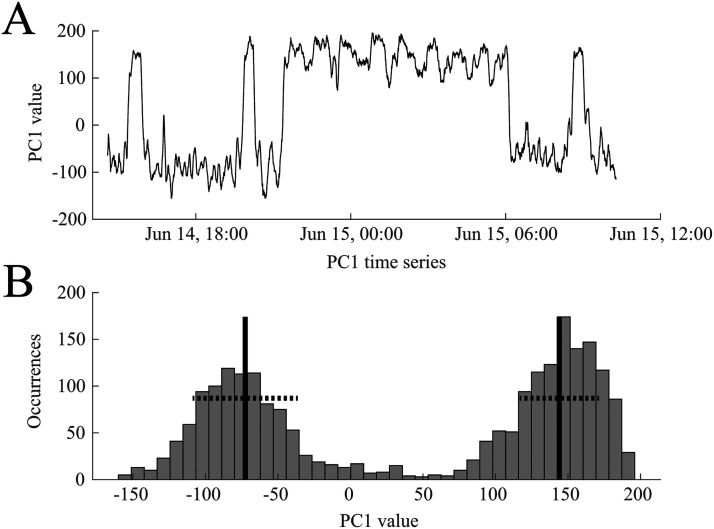
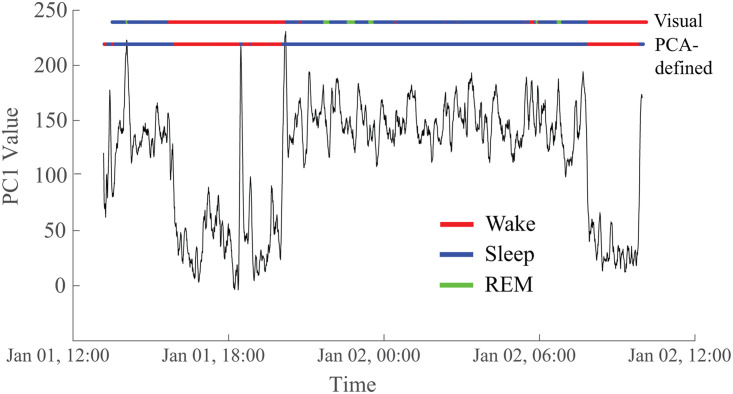
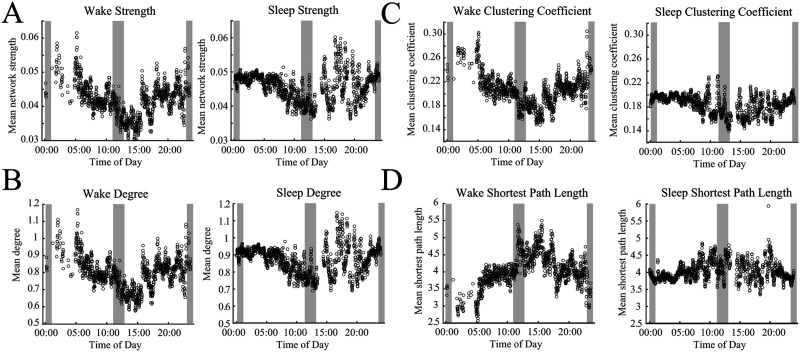
Functional connectivity networks are valuable tools for studying development, cognition, and disease in the infant brain. In adults, such networks are modulated by the state of consciousness and the circadian rhythm; however, it is unknown if infant brain networks exhibit similar variation, given the unique temporal properties of infant sleep and circadian patterning. To address this, we analyzed functional connectivity networks calculated from long-term EEG recordings (average duration 20.8 hr) from 19 healthy infants. Networks were subject specific, as intersubject correlations between weighted adjacency matrices were low. However, within individual subjects, both sleep and wake networks were stable over time, with stronger functional connectivity during sleep than wakefulness. Principal component analysis revealed the presence of two dominant networks; visual sleep scoring confirmed that these corresponded to sleep and wakefulness. Lastly, we found that network strength, degree, clustering coefficient, and path length significantly varied with time of day, when measured in either wakefulness or sleep at the group level. Together, these results suggest that modulation of healthy functional networks occurs over ∼24 hr and is robust and repeatable. Accounting for such temporal periodicities may improve the physiological interpretation and use of functional connectivity analysis to investigate brain function in health and disease.

Keywords: Cross-correlation; Electroencephalography; Functional connectivity; Graph theory; Pediatrics; Resting-state networks.


Figures

<b>Figure 1.</b>
Figure 1.
(A) Average functional connectivity networks for wakefulness and sleep. For visualization, an edge is drawn if the connection value exceeds an absolute threshold of 0.075. (B) Mean connection strength for individual subjects (calculated as the average strength of the strongest 10% of connections) is higher during sleep. (C) Network maps showing connections that were statistically significantly greater in wakefulness (top) or sleep (bottom). (D) Box plots of mean connection strength for connections that were significantly different between wakefulness and sleep (shown in subfigure C).
<b>Figure 2.</b>
Figure 2.
Box plot showing 2-D correlations within and across weighted connectivity matrices for each subject. We first compared networks across subjects within a state, for example, Subject 1 Wake to Subject 2 Wake, and the analogous comparisons during sleep; n = 171 observations each. Then we compared across subjects and across states, for example, Subject 1 Wake to Subject 2 Sleep; n = 171 observations. Lastly, we calculated the 2-D correlation between the sleep and wake networks within single subjects, for example, Subject 1 Wake to Subject 1 Sleep; n = 19 observations. All distributions are statistically significantly different from one another (Wilcoxon rank-sum test, p < 0.05).
<b>Figure 3.</b>
Figure 3.
Box plots of weighted graph theoretical measures. (A) Degree, (B) clustering coefficients, and (C) shortest path lengths of wakefulness (red) and sleep (blue) networks for all 19 subjects. Asterisk denotes p values less than 0.05.
<b>Figure 4.</b>
Figure 4.
Stability of functional connectivity networks in wakefulness (red) and sleep (blue). We calculated the 2-D correlation between independent averaged connectivity networks from windows of data of varying size. We found that sleep exhibited more stable networks, with nonoverlapping confidence intervals for the means for all window sizes.
<b>Figure 5.</b>
Figure 5.
A representative example of the time course of the first principal component (PC1), reflecting how much weight is assigned to PC1 in the functional connectivity time series. (A) PC1 oscillates between two states during ∼18 hr of EEG data. (B) The bimodal nature of PC1 is reflected in its histogram. A two-component Gaussian mixture model was derived from these values and used to classify the two states. The black vertical lines indicate the means of the two distributions, and the dashed horizontal lines denote one standard deviation. Data are from Subject 1.
<b>Figure 6.</b>
Figure 6.
The two states derived from the PC1 time series correspond to visually marked sleep and wakefulness in the EEG. In this representative example, the correspondence is 95.1%. The top horizontal line (“Visual”) is colored to indicate the sleep/wake state based on visual markings. Red indicates the subject is awake, blue is non-REM sleep, and green is REM sleep. The bottom horizontal line (“PCA-defined”) reflects the values of the first principal component after thresholding based on the Gaussian mixture model, with red representing wakefulness and blue representing sleep. Data are from Subject 5.
<b>Figure 7.</b>
Figure 7.
Circadian patterns emerge in both wakefulness and sleep for network strength and graph theoretical metrics. Twenty-four hour periodicities are shown for (A) the network strength, defined as the mean of all connections, (B) network degree, (C) clustering coefficient, and (D) the shortest path length. Each subfigure shows data recorded during wakefulness (left) and sleep (right). Gray shaded regions mark daytime (11:00–13:00) and nighttime (23:00–01:00) hours.

References

    1. Aeschbach, D., Matthews, J. R., Postolache, T. T., Jackson, M. A., Giesen, H. A., & Wehr, T. A. (1999). Two circadian rhythms in the human electroencephalogram during wakefulness. American Journal of Physiology, 277(6), 1771–1779. https://doi.org/10.1152/ajpregu.1999.277.6.R1771, 10600925 - DOI - PubMed
    1. Anastasiadou, M., Hadjipapas, A., Christodoulakis, M., Papathanasiou, E. S., Papacostas, S. S., & Mitsis, G. D. (2016). Epileptic seizure onset correlates with long term EEG functional brain network properties. Proceedings of the Annual International Conference of the IEEE Engineering in Medicine and Biology Society, EMBS, 2016-Octob, 2822–2825. 10.1109/EMBC.2016.7591317 - DOI - PubMed
    1. Anastasiadou, M. N., Christodoulakis, M., Papathanasiou, E. S., Papacostas, S. S., Hadjipapas, A., & Mitsis, G. D. (2019). Graph theoretical characteristics of EEG-based functional brain networks in patients with epilepsy: The effect of reference choice and volume conduction. Frontiers in Neuroscience, 13(March), 1–18. https://doi.org/10.3389/fnins.2019.00221, 30949021 - DOI - PMC - PubMed
    1. Antoniou, I. E., & Tsompa, E. T. (2008). Statistical analysis of weighted networks. Discrete Dynamics in Nature and Society, 2008. 10.1155/2008/375452 - DOI
    1. Barkovich, A. J., Miller, S. P., Bartha, A., Newton, N., Hamrick, S. E. G., Mukherjee, P., … Vigneron, D. B. (2006). MR imaging, MR spectroscopy, and diffusion tensor imaging of sequential studies in neonates with encephalopathy. American Journal of Neuroradiology, 27(3), 533–547. 16551990 - PMC - PubMed