[Preprint]. 2021 Jun 21:2021.06.13.21258795.
doi: 10.1101/2021.06.13.21258795.

Real-time Alerting System for COVID-19 Using Wearable Data

Affiliations

Real-time Alerting System for COVID-19 Using Wearable Data

Arash Alavi et al. medRxiv. .

Update in

  • Real-time alerting system for COVID-19 and other stress events using wearable data.
    Alavi A, Bogu GK, Wang M, Rangan ES, Brooks AW, Wang Q, Higgs E, Celli A, Mishra T, Metwally AA, Cha K, Knowles P, Alavi AA, Bhasin R, Panchamukhi S, Celis D, Aditya T, Honkala A, Rolnik B, Hunting E, Dagan-Rosenfeld O, Chauhan A, Li JW, Bejikian C, Krishnan V, McGuire L, Li X, Bahmani A, Snyder MP. Alavi A, et al. Nat Med. 2022 Jan;28(1):175-184. doi: 10.1038/s41591-021-01593-2. Epub 2021 Nov 29. Nat Med. 2022. PMID: 34845389 Free PMC article.

Abstract

Early detection of infectious disease is crucial for reducing transmission and facilitating early intervention. We built a real-time smartwatch-based alerting system for the detection of aberrant physiological and activity signals (e.g. resting heart rate, steps) associated with early infection onset at the individual level. Upon applying this system to a cohort of 3,246 participants, we found that alerts were generated for pre-symptomatic and asymptomatic COVID-19 infections in 78% of cases, and pre-symptomatic signals were observed a median of three days prior to symptom onset. Furthermore, by examining over 100,000 survey annotations, we found that other respiratory infections as well as events not associated with COVID-19 (e.g. stress, alcohol consumption, travel) could trigger alerts, albeit at a lower mean period (1.9 days) than those observed in the COVID-19 cases (4.3 days). Thus this system has potential both for advanced warning of COVID-19 as well as a general system for measuring health via detection of physiological shifts from personal baselines. The system is open-source and scalable to millions of users, offering a personal health monitoring system that can operate in real time on a global scale.


Conflict of interest statement

Competing interests:

MPS is cofounder and a member of the scientific advisory board of Personalis, Qbio, January, SensOmics, Protos, Mirvie, Oralome. He is on the scientific advisory board of Danaher, Genapsys, and Jupiter.

Figures

Figure 1.
Figure 1.. Study overview.
(A) Participants with a Fitbit and/or Apple Watch were asked to share their wearable and survey data using the study mobile app, MyPHD. The app securely transfers the de-identified data (heart rates, steps, and survey events) to the back-end for real-time analysis. On the back-end, three online infection detection algorithms were deployed and the result from one of the algorithms (online NightSignal) is returned back to the participants in the form of red (indicating abnormal changes in resting heart rate overnight) and green (indicating normal resting heart rate overnight) alerts on the app. (B) A real-world example for real-time pre-symptomatic detection of COVID-19 using the online NightSignal algorithm for a participant with Apple Watch. The alerts get triggered two days before the symptom onset date and continue up to three days after the diagnosis date.
Figure 2.
Figure 2.. Examples of COVID-19 real-time pre-symptomatic detection.
Online pre-symptomatic detection for COVID-19 positive participants with Fitbit (top) using online NightSignal, online RHRAD, and online CuSum algorithms respectively, and Apple Watch (bottom) using online NightSignal algorithm. In the top panel, alerts in the NightSignal algorithm get triggered three days before symptom onset and remain on for the following 15 days. In the bottom panel, signals appear at least 10 days before the symptom onset and continue up to 10 days after that.
Figure 3.
Figure 3.. Examples of COVID-19 real-time asymptomatic detection.
Online asymptomatic detection for COVID-19 positive participants with Apple Watch (top) using online NightSignal algorithm, and Fitbit (bottom) using online NightSignal, online RHRAD, and online CuSum algorithms respectively.
Figure 4.
Figure 4.. Summary of association of red alerts in the NightSignal algorithm with COVID-19 sick period.
(A) Association of the initiation of red alerts in the NightSignal algorithm with COVID-19 symptom onset in 58 positive participants with symptoms using a Fitbit or Apple Watch with respect to the detection window of time centered around symptom onset (21 days before to 21 days after symptom onset). NightSignal algorithm achieves pre-symptomatic detection in 45 participants, and post-symptomatic detection in five participants; eight participants did not receive any red alert associated with their COVID-19 symptoms during sickness detection window. (B) Association of the initiation of red alerts in the NightSignal algorithm with COVID-19 positive test in asymptomatic participants using a Fitbit or Apple Watch. The plot shows 21 days before and 21 days after the COVID-19 diagnosis date. NightSignal algorithm achieves detection in eight participants; two participants did not receive any red alert associated with their COVID-19 with respect to asymptomatic detection window. (C) The plot shows the distribution of scores of red alerts with respect to 21 days before and 21 days after the COVID-19 symptom onset date in positive participants. Red bars indicate the scores of red alerts based on formula (1) below. Let D = {d1 , d2 , … , dn} be a set of days and R = {dk , dk+1 , … , dK+m} be a set of days where consecutive k red alerts have occurred, then the associated red alert score for each day in set R is set to the size of set R (i.e., m+1). Note that the most clustered alerts appear around the symptom onset date. D (days)={d1,d2,,dn},R (consecutive red alerts)={dk,dk+1,dK+m}S (red alerts scores)={s(dk)=m+1,s(dk+1)=m+1,s(dK+m)=m+1}
Figure 5.
Figure 5.. Symptom progression and extent of association with clustered red alerts in COVID-19 sick period.
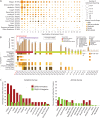
(A) Bubble plot representing day by day frequency count of individuals reporting symptoms during the second half of infection detection window (from symptom onset to 21 days later), with the size of the bubble and shading level indicative of the relative magnitude of the frequency count and the median severity respectively. The percentage in the brackets alongside each symptom indicates the aggregate over all the 21 days of the frequency count of individuals reporting that symptom, as a fraction of total symptomatic COVID-19 positive participants (58). Notably, fatigue is the most commonly reported symptom, whereas loss of smell or taste seem to be the highest in terms of severity. (B) Illustrative example tracing the symptoms of a COVID-19 positive participant from symptom onset to 21 days after, and continuing on intermittently for additional two months thereafter. For each day, an aggregate symptom score computed as the sum of the relative severities of the symptoms, each weighted by its specificity to COVID-19, shows a bell shaped curve. Also notable is that fatigue stays on as a long hauler symptom. (C) The bar plot shows the percentages of red alert periods (from NightSignal algorithm) associated with each symptom/activity as annotated by both COVID-19 positive and negative participants. Except for fatigue and poor sleep, all other symptoms show a wide margin between the higher alert association of the COVID-19 positives and the lower alert association of the COVID-19 negatives.
Figure 6.
Figure 6.. Examples illustrating the association between RHR elevation (as they trigger real time alerts from online NightSignal, online RHRAD, and online CuSum algorithms), and symptoms/activities.
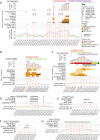
(A) COVID-19 positive case: Alerts begin prior to symptom onset and continue until diagnosis date. Higher RHR elevations seem to be triggered by severe fatigue, fever and headache. (B) COVID-19 Negative case: Alerts even though present throughout the symptom period, the magnitude of RHR elevation is noticeably lower. (C) Mycoplasma Pneumonia case: Alerts begin post symptom onset and continue until a day before recovery. Symptom scores follow a neat bell shaped curve. An interesting observation: On the 4th day, the participant got tested for COVID-19 but was negative. However, symptoms continued to increase and when tested on the 8th day for other respiratory infections, Mycoplasma Pneumoniac was detected. On the 14th day (5 days after antibiotic therapy), both symptoms and alerts receded. (D) and (E) Stress, poor sleep and mood change correlate well with occurrence of alerts in the COVID-19 Negative individuals. (F) Association between repeated alcohol consumption and alerts. (G) Association between extended altitude change and alerts.
Figure 7.
Figure 7.. Association of red alerts in the NightSignal algorithm and RHR overnight with COVID-19 vaccination.
(A) Examples of the effect of COVID-19 vaccination on triggering the alerts in the online NightSignal algorithm. (B) The significant effect of COVID-19 vaccination on average RHR overnight in case of Moderna first dose, Pfizer-BioNTech first dose, Moderna second dose, Pfizer-BioNTech second dose respectively from left to right. Note that, during the vaccination window (five days prior to five days after vaccination), the maximum average RHR often happens at the next night or two nights after the vaccination, especially in the second dose (46% in Moderna and 54% in Pfizer-BioNTech). C, Distribution of symptoms reported for one week after the first (top) and second dose (bottom) of COVID-19 vaccines, Moderna and Pfizer-BioNTec. For the first dose, fatigue, poor sleep, and aches and pain are the most frequently reported symptoms with either vaccine. For the second dose, aches and pain, fatigue, and headache are the most reported symptoms in both Moderna and Pfizer-BioNTec vaccines.

References

    1. Lauer Stephen A et al. “The Incubation Period of Coronavirus Disease 2019 (COVID-19) From Publicly Reported Confirmed Cases: Estimation and Application.” Annals of internal medicine vol. 172,9 (2020): 577–582. doi:10.7326/M20-0504. - DOI - PMC - PubMed
    1. Watson J, Whiting P F, Brush J E. Interpreting a covid-19 test result BMJ 2020; 369 :m1808. - PubMed
    1. Pollock A M, Lancaster J. Asymptomatic transmission of covid-19 BMJ 2020; 371 :m4851.
    1. Long QX., Liu BZ., Deng HJ. et al. Antibody responses to SARS-CoV-2 in patients with COVID-19. Nat Med 26, 845–848 (2020). - PubMed
    1. World Health Organization. (2020). Laboratory testing for coronavirus disease 2019 (COVID-19) in suspected human cases: interim guidance, 2 March 2020. World Health Organization. https://apps.who.int/iris/handle/10665/331329.

Publication types