[Preprint]. 2021 Jun 23:2021.06.19.21259169.
doi: 10.1101/2021.06.19.21259169.

SARS-CoV-2 under an elimination strategy in Hong Kong

Affiliations

SARS-CoV-2 under an elimination strategy in Hong Kong

Haogao Gu et al. medRxiv. .

Update in

  • Genomic epidemiology of SARS-CoV-2 under an elimination strategy in Hong Kong.
    Gu H, Xie R, Adam DC, Tsui JL, Chu DK, Chang LDJ, Cheuk SSY, Gurung S, Krishnan P, Ng DYM, Liu GYZ, Wan CKC, Cheng SSM, Edwards KM, Leung KSM, Wu JT, Tsang DNC, Leung GM, Cowling BJ, Peiris M, Lam TTY, Dhanasekaran V, Poon LLM. Gu H, et al. Nat Commun. 2022 Feb 8;13(1):736. doi: 10.1038/s41467-022-28420-7. Nat Commun. 2022. PMID: 35136039 Free PMC article.

Abstract

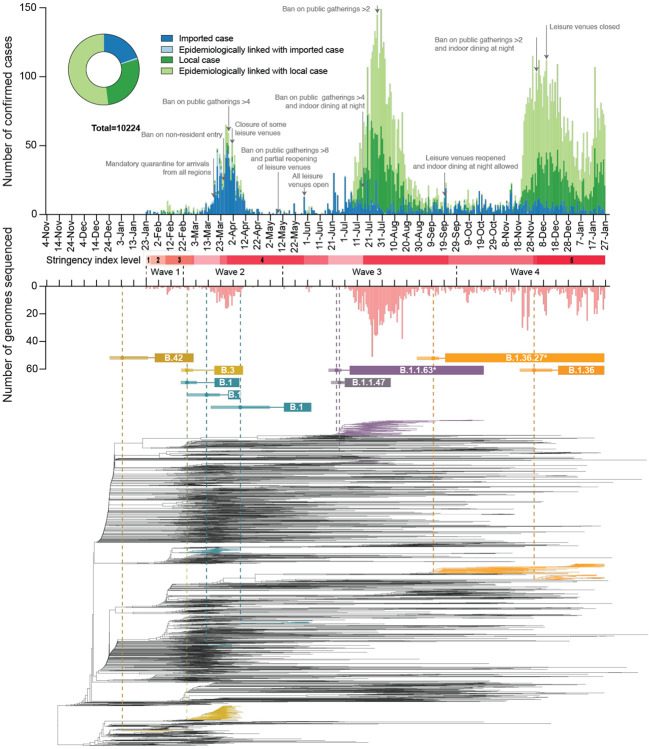
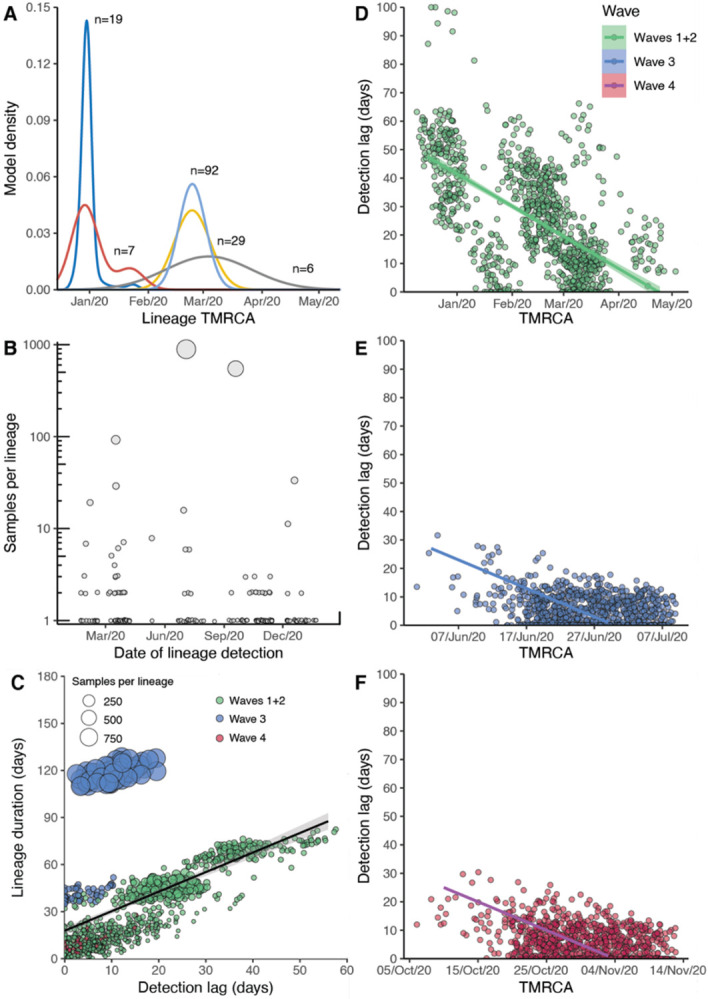
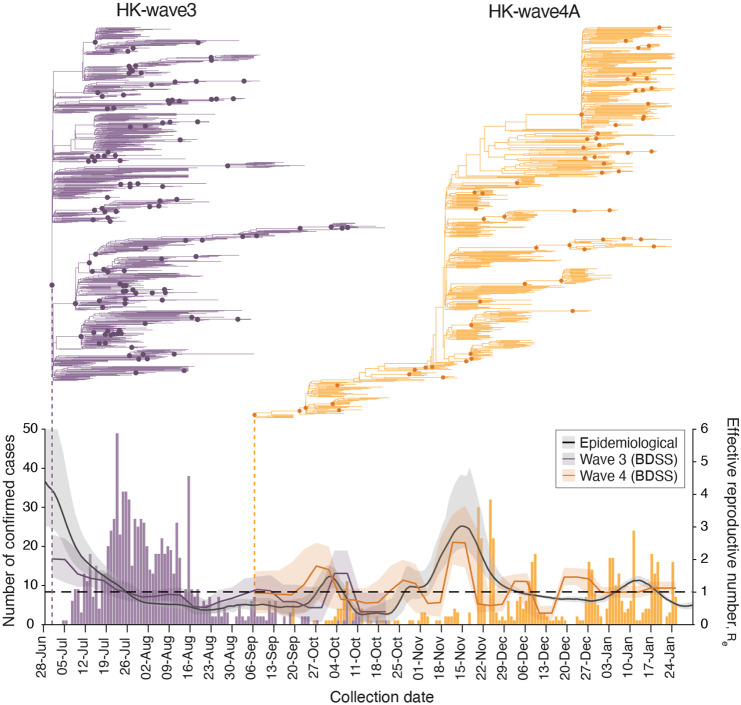
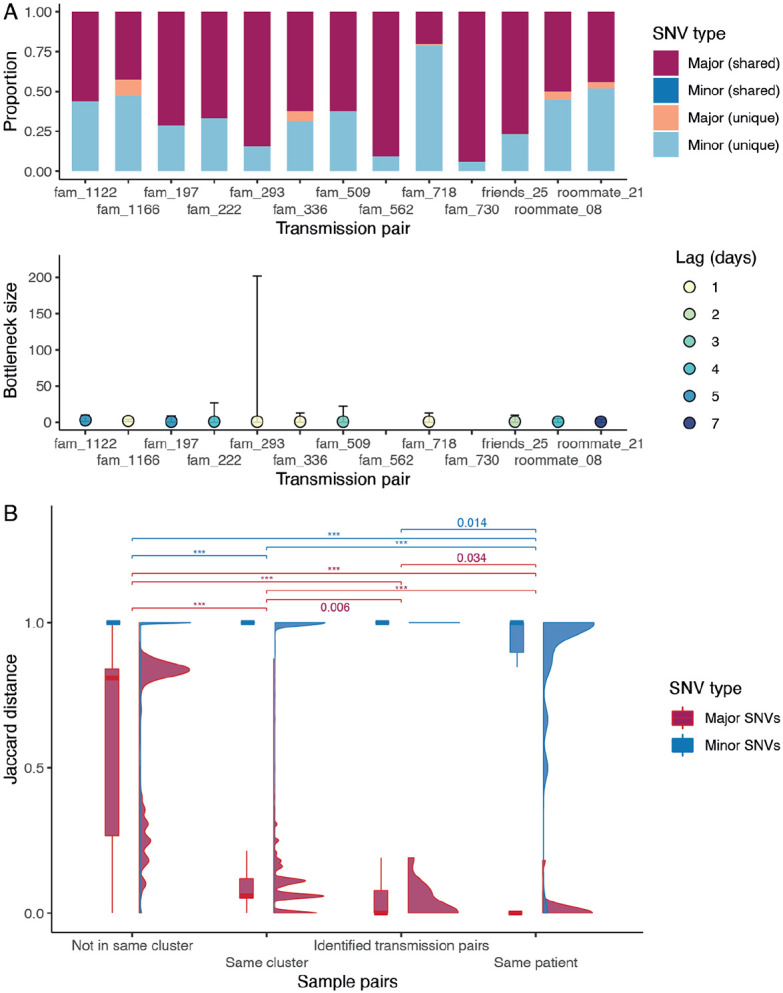
Hong Kong utilized an elimination strategy with intermittent use of public health and social measures and increasingly stringent travel regulations to control SARS-CoV-2 transmission. By analyzing >1700 genome sequences representing 17% of confirmed cases from 23-January-2020 to 26-January-2021, we reveal the effects of fluctuating control measures on the evolution and epidemiology of SARS-CoV-2 lineages in Hong Kong. Despite numerous importations, only three introductions were responsible for 90% of locally-acquired cases, two of which circulated cryptically for weeks while less stringent measures were in place. We found that SARS-CoV-2 within-host diversity was most similar among transmission pairs and epidemiological clusters due to a strong transmission bottleneck through which similar genetic background generates similar within-host diversity.

One sentence summary: Out of the 170 detected introductions of SARS-CoV-2 in Hong Kong during 2020, three introductions caused 90% of community cases.


Figures

Fig. 1
Fig. 1. Epidemiological summary and time-scaled phylogeny of SARS-CoV-2 in Hong Kong.
The number of genomes sequenced in this study is shown below in light red. Time-scaled phylogeny of SARS-CoV-2 genomes from Hong Kong, in which lineages HK-wave3 and HK-wave4A were subsampled to 100 and 65 sequences, showing B.1.1.63* and B.1.36.27*, respectively. *denotes the real clade contains more than one PANGO lineage (see Materials and Methods and table S4). Red shaded bars below the timeline delineate five stringency levels of control measures in Hong Kong based on the Oxford COVID-19 Government response tracker (level 1: <40; level 2 : 40–50; level 3: 50–60; level 4: 60–70; level 5: >70) (12).
Fig. 2
Fig. 2. Descriptive and temporal dynamics of SARS-CoV-2 lineages in Hong Kong.
(A) Time to most recent common ancestor (tMRCA) among the five earliest locally circulating lineages of SARS-CoV-2 introduced into Hong Kong. (B) Number of SARS-CoV-2 genomic samples per lineage identified over time. Lineage size is ordered on a log10 scale, and plotted by the earliest confirmation date among the lineages. (C) Correlation between the detection lag of locally circulating lineages and the final lineage duration. Points represent a random sample of 1,000 lineages from a Bayesian posterior tree distribution (n=8,000). (D:E) Detection lag over time as a function of tMRCA across three epidemic periods (D) waves one and two, (E) wave three, (F) wave four. Overall, a significant reduction in detection lag was observed over time and across each epidemic wave. Points in each panel represent a random sample of 1,000 lineages from a Bayesian posterior tree distribution (n=8,000).
Fig. 3
Fig. 3. Phylodynamics of waves three and four in Hong Kong.
Evolutionary relationships and effective reproduction number (Re(t)) of HK-wave3 (B.1.1.63) clade (purple) and HK-wave4A (B.1.36.27) clade (orange) estimated using tree-heights and sequenced incidence data. Purple and orange bars show the number of genomes by collection date. Black line shows the instantaneous effective reproduction number (Rt), estimated based on infection dates inferred from the reported dates of symptom onset (or dates of confirmation for asymptomatic cases).
Fig. 4
Fig. 4. Transmission bottleneck and mutation profiles between cases.
(A) Proportion of shared mutations and transmission bottleneck size estimations (with 95% confidence intervals) between samples from established transmission pairs. The estimates for transmission pairs fam_562 and fam_730 are not available due to a limited number of SNVs in the recipients’ samples. (B) Jaccard distance of the major and minor SNVs between different types of sample pairs. The distribution is shown in both boxplot and density plot. The between-group differences were tested by Wilcoxon tests, and p values < 0.05 are shown (p values < 0.001 are labelled as ***).

References

    1. Wu F. et al., A new coronavirus associated with human respiratory disease in China. Nature 579, 265–269 (2020). - PMC - PubMed
    1. Dong E., Du H., Gardner L., An interactive web-based dashboard to track COVID-19 in real time. Lancet Infect Dis 20, 533–534 (2020). - PMC - PubMed
    1. Verity R. et al., Estimates of the severity of coronavirus disease 2019: a model-based analysis. Lancet Infect Dis 20, 669–677 (2020). - PMC - PubMed
    1. Russell T. W. et al., Estimating the infection and case fatality ratio for coronavirus disease (COVID-19) using age-adjusted data from the outbreak on the Diamond Princess cruise ship, February 2020. Euro Surveill 25, (2020). - PMC - PubMed
    1. Wu J. T. et al., Estimating clinical severity of COVID-19 from the transmission dynamics in Wuhan, China. Nat Med 26, 506–510 (2020). - PMC - PubMed

Publication types