

Short-term mortality from HIV-infected persons diagnosed from 2012 to 2016: Impact of late diagnosis of HIV infection
- PMID: 34190180
- PMCID: PMC8257899
- DOI: 10.1097/MD.0000000000026507
Short-term mortality from HIV-infected persons diagnosed from 2012 to 2016: Impact of late diagnosis of HIV infection
Abstract
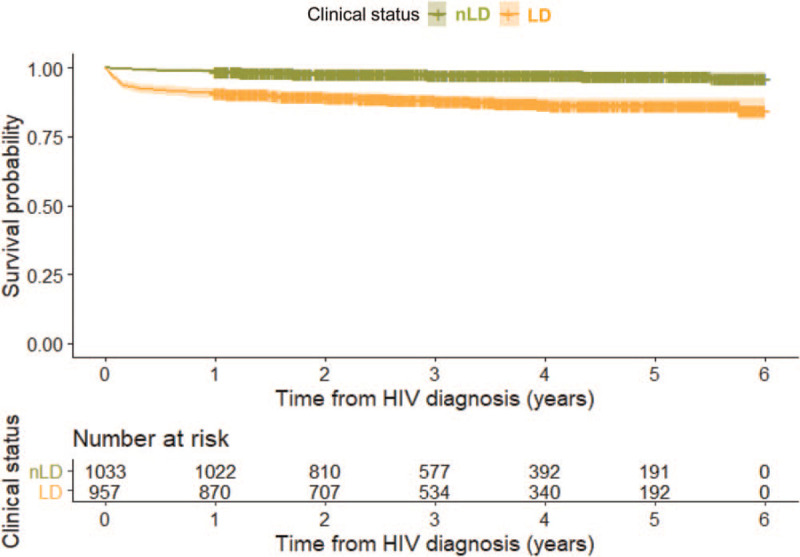
We investigated the temporal trends of short-term mortality (death within 1 year of diagnosis) and cause-specific deaths in human immunodeficiency virus (HIV)-infected persons by stage of HIV infection at diagnosis. We also assessed the impact of late diagnosis (LD) on short-term mortality.Epidemiological records of HIV-infected Singapore residents from the National HIV Registry were linked to death records from the Registry of Births and Deaths for observational analyses. Newly-diagnosed HIV cases with available cluster of differentiation 4 count at time of diagnosis in a 5-year period from 2012 to 2016 were included in the study. Hazard ratios (HRs) and 95% confidence interval (CI) of LD for all deaths excluding suicides and self-inflicted or accidental injuries, and HIV/ acquired immunodeficiency syndrome (AIDS)-related deaths occurring within 1 year post-diagnosis were calculated using Cox proportional hazards regression models with adjustment for age at HIV/AIDS diagnosis. Population attributable risk proportions (PARPs) were then calculated using the adjusted HRs.Of the 1990 newly-diagnosed HIV cases included in the study, 7.2% had died by end of 2017, giving an overall mortality rate of 2.16 per 100 person-years (PY) (95% CI 1.82-2.54). The mortality rate was 3.81 per 100 PY (95% CI 3.15-4.56) in HIV cases with LD, compared with 0.71 (95% CI 0.46-1.05) in non-LD (nLD) cases. Short-term mortality was significantly higher in LD (9.1%) than nLD cases (1.1%). Of the 143 deaths reported between 2012 and 2017, 58.0% were HIV/AIDS-related (nLD 28.0% vs LD 64.4%). HIV/AIDS-related causes represented 70.4% of all deaths which occurred during the first year of diagnosis (nLD 36.4% vs LD 74.7%). The PARP of short-term mortality due to LD was 77.8% for all deaths by natural causes, and 87.8% for HIV/AIDS-related deaths.The mortality rate of HIV-infected persons with LD was higher than nLD, especially within 1 year of diagnosis, and HIV/AIDS-related causes constituted majority of these deaths. To reduce short-term mortality, persons at high risk of late-stage HIV infection should be targeted in outreach efforts to promote health screening and remove barriers to HIV testing and treatment.
Copyright © 2021 the Author(s). Published by Wolters Kluwer Health, Inc.
Conflict of interest statement
The authors have no funding and conflicts of interest to disclose.
Figures


References
-
- Marks G, Crepaz N, Senterfitt JW, Janssen RS. Meta-analysis of high-risk sexual behavior in persons aware and unaware they are infected with HIV in the United States: implications for HIV prevention programs. J Acquir Immune Defic Syndr 2005;39:446–53. - PubMed
-
- Fisher M. Late diagnosis of HIV infection: major consequences and missed opportunities. Curr Opin Infect Dis 2008;21:01–3. - PubMed
-
- Girardi E, Sabin CA, Monforte AD. Late diagnosis of HIV infection: epidemiological features, consequences and strategies to encourage earlier testing. J Acquir Immune Defic Syndr 2007;46: suppl: S3–8. - PubMed
-
- Simmons RD, Ciancio BC, Kall MM, Rice BD, Delpech VC. Ten-year mortality trends among persons diagnosed with HIV infection in England and Wales in the era of antiretroviral therapy: AIDS remains a silent killer. HIV Med 2013;14:596–604. - PubMed
Publication types
MeSH terms
LinkOut - more resources
Full Text Sources
Medical
Research Materials
