

A CRMP4-dependent retrograde axon-to-soma death signal in amyotrophic lateral sclerosis
- PMID: 34190355
- PMCID: PMC8408612
- DOI: 10.15252/embj.2020107586
A CRMP4-dependent retrograde axon-to-soma death signal in amyotrophic lateral sclerosis
Abstract
Amyotrophic lateral sclerosis (ALS) is a fatal non-cell-autonomous neurodegenerative disease characterized by the loss of motor neurons (MNs). Mutations in CRMP4 are associated with ALS in patients, and elevated levels of CRMP4 are suggested to affect MN health in the SOD1G93A -ALS mouse model. However, the mechanism by which CRMP4 mediates toxicity in ALS MNs is poorly understood. Here, by using tissue from human patients with sporadic ALS, MNs derived from C9orf72-mutant patients, and the SOD1G93A -ALS mouse model, we demonstrate that subcellular changes in CRMP4 levels promote MN loss in ALS. First, we show that while expression of CRMP4 protein is increased in cell bodies of ALS-affected MN, CRMP4 levels are decreased in the distal axons. Cellular mislocalization of CRMP4 is caused by increased interaction with the retrograde motor protein, dynein, which mediates CRMP4 transport from distal axons to the soma and thereby promotes MN loss. Blocking the CRMP4-dynein interaction reduces MN loss in human-derived MNs (C9orf72) and in ALS model mice. Thus, we demonstrate a novel CRMP4-dependent retrograde death signal that underlies MN loss in ALS.
Keywords: ALS; CRMP4; axonal transport; dynein; retrograde signaling.
© 2021 The Authors. Published under the terms of the CC BY NC ND 4.0 license.
Conflict of interest statement
The authors declare that they have no conflict of interest point.
Figures
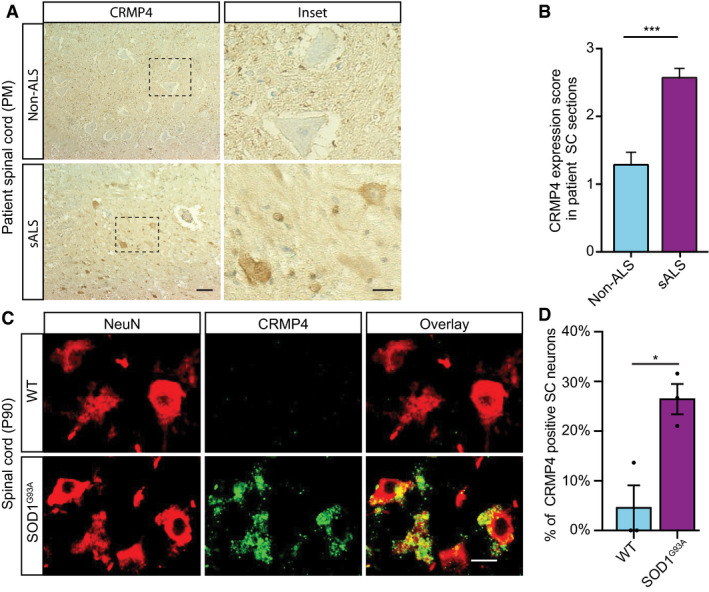
- A, B
(A) Representative IHC images and (B) semi quantification of CRMP4 protein in human spinal cords (SC) cross sections from 2 controls and 3 ALS patients. We analyzed total of 7 SC sections of controls and 14 SC sections of ALS patients, data presented as mean ± SE. DAB: labeled CRMP4. Scale bar: left images 20 µm, right insets 10 µm. Mann‐Whitney test ***P = 0.0003.
- C
Representative images of P90 SC cross sections of SOD1G93A and WT mice. Red: denotes NeuN, Green: denotes CRMP4. Scale bar: 10 μm.
- D
Quantification of the percentage of CRMP4‐positive SC neurons in 3 WT VS. 3 SOD1G93A mice. We monitored CRMP4 expression in total of 108 cells in WT condition and 123 cells in SOD1G93A, an average of 36 or 41 cells in each repeat respectively. Student's t‐test, n = 3, data presented as mean ± SE, *P = 0.0161.
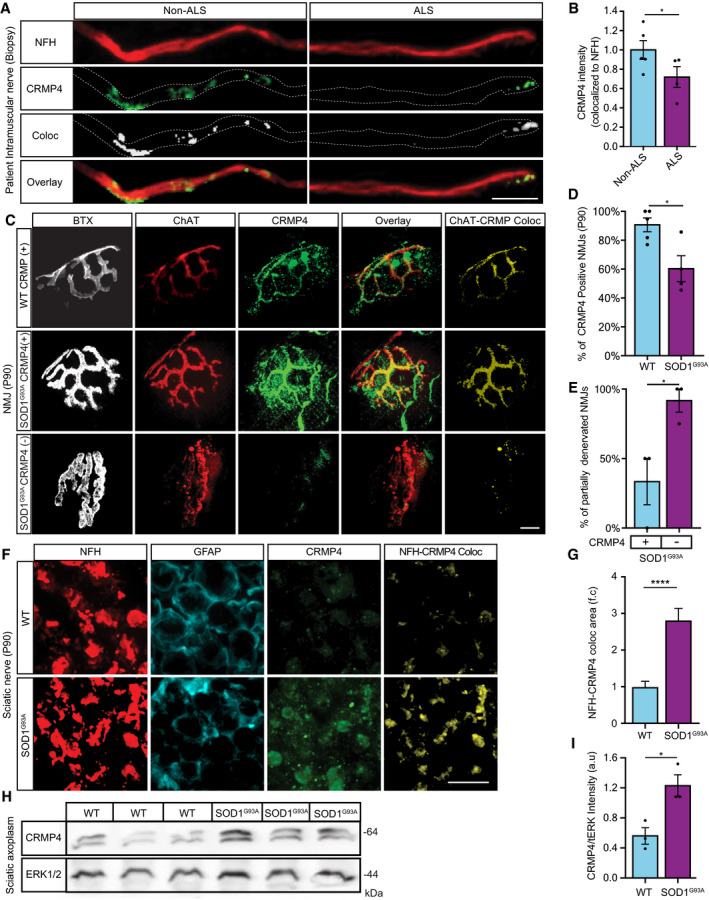
- A
Representative images of ALS patient or non‐ALS human control intra‐muscular nerves. Red: denotes NFH, Green: denotes CRMP4, White: denotes co‐localization area using Imaris software. Scale bar: 20 μm.
- B
Quantification of CRMP4 intensity levels in NFH‐positive intra‐muscular distal nerves from 5 non‐ALS controls and 4 sALS patients. We analyzed 40 terminal axons from the healthy samples (~ 8 axons per sample) and 36 terminal axons from sALS samples (~ 8 axons per sample). Data presented as mean ± SE. Student's t‐test, *P = 0.0475.
- C
Representative images of SOD1G93A/ChAT::tdTomato or WTChAT::tdTomato neuromuscular junctions (NMJ's) at P90. White: denotes BTX, Red: denotes direct ChAT, Green: denotes CRMP4, Yellow: denotes Z projection of 3D Imaris co‐localization of CRMP4 and ChAT. Scale bar: 10 µm.
- D
Quantification of CRMP4‐positive NMJ's in gastrocnemius muscles from 3 WT or 3 SOD1G93A P90 mice. Total of 44 NMJ’s in WT condition and 60 NMJ’s in SOD1G93A condition. Student's t‐test, n = 3, data presented as mean ± SE, *P = 0.0157.
- E
Quantification of the percent of partially denervated NMJ’s in the presence or absence of CRMP4 immunostaining in 3 different SOD1G93A mice. We counted 24 NMJ’s in SOD1G93A CRMP4 negatives and 67 NMJ’s in SOD1G93A CRMP4 positives. Student's t‐test, n = 3, data presented as mean ± SE, *P = 0.0352.
- F
Representative images of P90 SOD1G93A and WT sciatic nerves. Red: denotes NFH, Cyan: denotes GFAP and green denotes CRMP4, Yellow: denotes the Z projection of 3D Imaris co‐localization of CRMP4 and NFH. Scale bar: 5 μm.
- G
Quantification of the co‐localization area of CRMP4 with NFH in the sciatic nerve in 3 SOD1G93A mice compared to 3 WT mice using Imaris analysis. 14 WT sciatic nerve sections and 11 SOD1G93A sections were monitored. Data presented as mean ± SE. Student's t‐test, n = 3, ****P < 0.0001.
- H, I
Western blot analysis and quantification of 3 independent repeats of P90 SN tissues for CRMP4 expression levels (size of ~ 64 kDa) in SOD1G93A compared to WT. tERK was used as a loading control (size of ~ 44 kDa). Student's t‐test, n = 3, data presented as mean ± SE, *P = 0.0215.
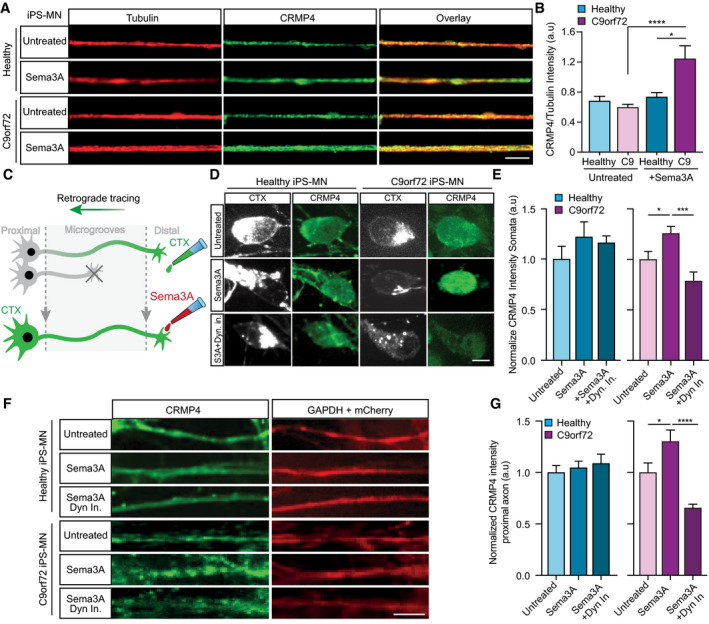
Representative images of healthy or C9orf72 iPSC‐derived MNs treated with Sema3A or untreated in the distal compartment, 8 h post‐treatment. Red: denotes Tubulin, Green: denotes CRMP4. Scale bar: 5 μm.
Quantification of CRMP4 intensity levels in healthy or C9orf72 iPSC‐derived MNs with Sema3A treatment or untreated. 14 untreated healthy axons, 12 healthy axons with Sema3A treatment, 49 untreated C9orf72 axons, and 31 C9orf72 axons with Sema3A treatment were monitored from 3 different chambers. One‐way ANOVA, Tukey's multiple comparisons test, n = 3, data presented as mean ± SE, *P = 0.0338; ****P < 0.0001.
Illustration of the experimental procedure for MNs in an MFC treated with the fluorescently tagged retrograde tracer CTX in the distal compartment. Neuronal cell bodies in the primary neuron whose axons have traversed into the distal compartment were also labeled by the retrograde tracer.
Representative images of healthy or C9orf72 human‐derived MN cell somata with Sema3A treatment, Sema3A + dynein inhibitor treatment, or untreated. Gray: denotes CTX, Green: denotes CRMP4. Scale bar: 5 μm.
Quantification of CRMP4 intensity (normalized to GAPDH + mCherry/area) levels at the somata of healthy or C9orf72 human‐derived MN after Sema3A treatment, Sema3A + dynein inhibitor treatment, or untreated. Analysis performed in 3 independent chambers per condition. 19 healthy untreated cell somata, 26 healthy cell somata with Sema3A treatment, 20 healthy cell somata with Sema3A + dynein inhibitor treatment and 14 C9orf72 cell somata from each condition were monitored. One‐way ANOVA, Newman–Keuls multiple comparisons test, n = 3, data presented as mean ± SE, *P = 0.0207; ***P = 0.0004.
Representative images of healthy or C9orf72 human‐derived MN proximal axons with Sema3A treatment, Sema3A + dynein inhibitor treatment, or untreated control. Green: denotes CRMP4, Red: denotes GAPDH. Scale bar: 5 μm.
Quantification of CRMP4 intensity levels (normalized to GAPDH + mCherry/area) at the proximal axons in healthy or C9orf72 human‐derived MN after Sema3A treatment, Sema3A + dynein inhibitor treatment, or untreated control. Analysis performed from 3 independent chambers in each condition. 21 healthy untreated proximal axons, 24 healthy proximal axons with Sema3A treatment, 16 healthy proximal axons with Sema3A + dynein inhibitor treatment, 12 C9orf72 untreated proximal axons, 8 C9orf72 proximal axons with Sema3A treatment and 13 C9orf72 proximal axons with Sema3A + dynein inhibitor treatment were monitored. One‐way ANOVA, Newman‐Keuls multiple comparisons test, n = 3, data presented as mean ± SE, *P = 0.0334, ****P < 0.0001.
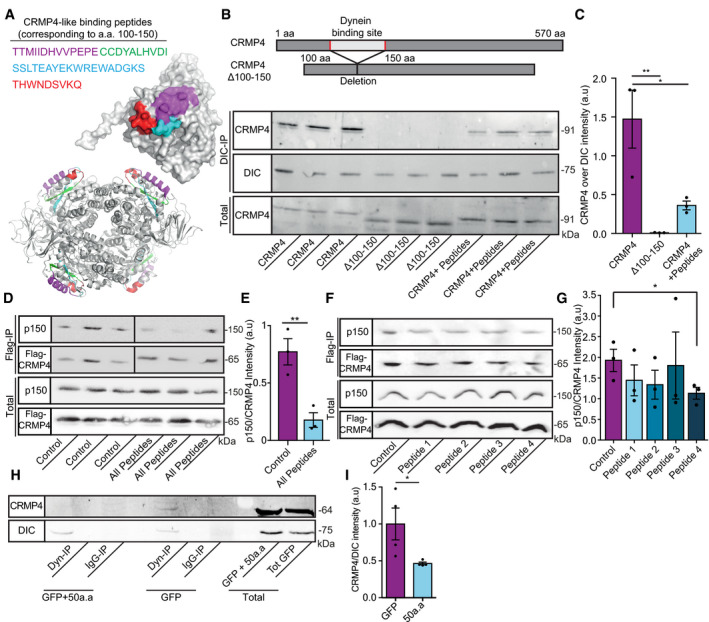
Crystal structures (PDB code 4CNT) of a CRMP4 monomer (upper panel) and biological tetramer assembly (lower panel). The peptides that were selected to inhibit binding are highlighted and color coded as indicated.
Upper panel represents the binding site domain of dynein in CRMP4 and its deletion. Middle panel—Immunoprecipitation of DIC followed by western blot analysis of CRMP4 in COS7 cells overexpressing either GFP‐CRMP4, or GFP‐CRMP4 with deletion of amino acid 100–150, or GFP‐CRMP4 overexpressing cells that were pre‐incubated with a 10 µm mixture of peptides 1–4 (size of ~ 91 kDa). Lower panel ‐ Western blot analysis of total protein levels before the pull‐down assay (DIC size: ~ 75 kDa).
Quantification of the Western blot in B from 3 independent repeats. One‐way ANOVA, Tukey's multiple comparisons test, n = 3, data presented as mean ± SE, **P = 0.007, *P = 0.0261.
Upper panel ‐ immunoprecipitation assay with anti‐Flag antibody followed by Western blot analysis of dynactin (p150) (size of ~ 150 kDa) in COS7 cells overexpressing Flag‐CRMP4 (size of ~ 65 kDa). Lower panel ‐ total protein input.
Quantification of the blot in D from 3 independent repeats. The dynactin intensity band was normalized to the Flag‐CRMP4 intensity band in each repeat. Student’s t‐test, n = 3, data presented as mean ± SE, **P = 0.01.
Upper panel ‐ Immunoprecipitation assay with anti‐Flag antibody followed by Western blot analysis of dynactin (p150) (size of ~ 150 kDa) in COS7 cells overexpressing Flag‐CRMP4 (size of ~ 65 kDa). Lower panel ‐ Total input.
Quantification of the blot in F. The dynactin intensity band was normalized to the Flag‐CRMP4 intensity band in each repeat. Student’s t‐test, n = 3, data presented as mean ± SE, *P = 0.0299.
Immunoprecipitation of DIC (size of ~ 75 kDa) followed by Western blot analysis of CRMP4 (size of ~ 64 kDa) in COS7 cells that were transfected with CRMP4 and AAV9‐50aa or its control. IgG antibody was used as a control.
Quantification of the blot in H from 3 independent repeats. The CRMP4 intensity band was normalized to the DIC intensity band in each repeat. Student’s t‐test, n = 3, data presented as mean ± SE, *P = 0.0479.
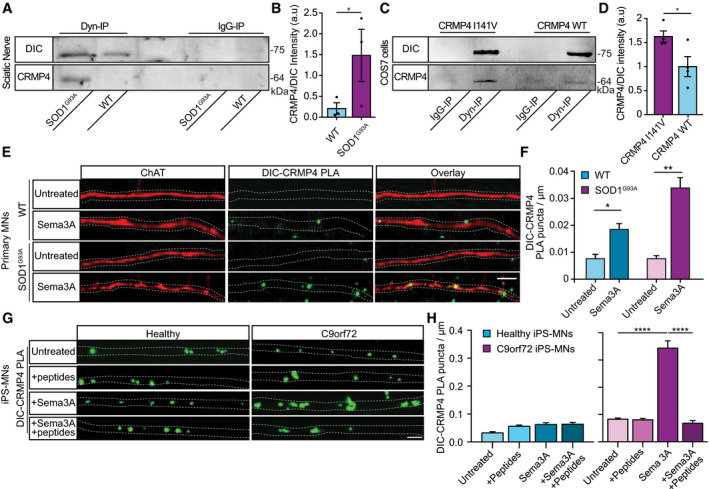
Immunoprecipitation of DIC followed by Western blot analysis of CRMP4 in SOD1G93A compared to WT P90 sciatic nerves under physiological conditions. IgG antibody was used as a control.
Quantification of the blot in A. 3 repeats, 12 sciatic nerves per condition were used in each repeat. The CRMP4 intensity band was normalized to the DIC intensity band in each repeat. Data presented as mean ± SE (Ratio Paired t‐test, *P = 0.0416).
Immunoprecipitation of DIC followed by Western blot analysis of CRMP4 in COS7 cells that were transfected with mutant CRMP4 I141V compared to control. IgG antibody was used as a control.
Quantification of four repeated pull down in C. The CRMP4 intensity band was normalized to the DIC intensity band for each repeat. (Student’s t‐test, n = 4, data presented as mean ± SE, *P = 0.0393).
Representative images from the proximity ligation assay (For explanation of PLA technique; please refer to method section) for CRMP4 and dynein in SOD1G93A and WT primary MNs axons that were exposed to either control or Sema3A 8h post‐treatment. Scale bar: 5µm.
Quantification of the CRMP4‐DIC puncta number per primary motor neuron axon in each condition. We analyzed ~ 20 axons per condition from 3 independent chambers per group (One‐way ANOVA, Tukey's multiple comparisons test, n = 3, data presented as mean ± SE, **P = 0.01, *P = 0.04).
Representative images of proximity ligation assay for CRMP4 and dynein in healthy and C9orf72 human‐derived proximal axons post peptides treatment, Sema3A treatment, Sema3A + peptides treatment, or untreated controls. Scale bar: 5 µm.
Quantification of the CRMP4‐DIC puncta number per axon in healthy or C9orf72 human‐derived MN proximal axons after Sema3A treatment, Sema3A + peptides treatment, or untreated controls. Data collected from 3 independent chambers in each condition. Total of 37 healthy untreated proximal axons, 61 healthy proximal axons with peptides treatment, 59 healthy proximal axons with Sema3A treatment and 52 healthy proximal axons with Sema3A + peptides treatment. 67 C9orf72 untreated proximal axons, 63 C9orf72 proximal axons with peptides treatment, 41 C9orf72 proximal axons with Sema3A treatment, and 50 C9orf72 proximal axons with Sema3A + peptides treatment monitored. Data presented as mean ± SE. One‐way ANOVA, Tukey's multiple comparisons test, n = 3, ****P < 0.0001.
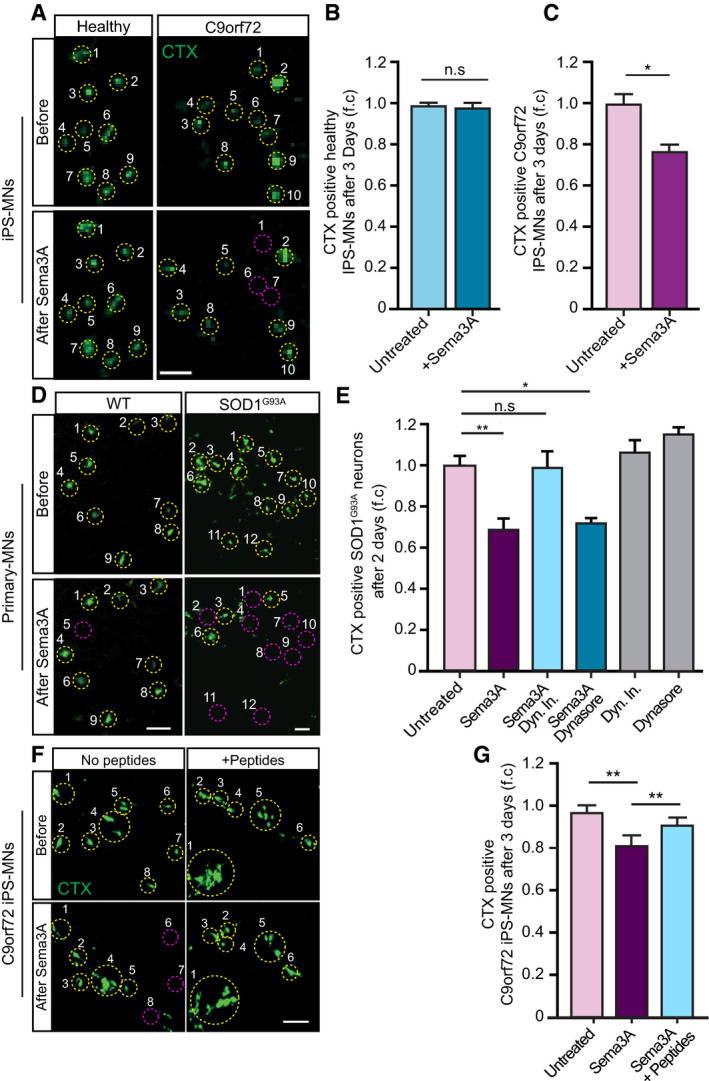
- A
Representative images of CTX signal in healthy and C9orf72 human IPSC‐derived MNs before and after Sema3A application. Green: denotes CTX‐positive cells. Yellow circles are numbered CTX‐positive cells. Purple circles are cells that are missing post Sema3A treatment. Scale bar: 40 μm.
- B, C
Quantification of CTX signal in healthy and C9orf72 IPSC‐derived MNs before and 3 days after applying Sema3A to distal compartment, compared with untreated control. 3 independent chambers in each condition were analyzed. Average of ~ 150 neurons per condition monitored. Student’s t‐test, n = 3, data presented as mean ± SE, *P < 0.05.
- D
Representative images of CTX signal in WT or SOD1G93A primary MNs before and 2 days after Sema3A application to the distal compartment in the presence of either Dynein inhibitor + Sema3A, Dynasore + Sema3A, or untreated. Green: denotes CTX‐positive cells. Yellow circles are numbered CTX‐positive cells. Purple circles are cells that are missing post Sema3A treatment. Scale bar: 30 μm.
- E
Quantification of CTX signal in a SOD1G93A explant before and 2 days after Sema3A application to the distal compartment in the presence of either Dynein inhibitor + Sema3A, Dynasore + Sema3A. 3 independent chambers in each condition were analyzed. ~ 200 neurons were monitored per each condition. One‐way ANOVA, Tukey's multiple comparisons test, n = 3, data presented as mean ± SE, *P < 0.05, **P < 0.01. Dynein inhibitor and Dynasore treatments were used as a negative control.
- F, G
Representative images and quantification of C9orf72 iPSC‐derived MNs in the proximal compartment of an MFC before and after Sema3A treatment with and without 10 μg peptides 1–4. Green: denotes CTX‐positive cells. Yellow circles are numbered CTX‐positive cells. Purple circles are cells that are missing post Sema3A treatment. 3 independent chambers in each condition were analyzed. ~ 200 neurons per condition monitored. Scale bar: 40µm. One‐way ANOVA Tukey's multiple comparisons test, n = 3, data presented as mean ± SE, **P = 0.004.
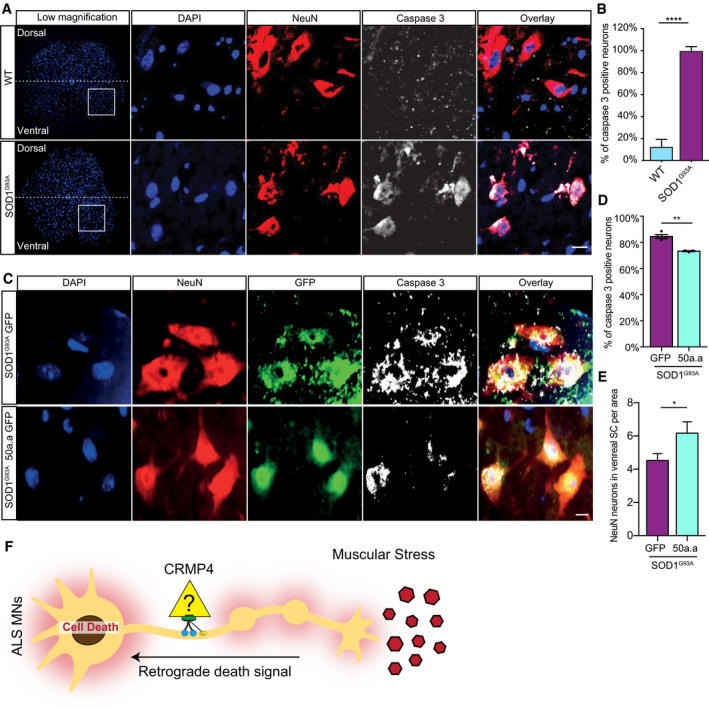
Representative images and insets of WT and SOD1G93A SC cross sections at P90. Blue: denotes DAPI, Red: denoted NeuN, and White: denotes activated caspase 3. Scale bar: 20 µm.
Quantification of active caspase 3‐positive cells in P90 WT and SOD1G93A SC. 3 different mice in each condition analyzed. We monitored active caspase 3 expression in total of 108 cells in WT SC and 123 cells in SOD1G93A. Student’s t‐test, n = 3, data presented as mean ± SE, ****P < 0.0001.
Representative images of P90 SOD1G93A mice SC cross sections that were injected with AAV9‐GFP/AAV9‐50aa‐GFP. Blue: denotes DAPI, Red: denoted NeuN, and White: denotes activated caspase 3. Scale bar: 10 µm.
Quantification of caspase 3‐positive cells in P90 SOD1G93A mice SC cross sections that were injected with either AAV9‐GFP or AAV9‐50aa‐GFP. Data collected from 3 different mice in each condition. We monitored active caspase 3 expression in total of 228 cells in P90 SOD1G93A mice SC cross sections that were injected with AAV9‐GFP and 179 cells P90 SOD1G93A mice SC cross sections that were injected with AAV9‐50aa‐GFP. Student’s t‐test, n = 3, data presented as mean ± SE, **P = 0.0019.
Quantification of the number of NeuN‐positive cells in P90 SOD1G93A mice SC cross sections that were injected with either AAV9‐GFP or AAV9‐50aa‐GFP. Data collected from 3 different mice in each condition. We monitored the number of NeuN‐positive cells from total of 228 cells in P90 SOD1G93A mice SC cross sections that were injected with AAV9‐GFP and 179 cells P90 SOD1G93A mice SC cross sections that were injected with AAV9‐50aa‐GFP. Unpaired t‐test with Welch's correction, n = 3, data presented as mean ± SE, *P = 0.0484.
Working model—CRMP4‐dynein complex formation is enhanced in ALS disease and leads to subtype‐specific neuronal loss.
References
-
- Arimura N, Hattori A, Kimura T, Nakamuta S, Funahashi Y, Hirotsune S, Furuta K, Urano T, Toyoshima YY, Kaibuchi K (2009) CRMP‐2 directly binds to cytoplasmic dynein and interferes with its activity. J Neurochem 111: 380–390 - PubMed
Publication types
MeSH terms
Substances
Grants and funding
LinkOut - more resources
Full Text Sources
Medical
Molecular Biology Databases
Miscellaneous
