Clinical Trial
. 2021 Nov;36(11):2139-2152.
doi: 10.1002/jbmr.4409. Epub 2021 Aug 10.

Romosozumab improves lumbar spine bone mass and bone strength parameters relative to alendronate in postmenopausal women: results from the Active-Controlled Fracture Study in Postmenopausal Women With Osteoporosis at High Risk (ARCH) trial

Affiliations
Clinical Trial

Romosozumab improves lumbar spine bone mass and bone strength parameters relative to alendronate in postmenopausal women: results from the Active-Controlled Fracture Study in Postmenopausal Women With Osteoporosis at High Risk (ARCH) trial

Jacques P Brown et al. J Bone Miner Res. 2021 Nov.

Abstract

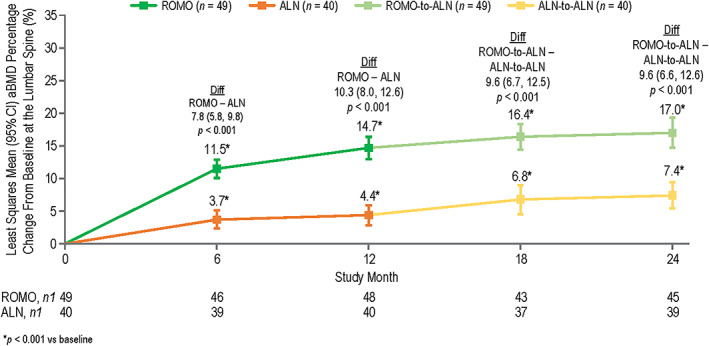
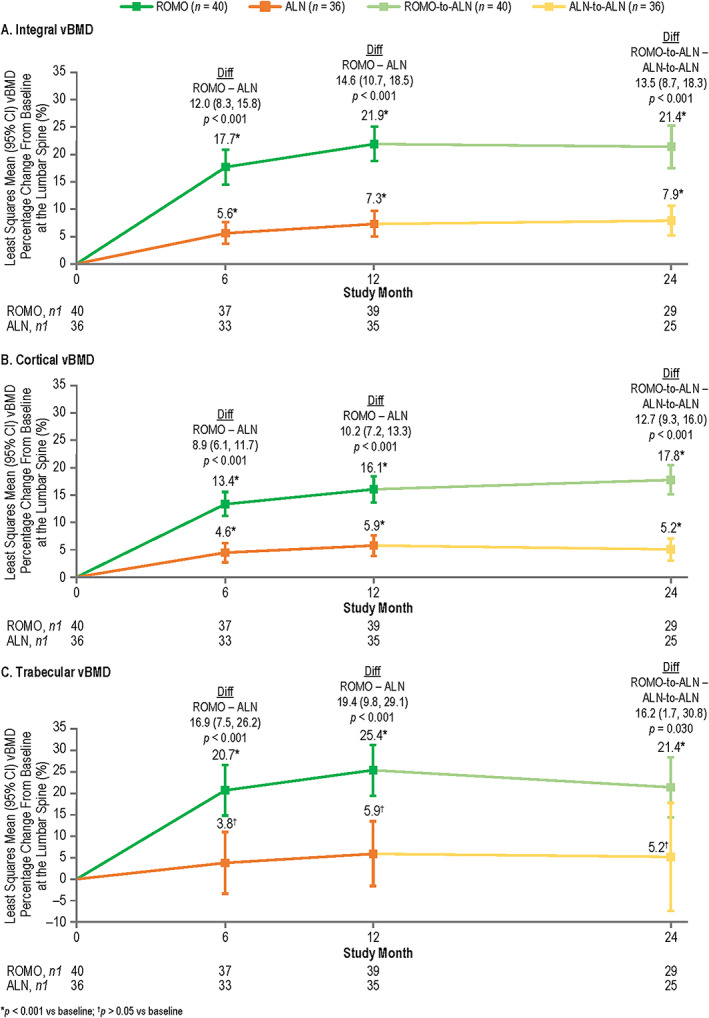
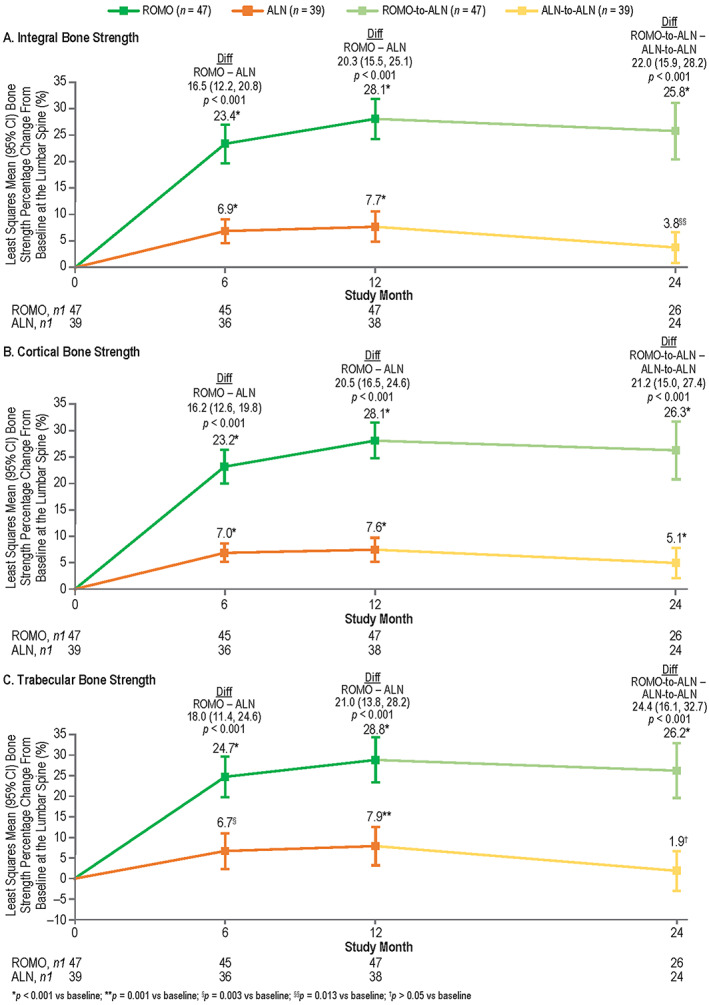
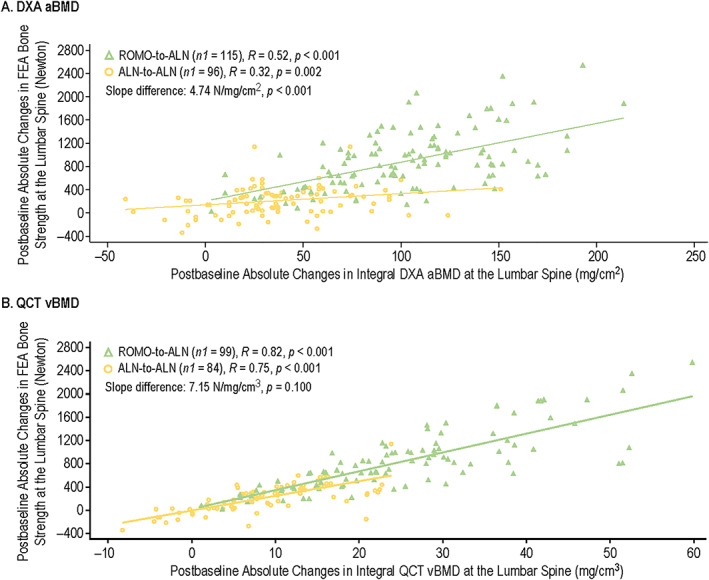
The Active-Controlled Fracture Study in Postmenopausal Women With Osteoporosis at High Risk (ARCH) trial (NCT01631214; https://clinicaltrials.gov/ct2/show/NCT01631214) showed that romosozumab for 1 year followed by alendronate led to larger areal bone mineral density (aBMD) gains and superior fracture risk reduction versus alendronate alone. aBMD correlates with bone strength but does not capture all determinants of bone strength that might be differentially affected by various osteoporosis therapeutic agents. We therefore used quantitative computed tomography (QCT) and finite element analysis (FEA) to assess changes in lumbar spine volumetric bone mineral density (vBMD), bone volume, bone mineral content (BMC), and bone strength with romosozumab versus alendronate in a subset of ARCH patients. In ARCH, 4093 postmenopausal women with severe osteoporosis received monthly romosozumab 210 mg sc or weekly oral alendronate 70 mg for 12 months, followed by open-label weekly oral alendronate 70 mg for ≥12 months. Of these, 90 (49 romosozumab, 41 alendronate) enrolled in the QCT/FEA imaging substudy. QCT scans at baseline and at months 6, 12, and 24 were assessed to determine changes in integral (total), cortical, and trabecular lumbar spine vBMD and corresponding bone strength by FEA. Additional outcomes assessed include changes in aBMD, bone volume, and BMC. Romosozumab caused greater gains in lumbar spine integral, cortical, and trabecular vBMD and BMC than alendronate at months 6 and 12, with the greater gains maintained upon transition to alendronate through month 24. These improvements were accompanied by significantly greater increases in FEA bone strength (p < 0.001 at all time points). Most newly formed bone was accrued in the cortical compartment, with romosozumab showing larger absolute BMC gains than alendronate (p < 0.001 at all time points). In conclusion, romosozumab significantly improved bone mass and bone strength parameters at the lumbar spine compared with alendronate. These results are consistent with greater vertebral fracture risk reduction observed with romosozumab versus alendronate in ARCH and provide insights into structural determinants of this differential treatment effect. © 2021 The Authors. Journal of Bone and Mineral Research published by Wiley Periodicals LLC on behalf of American Society for Bone and Mineral Research (ASBMR).

Keywords: BONE MINERAL CONTENT; BONE STRENGTH; FINITE ELEMENT ANALYSIS; POSTMENOPAUSAL OSTEOPOROSIS; QUANTITATIVE COMPUTED TOMOGRAPHY.


Figures

FIGURE 1
FIGURE 1
Least squares mean aBMD percentage change from baseline at the lumbar spine with romosozumab or alendronate treatment at months 6, 12, 18, and 24 by DXA. n = number of randomized patients enrolled in the QCT/FEA imaging component of the ARCH substudy with values at baseline and one or more postbaseline DXA visit at month 6 or month 18 and with values at baseline and one or more postbaseline QCT visit; n1 = number of patients with values at that time point. Month 6 and month 12 measurements were during the double‐blind period when patients received monthly romosozumab 210 mg sc or weekly oral alendronate 70 mg for 12 months; month 18 and month 24 measurements were during the open‐label period when patients received weekly oral open‐label alendronate 70 mg for 12 months. Data were based on ANCOVA model, adjusting for presence of severe vertebral fracture at baseline, baseline aBMD value, machine type, and baseline aBMD value‐by‐machine type interaction. Missing values were imputed by carrying forward the last nonmissing postbaseline value prior to the missing value and within the treatment period. Abbreviations: aBMD, areal bone mineral density; ALN, alendronate; ANCOVA, analysis of covariance; ARCH, Active‐Controlled Fracture Study in Postmenopausal Women With Osteoporosis at High Risk; Diff, difference between the treatment groups; DXA, dual‐energy x‐ray absorptiometry; FEA, finite element analysis; QCT, quantitative computed tomography; ROMO, romosozumab.
FIGURE 2
FIGURE 2
Least squares mean vBMD percentage change from baseline at the lumbar spine with romosozumab or alendronate treatment at months 6, 12, and 24 by QCT: integral vBMD (A), cortical vBMD (B), and trabecular vBMD (C). n = number of randomized patients enrolled in the QCT/FEA imaging component of the ARCH substudy with values at baseline and one or more postbaseline visits; n1 = number of patients with values at that time point. Month 6 and month 12 measurements were during the double‐blind period when patients received monthly romosozumab 210 mg sc or weekly oral alendronate 70 mg for 12 months; month 24 measurements were during the open‐label period when patients received open‐label weekly oral alendronate 70 mg for 12 months. Data were based on ANCOVA model, adjusting for presence of severe vertebral fracture at baseline and baseline vBMD value. Missing values were imputed by carrying forward the last nonmissing postbaseline value prior to the missing value and within the treatment period. Abbreviations: ALN, alendronate; ANCOVA, analysis of covariance; ARCH, Active‐Controlled Fracture Study in Postmenopausal Women With Osteoporosis at High Risk; Diff, difference between the treatment groups; FEA, finite element analysis; QCT, quantitative computed tomography; ROMO, romosozumab; vBMD, volumetric bone mineral density.
FIGURE 3
FIGURE 3
Least squares mean bone strength percentage change from baseline at the lumbar spine with romosozumab or alendronate treatment at months 6, 12, and 24 by FEA: integral bone strength (A), cortical bone strength (B), and trabecular bone strength (C). n = number of randomized patients enrolled in the QCT/FEA imaging component of the ARCH substudy with values at baseline and one or more postbaseline visits; n1 = number of patients with values at that time point. Month 6 and month 12 measurements were during the double‐blind period where patients received monthly romosozumab 210 mg sc or weekly oral alendronate 70 mg for 12 months; month 24 measurements were during the open‐label period when patients received weekly oral open‐label alendronate 70 mg for 12 months. Data were based on ANCOVA model, adjusting for presence of severe vertebral fracture at baseline and baseline FEA value. Missing values were imputed by carrying forward the last nonmissing postbaseline value prior to the missing value and within the treatment period. Abbreviations: ALN, alendronate; ANCOVA, analysis of covariance; ARCH, Active‐Controlled Fracture Study in Postmenopausal Women With Osteoporosis at High Risk; Diff, difference between the treatment groups; FEA, finite element analysis; QCT, quantitative computed tomography; ROMO, romosozumab.
FIGURE 4
FIGURE 4
Correlation of postbaseline absolute changes in integral FEA bone strength and postbaseline absolute changes in integral DXA aBMD (A) and integral QCT vBMD (B) at the lumbar spine for romosozumab‐to‐alendronate and alendronate‐to‐alendronate groups through month 24. Includes randomized patients enrolled in the QCT/FEA imaging component of the ARCH substudy with baseline and one or more postbaseline reported results for the parameters of interest. n1 = number of evaluable measurements, with one or more measurements per patient. Month 6 and month 12 measurements were during the double‐blind period where patients received monthly romosozumab 210 mg sc or weekly oral alendronate 70 mg for 12 months; month 24 measurements were during the open‐label period when patients received open‐label weekly oral alendronate 70 mg for 12 months. Abbreviations: aBMD, areal bone mineral density; ALN, alendronate; ARCH, Active‐Controlled Fracture Study in Postmenopausal Women With Osteoporosis at High Risk; DXA, dual‐energy x‐ray absorptiometry; FEA, finite element analysis; QCT, quantitative computed tomography; R, Spearman's correlation coefficient; ROMO, romosozumab; vBMD, volumetric bone mineral density.

References

    1. Morgan EF, Unnikrisnan GU, Hussein AI. Bone mechanical properties in healthy and diseased states. Annu Rev Biomed Eng. 2018;20:119‐143. - PMC - PubMed
    1. Bouxsein ML, Seeman E. Quantifying the material and structural determinants of bone strength. Best Pract Res Clin Rheumatol. 2009;23:741‐753. - PubMed
    1. Warriner AH, Patkar NM, Curtis JR, et al. Which fractures are most attributable to osteoporosis? J Clin Epidemiol. 2011;64:46‐53. - PMC - PubMed
    1. Kendler DL, Bauer DC, Davison KS, et al. Vertebral fractures: clinical importance and management. Am J Med. 2016;129:221.e1‐‐e10. - PubMed
    1. Austin M, Yang Y‐C, Vittinghoff E, et al. Relationship between bone mineral density changes with denosumab treatment and risk reduction for vertebral and nonvertebral fractures. J Bone Miner Res. 2012;27:687‐693. - PMC - PubMed

Publication types

Associated data