. 2021 Jul 30;41(7):BSR20210495.
doi: 10.1042/BSR20210495.

RNA sequencing reveals potential interacting networks between the altered transcriptome and ncRNome in the skeletal muscle of diabetic mice

Affiliations

RNA sequencing reveals potential interacting networks between the altered transcriptome and ncRNome in the skeletal muscle of diabetic mice

Devesh Kesharwani et al. Biosci Rep. .

Abstract

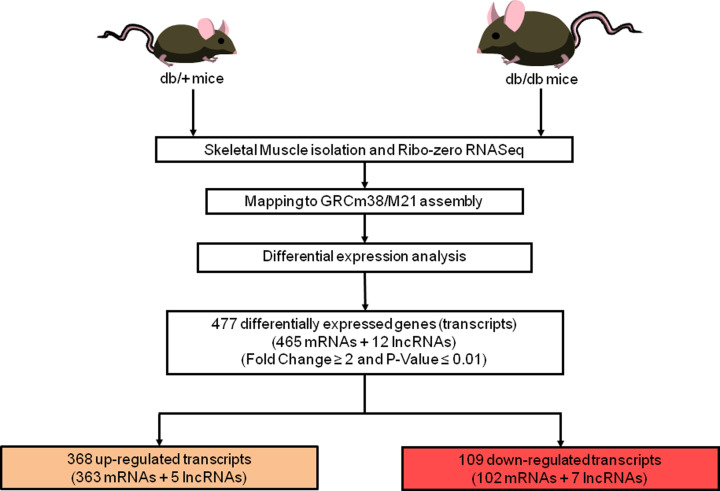
For a global epidemic like Type 2 diabetes mellitus (T2DM), while impaired gene regulation is identified as a primary cause of aberrant cellular physiology; in the past few years, non-coding RNAs (ncRNAs) have emerged as important regulators of cellular metabolism. However, there are no reports of comprehensive in-depth cross-talk between these regulatory elements and the potential consequences in the skeletal muscle during diabetes. Here, using RNA sequencing, we identified 465 mRNAs and 12 long non-coding RNAs (lncRNAs), to be differentially regulated in the skeletal muscle of diabetic mice and pathway enrichment analysis of these altered transcripts revealed pathways of insulin, FOXO and AMP-activated protein kinase (AMPK) signaling to be majorly over-represented. Construction of networks showed that these pathways significantly interact with each other that might underlie aberrant skeletal muscle metabolism during diabetes. Gene-gene interaction network depicted strong interactions among several differentially expressed genes (DEGs) namely, Prkab2, Irs1, Pfkfb3, Socs2 etc. Seven altered lncRNAs depicted multiple interactions with the altered transcripts, suggesting possible regulatory roles of these lncRNAs. Inverse patterns of expression were observed between several of the deregulated microRNAs (miRNAs) and the differentially expressed transcripts in the tissues. Towards validation, overexpression of miR-381-3p and miR-539-5p in skeletal muscle C2C12 cells significantly decreased the transcript levels of their targets, Nfkbia, Pik3r1 and Pi3kr1, Cdkn2d, respectively. Collectively, the findings provide a comprehensive understanding of the interactions and cross-talk between the ncRNome and transcriptome in the skeletal muscle during diabetes and put forth potential therapeutic options for improving insulin sensitivity.

Keywords: RNA sequencing; diabetes; ncRNA; skeletal muscle.


Conflict of interest statement

The authors declare that there are no competing interests associated with the manuscript.

Figures

Figure 1
Figure 1. Schematic representation of the experimental work flow
Overview of experimental and bioinformatics analysis pipeline of RNA-sequencing, to identify differentially regulated genes in skeletal muscles of db/db mice.
Figure 2
Figure 2. Representation of DEGs in diabetic (db/db) mice skeletal muscle (n=4) as compared with that in normal (db/+) mice
(A) Volcano plot of DEGs. The dots in red represent the significantly (P<0.01) down-regulated genes and dots in green represent the significantly (P<0.01) up-regulated genes. (B) Heat map of DEGs. Figure represents the differences in log2 FPKM values of DEGs with fold change ≥ ±2.0 and P<0.01 between normal and diabetic animals.
Figure 3
Figure 3. Pathway enrichment analysis of DEGs
(A) Bar graph of significantly over-represented pathways that the differentially regulated genes map to along with number of genes in each pathway. The black dotted vertical line represents the minimum gene count with cutoff of 10 and yellow bars represent the negative log10P-value. (B) qRT-PCR validation of some differentially expressed mRNAs and lncRNAs as identified by RNA sequencing in the skeletal muscle of the db/db mice. Log2 fold changes with respect to normal animals is expressed (n=4). *P-value <0.05, **P-value <0.01.
Figure 4
Figure 4. CytoScape and ClueGO derived correlation network among genes that mapped on to significantly enriched pathways
DEG names are mentioned in red and significantly (P<0.05) over-represented pathways by these genes are denoted by brown circles. The grey circles represent pathways over-represented by the DEGs, but with a P-value >0.05.
Figure 5
Figure 5. Correlation network among DEGs as derived by CytoScape
Of the differentially expressed transcripts, 244 of them significantly (P<0.05) mapped in interaction networks and this included 7 dysregulated lncRNAs. Potential interactions between these 237 transcripts (cyan) and 7 lncRNAs (pink) is shown. The lncRNAs show direct and indirect interactions with other altered transcripts suggesting potential modes of lncRNA-mediated gene regulation.
Figure 6
Figure 6. Prediction and validation of DEGs as potential targets of deregulated miRNAs in the db/db mice skeletal muscle
(A) MiRNAs altered in the skeletal muscle of diabetic db/db mice were validated by qRT-PCR. One microgram of total RNA was reverse transcribed and quantified using by qRT-PCR and miRNA-specific primers. U6 or sno 234 was used as the normalization control. (B) Putative miRNA targets were extracted from miRDB and TargetScan, and targets of down-regulated miRNAs were matched to the up-regulated genes and vice versa. Green bars represent the number of up-regulated genes that are predicted to be targeted by down-regulated miRNAs and red bars represent the number of down-regulated mRNAs genes that are predicted to be targeted by up-regulated miRNAs. Numbers alongside the bars represent number of genes predicted as targets to the particular miRNA. (C) C2C12 cells were transfected with either the scramble (scr) or miR-381-3p or miR-539-5p (25-50 nM) and after 48 h, total RNA was isolated and the transcript levels of the predicted targets namely, Nfkbia, Pik3r1 (miR-381-3p) and Pik3r1, Cdkn2d (miR-539-5p) were assessed by qRT-PCR using specific primers. 18S rRNA was used as normalization control. (A) *P<0.05, **P<0.01 and ***P<0.001 as compared with db/+ mice; (C) *P<0.05 as compared with scramble (scr).

Similar articles

Cited by

References

    1. Cho N.H., Shaw J.E., Karuranga S., Huang Y., da Rocha Fernandes J.D., Ohlrogge A.W.et al. . (2018) IDF Diabetes Atlas: Global estimates of diabetes prevalence for 2017 and projections for 2045. Diabetes Res. Clin. Pract. 138, 271–281 10.1016/j.diabres.2018.02.023 - DOI - PubMed
    1. Yan Y.X., Xiao H.B., Wang S.S., Zhao J., He Y., Wang W.et al. . (2016) Investigation of the relationship between chronic stress and insulin resistance in a Chinese population. J. Epidemiol. 26, 355–360 10.2188/jea.JE20150183 - DOI - PMC - PubMed
    1. Li L., Li X., Zhou W. and Messina J.L. (2013) Acute psychological stress results in the rapid development of insulin resistance. J. Endocrinol. 217, 175–184 10.1530/JOE-12-0559 - DOI - PMC - PubMed
    1. Kaufman D., Banerji M.A., Shorman I., Smith E.L., Coplan J.D., Rosenblum L.A.et al. . (2007) Early-life stress and the development of obesity and insulin resistance in juvenile bonnet macaques. Diabetes 56, 1382–1386 10.2337/db06-1409 - DOI - PubMed
    1. Kahn B.B. and Flier J.S. (2000) Obesity and insulin resistance. J. Clin. Invest. 106, 473–481 10.1172/JCI10842 - DOI - PMC - PubMed

Publication types

MeSH terms