. 2021 Aug;35(8):e21745.
doi: 10.1096/fj.202100051R.

Plasma ACE2 species are differentially altered in COVID-19 patients

Affiliations

Plasma ACE2 species are differentially altered in COVID-19 patients

María-Salud García-Ayllón et al. FASEB J. 2021 Aug.

Erratum in

  • Erratum.
    [No authors listed] [No authors listed] FASEB J. 2021 Sep;35(9):e21857. doi: 10.1096/fsb2.21857. FASEB J. 2021. PMID: 34403542 Free PMC article. No abstract available.

Abstract

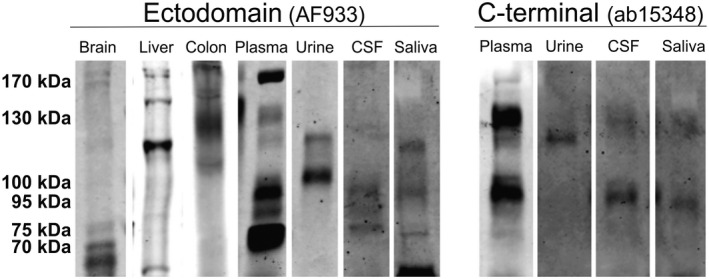
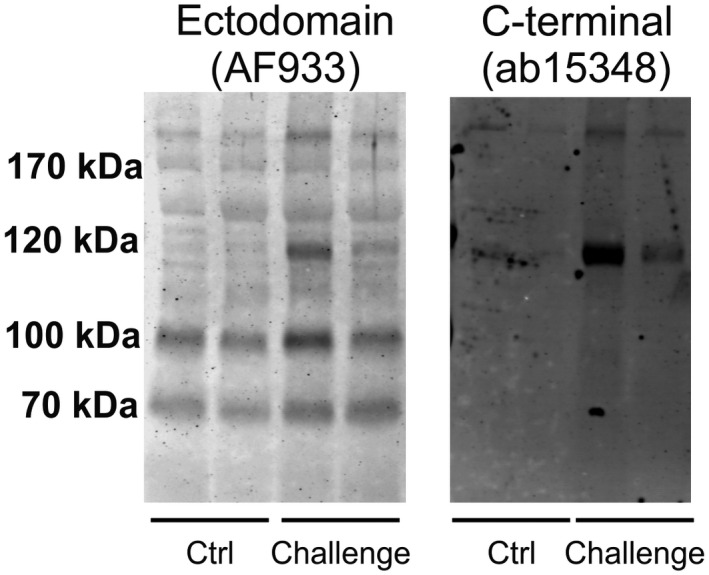
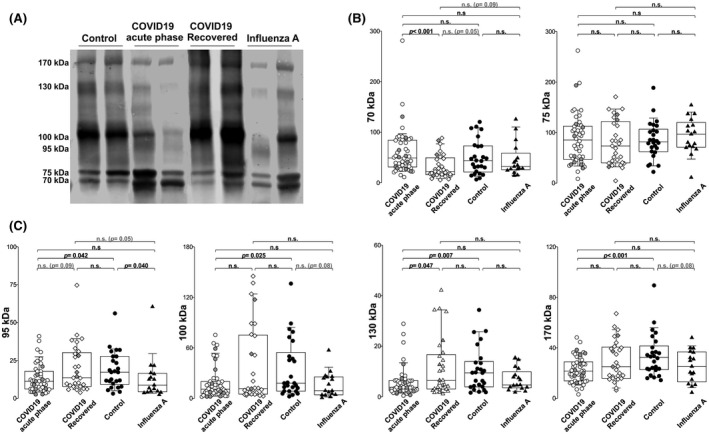
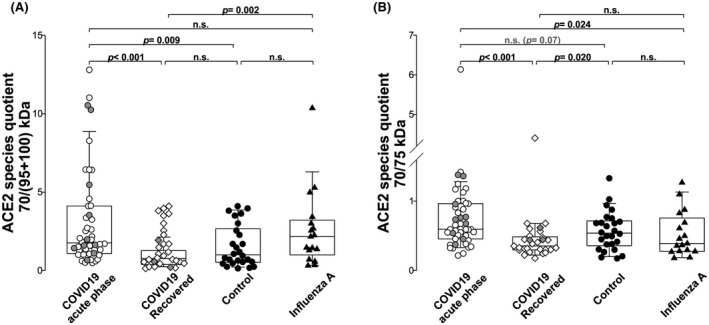
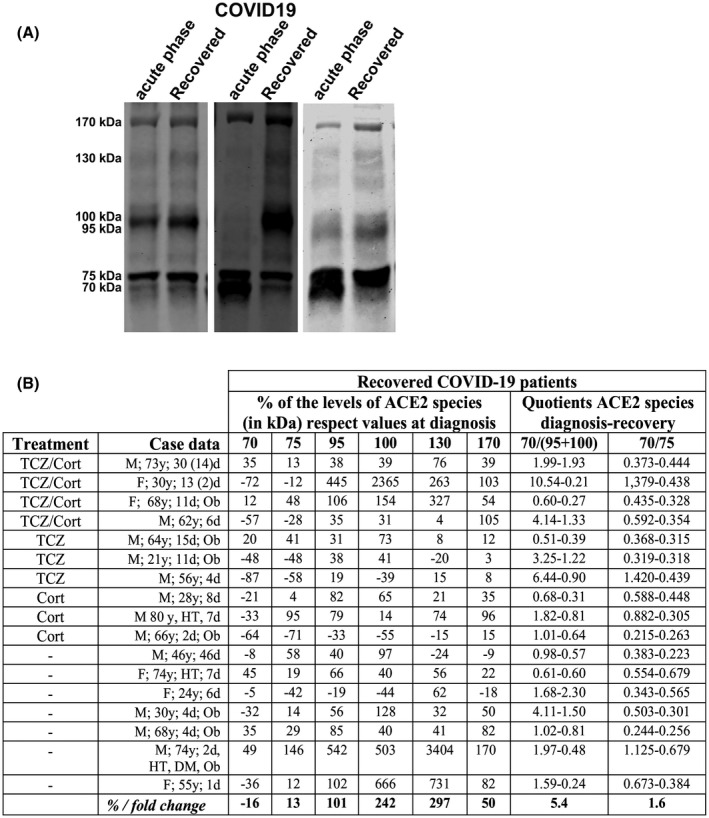
Studies are needed to identify useful biomarkers to assess the severity and prognosis of COVID-19 disease, caused by severe acute respiratory syndrome coronavirus (SARS-CoV-2) virus. Here, we examine the levels of various plasma species of the SARS-CoV-2 host receptor, the angiotensin-converting enzyme 2 (ACE2), in patients at different phases of the infection. Human plasma ACE2 species were characterized by immunoprecipitation and western blotting employing antibodies against the ectodomain and the C-terminal domain, using a recombinant human ACE2 protein as control. In addition, changes in the cleaved and full-length ACE2 species were also examined in serum samples derived from humanized K18-hACE2 mice challenged with a lethal dose of SARS-CoV-2. ACE2 immunoreactivity was present in human plasma as several molecular mass species that probably comprise truncated (70 and 75 kDa) and full-length forms (95, 100, 130, and 170 kDa). COVID-19 patients in the acute phase of infection (n = 46) had significantly decreased levels of ACE2 full-length species, while a truncated 70-kDa form was marginally higher compared with non-disease controls (n = 26). Levels of ACE2 full-length species were in the normal range in patients after a recovery period with an interval of 58-70 days (n = 29), while the 70-kDa species decreased. Levels of the truncated ACE2 species served to discriminate between individuals infected by SARS-CoV-2 and those infected with influenza A virus (n = 17). In conclusion, specific plasma ACE2 species are altered in patients with COVID-19 and these changes normalize during the recovery phase. Alterations in ACE2 species following SARS-CoV-2 infection warrant further investigation regarding their potential usefulness as biomarkers for the disease process and to asses efficacy during vaccination.

Keywords: ACE2; COVID-19; SARS-CoV-2; biomarker; plasma.


Conflict of interest statement

All the authors declare that they have no competing interest.

Figures

FIGURE 1
FIGURE 1
Different ACE2 species are present in human plasma. A, Schematic representation of ACE2 as a transmembrane type I protein and of the epitopes recognized by the antibodies used in this study (not drawn to scale). The carboxypeptidase and the transmembrane (TM) domains are represented. SARS‐CoV‐2 S‐protein binds to the carboxypeptidase domain. The sites of ACE2 shedding with ADAM17 are also indicated. The resulting cleaved ACE2 species retain carboxypeptidase activity and are recognized by the AF933 and ab108252 antibodies, but not by the ab15348 antibody. B, Plasma samples from non‐infected individuals were immunoblotted with the AF933 (ectodomain), the ab108252 (ectodomain), and the ab15348 (C‐terminus) ACE2 antibodies. The ab15348 only recognize the full‐length ACE2 which retains the C‐terminal domain. A recombinant human ACE2 protein, lacking the TM and C‐terminal domains (Gln18‐Ser740) was used as a control. (*) Unspecific ~50‐kDa band. C, Plasma samples were immunoprecipitated with the AF933 (ectodomain) antibody, and immunoprecipitated proteins (IP) were immunoblotted with either ab108252 (ectodomain) or ab15348 (C‐terminus) antibodies (Total: plasma sample prior immunoprecipitation). The same plasma samples were incubated, in parallel, with a non‐specific goat IgG which was used for the negative controls (IP control: IPc)
FIGURE 2
FIGURE 2
Different ACE2 species are present in human plasma, brain, liver, colon, urine, CSF, and saliva. Representative immunoblot with the ectodomain AF933 antibody of tissue extracts from brain (frontal cortex), liver, and colon. Urine, CSF, and saliva, together with plasma, were also immunoblotted with the AF933 and the ab15348 (C‐terminus) antibodies. Western blots for different antibodies were performed individually, to avoid re‐using blots. Samples were resolved in the same gels but are shown separately to optimize contrast for defining discrete bands. Colon was the tissue extract displaying highest immunoreactivity, followed by liver and then brain (equal protein was loaded in each lane), whereas plasma was the fluid with highest immunoreactivity, followed by urine, saliva and CSF which all displayed weaker immunoreactivities
FIGURE 3
FIGURE 3
Increased levels of ACE2 in plasma from the K18‐hACE2 mice. Transgenic humanized K18‐hACE2 mice, expressing human ACE2, were challenged with a lethal dose of SARS‐CoV‐2 (MAD6 strain) by the intranasal route. Plasma ACE2 was analyzed in the control non‐infected group and in SARS‐CoV‐2 challenged mice by western blotting with the ectodomain AF933 and the C‐terminus ab15348 antibodies, in samples collected 4 days after virus challenge (the mice died at 6‐day post‐challenge)
FIGURE 4
FIGURE 4
Levels of ACE2 species in plasma from individuals affected by COVID‐19 or influenza A and from healthy controls. A, Representative western blots of COVID‐19 at acute phase, at recovery (interval of 58‐70 days between hospital admission and recovery), healthy control and influenza A plasma resolved with the AF933 antibody. B, The densitometric quantification of the cleaved 70‐ and 75‐kDa species, (C) as well the full‐length 95‐, 100‐, 130‐, and 170‐kDa species are shown. Box and scatter plots of the levels of the indicated species of ACE2 are represented (COVID‐19 patients: open circles, n = 46; recover COVID‐19 patients: open triangles, n = 29 [patients that were categorized as severe COVID‐19 patients are represented in grey]; influenza A patients [open diamond; n = 17]; and controls [Ctrl; closed circles; n = 26]). The bars within the box plot represent the median abundance for the given group. P values are shown; n.s.: non‐significant, the non‐significant P < .1 are indicated
FIGURE 5
FIGURE 5
Ratios of ACE2 plasma species vary during COVID‐19. The relation between several species, for each sample (as determined in Figure 2), are represented by (A) the graph of the quotient obtained by dividing the level of immunoreactivity of the 70‐kDa band by the level of immunoreactivity of the 95‐ and 100‐kDa species (70/(95 + 100) kDa); and by (B) the graph of the quotient obtained by dividing the level of immunoreactivity of the 70‐kDa band by the level of immunoreactivity of the 75‐kDa species (70/75 kDa). As in Figure 2, data are presented in box and scatter plots for COVID‐19 patients at acute phase (open circles: moderate cases; grey circles: severe cases), recover COVID‐19 patients (open triangles: moderate cases; grey triangles: severe cases); influenza A patients (open diamond); and controls (Ctrl; closed circles). The bars within the box plot represent the median abundance for the given group. P values are shown; n.s.: non‐significant (the non‐significant P < .1 are indicated in grey)
FIGURE 6
FIGURE 6
Change in ACE2 plasma species in COVID‐19 patients after recovery. For 17 COVID‐19 affected subjects, plasma ACE2 species were measured at two time‐points, the first at acute phase and the second, after 58‐70 days, when patients had recovered (recovery). A, Representative ACE2 immunoblots for samples at acute phase and after recovery from the same subject. B, Some clinical and demographic data are indicated for each patient: Age (in year: y), gender (female [F]; male [M]), number of days requiring hospitalization (including ICU for severe cases): H (in days: d); antecedent of diabetes (DM), hypertension (HT), obesity (Ob). Treatment with glucocorticoids (Cort) or tocilizumab (TCZ) are also indicated. For more demographic, clinical data and laboratory parameters, see Table 1. The change for each species, in each patient, was calculated between the two time‐points and is represented as percentage of changes with respect to the baseline. The 70/(95 + 100)‐kDa and 70/75‐kDa quotients estimated at acute phase and at recovery are also represented. The last row shows the average of the percentages and the mean of the fold‐change in the ACE2 quotients between acute phase and recovery

References

    1. Li W, Moore MJ, Vasilieva N, et al. Angiotensin‐converting enzyme 2 is a functional receptor for the SARS coronavirus. Nature. 2003;426(6965):450‐454. - PMC - PubMed
    1. Zhou P, Yang X‐L, Wang X‐G, et al. A pneumonia outbreak associated with a new coronavirus of probable bat origin. Nature. 2020;579(7798):270‐273. - PMC - PubMed
    1. Hamming I, Timens W, Bulthuis M, et al. Tissue distribution of ACE2 protein, the functional receptor for SARS coronavirus. A first step in understanding SARS pathogenesis. J Pathol. 2004;203(2):631‐637. - PMC - PubMed
    1. Tipnis SR, Hooper NM, Hyde R, et al. A human homolog of angiotensin‐converting enzyme. Cloning and functional expression as a captopril‐insensitive carboxypeptidase. J Biol Chem. 2000;275(43):33238‐33243. - PubMed
    1. Amraei R, Rahimi N. COVID‐19, renin‐angiotensin system and endothelial dysfunction. Cells. 2020;9(7):1652. - PMC - PubMed

Publication types