. 2021 Jun 30;16(6):e0249430.
doi: 10.1371/journal.pone.0249430. eCollection 2021.

Light-induced changes in the suprachiasmatic nucleus transcriptome regulated by the ERK/MAPK pathway

Affiliations

Light-induced changes in the suprachiasmatic nucleus transcriptome regulated by the ERK/MAPK pathway

Diego Alzate-Correa et al. PLoS One. .

Abstract

The mammalian master circadian pacemaker within the suprachiasmatic nucleus (SCN) maintains tight entrainment to the 24 hr light/dark cycle via a sophisticated clock-gated rhythm in the responsiveness of the oscillator to light. A central event in this light entrainment process appears to be the rapid induction of gene expression via the ERK/MAPK pathway. Here, we used RNA array-based profiling in combination with pharmacological disruption methods to examine the contribution of ERK/MAPK signaling to light-evoked gene expression. Transient photic stimulation during the circadian night, but not during the circadian day, triggered marked changes in gene expression, with early-night light predominately leading to increased gene expression and late-night light predominately leading to gene downregulation. Functional analysis revealed that light-regulated genes are involved in a diversity of physiological processes, including DNA transcription, RNA translation, mRNA processing, synaptic plasticity and circadian timing. The disruption of MAPK signaling led to a marked reduction in light-evoked gene regulation during the early night (32/52 genes) and late night (190/191 genes); further, MAPK signaling was found to gate gene expression across the circadian cycle. Together, these experiments reveal potentially important insights into the transcriptional-based mechanisms by which the ERK/MAPK pathway regulates circadian clock timing and light-evoked clock entrainment.


Conflict of interest statement

The authors have declared that no competing interests exist.

Figures

Fig 1
Fig 1. Light-evoked activation of ERK in the SCN.
A. Schematic depiction of the experimental timeline used to 1) light-entrain and then transfer the mice to constant dark conditions, and 2) light pulse and sacrifice animals for immunohistochemical labeling. The timing of the light pulses was based on zeitgeber times prior to transfer to DD, and were designed to probe the light responsiveness of the SCN during the mid-day (ZT 4), early night (ZT 15) and late night (ZT 22). B-C. Representative SCN coronal sections from tissue collected at ZT 15 showing basal pERK levels (B) and pERK levels 20 minutes after the induction of a 10 minute, 100 lux, light pulse (C). Note the marked ERK activity specifically within the SCN. D-I. High magnification coronal images of pERK labeling within the central SCN at ZT 4 (D), ZT 15 (F) and ZT 22 (H), and pERK expression following photic stimulation at ZT 4 (E), ZT 15 (G) and ZT 22 (I). Note the light-evoked increase in pERK at ZT 15 (G) and ZT 22 (I), and the absence of marked induction at ZT 4 (E). J-O. SCN sagittal sections showing basal pERK levels at ZT 4 (J), ZT 15 (L) and ZT 22 (N), and light-induced levels at ZT 4 (K), ZT 15 (M) and ZT 22 (O). A similar pattern of pERK induction was observed at ZT 15 and ZT 22, whereas no increase is observed at ZT 4. Scale bar: 200 μm. OC: Optic chiasm; 3V: third ventricle.
Fig 2
Fig 2. U0126-mediated suppression of MAPK signaling.
A. Schematic depiction of the timeline used to 1) entrain and dark-adapt mice and 2) implant guide cannulae and 3) infuse, light pulse and sacrifice animals. B. Representative Nissl-stained coronal brain section showing the location of the cannula placement in the lateral ventricle. The arrow denotes the location of the scar left in the cortex by the guide cannula. C. Coronal brain section from an animal infused with U0126 that was immunolabeled for pERK; note the marked reduction in pERK expression within the periventricular region (denoted by the dashed line), which includes the SCN. (D-I) Representative coronal images showing pERK levels in the SCN after vehicle infusion and a light pulse (100 lux, 10 min) at each circadian time: ZT 4 (D), ZT 15 (F) and ZT 22 (H); and after infusion of U0126: ZT 4 (E), ZT 15 (G) and ZT 22 (I). (J-O) The effects of U0126 infusion are also presented using sagittal SCN sections for the three circadian time points: ZT 4 (J:K), ZT 15 (L:M) and ZT 22 (N:O). Scale bars: 1.5 mm for (B); 500 μm for (C); 200 μm for (D-O).
Fig 3
Fig 3. Bioinformatic analysis of light-evoked transcripts in the SCN.
A. Volcano plot depicting light-induced changes in gene expression at three circadian time points: ZT 4 (left), ZT 15 (middle) and ZT 22 (right). Filtering criteria of absolute fold-change (FC) ≥ 1.3 and adjusted P-value (Pval) ≤ 0.1 (represented as -Log10PVal) are illustrated by dotted vertical and horizontal lines respectively. Included are the names of the top 10 transcripts showing statistically significant changes. With the noted filtering criteria we did not detect significant light-evoked changes in gene expression at ZT 4. B-C. Heat map clustering generated from the microarray data analysis (triplicate determinations for each condition) describing light-induced changes in gene expression at ZT 15 (B), and ZT 22 (C). The different transcript classes are color coded, and bracketing to the left denotes hierarchical gene expression clustering. Volcano plots and heatmaps were generated in R Version 3.1.0 URL https://www.R-project.org/ [53].
Fig 4
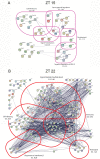
Fig 4. Functional enrichment clusters for transcripts induced by light.
Ontological category clusters represented by the list of genes showing a statistically significant change after a light treatment at ZT 15 (A) and ZT 22 (B). Cluster and enrichment scores (E.S.) are generated using DAVID and are visualized using the STRING database visualization tool. Plots were generated in STRING database Version 11.0 URL https://string-db.org/ [51].
Fig 5
Fig 5. Bioinformatic-based analysis of MAPK-regulated transcripts in the SCN.
A. Volcano plots depicting changes in gene expression induced by U0126 at mid-day (left), early night (middle) and late night (right). A fold-change (FC) ≥ 1.3 and adjusted P-value (Pval) ≤ 0.1 (represented as -Log10PVal) are illustrated by dotted vertical and horizontal lines respectively. Included are the names of the top 10 transcripts showing statistically significant changes. B-D. Heat map clustering (triplicate determinations for each condition) depicts U0126-mediated changes in gene expression at ZT 4 (B), ZT 15 (C) and ZT 22 (D). The different transcript classes are color coded and bracketing to the left denotes hierarchical gene expression clustering. Volcano plots and heatmaps were generated in R Version 3.1.0 URL https://www.R-project.org/ [53].
Fig 6
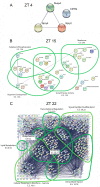
Fig 6. Functional enrichment clusters for transcripts regulated by MAPK signaling in the SCN.
Ontological category clusters of the genes showing a statistically significant change after a light treatment at mid-day (A) early night (B) and late night (C). Cluster and enrichment scores (E.S.) are generated using DAVID and are visualized using the STRING database visualization tool. Plots were generated in STRING database Version 11.0 URL https://string-db.org/ [51].

References

    1. Hastings MH, Maywood ES, Brancaccio M. Generation of circadian rhythms in the suprachiasmatic nucleus. Nat Rev Neurosci. 2018. Jun;19:453–469. doi: 10.1038/s41583-018-0026-z - DOI - PubMed
    1. Mohawk JA, Green CB, Takahashi JS. Central and peripheral circadian clocks in mammals. Annu Rev Neurosci. 2012. Jul;35:445–462. doi: 10.1146/annurev-neuro-060909-153128 - DOI - PMC - PubMed
    1. Zhang R, Lahens NF, Ballance HI, Hughes ME, Hogenesch JB. A circadian gene expression atlas in mammals: implications for biology and medicine. Proc Natl Acad Sci U S A. 2014. Oct;111:16219–16224. doi: 10.1073/pnas.1408886111 - DOI - PMC - PubMed
    1. Koike N, Yoo SH, Huang HC, Kumar V, Lee C, Kim TK, et al. Transcriptional architecture and chromatin landscape of the core circadian clock in mammals. Science. 2012. Aug;338:349–354. doi: 10.1126/science.1226339 - DOI - PMC - PubMed
    1. Takahashi JS. Transcriptional architecture of the mammalian circadian clock. Nat Rev Genet. 2017. Dec;18:164–179. doi: 10.1038/nrg.2016.150 - DOI - PMC - PubMed

Publication types

Substances