

Early social distancing policies in Europe, changes in mobility & COVID-19 case trajectories: Insights from Spring 2020
- PMID: 34191818
- PMCID: PMC8244916
- DOI: 10.1371/journal.pone.0253071
Early social distancing policies in Europe, changes in mobility & COVID-19 case trajectories: Insights from Spring 2020
Abstract
Background: Social distancing have been widely used to mitigate community spread of SARS-CoV-2. We sought to quantify the impact of COVID-19 social distancing policies across 27 European counties in spring 2020 on population mobility and the subsequent trajectory of disease.
Methods: We obtained data on national social distancing policies from the Oxford COVID-19 Government Response Tracker and aggregated and anonymized mobility data from Google. We used a pre-post comparison and two linear mixed-effects models to first assess the relationship between implementation of national policies and observed changes in mobility, and then to assess the relationship between changes in mobility and rates of COVID-19 infections in subsequent weeks.
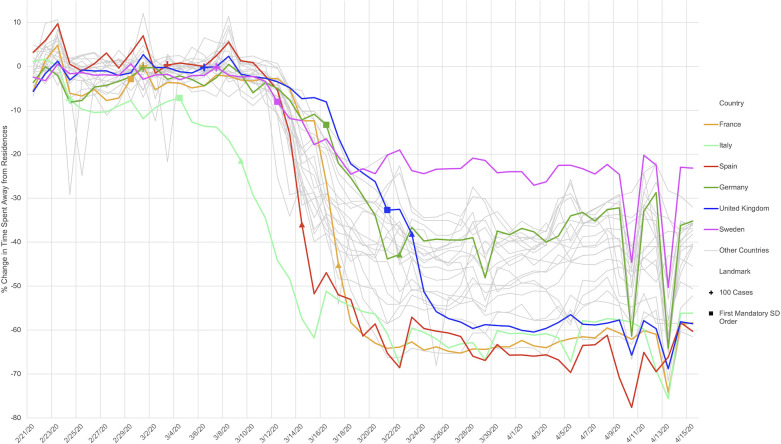
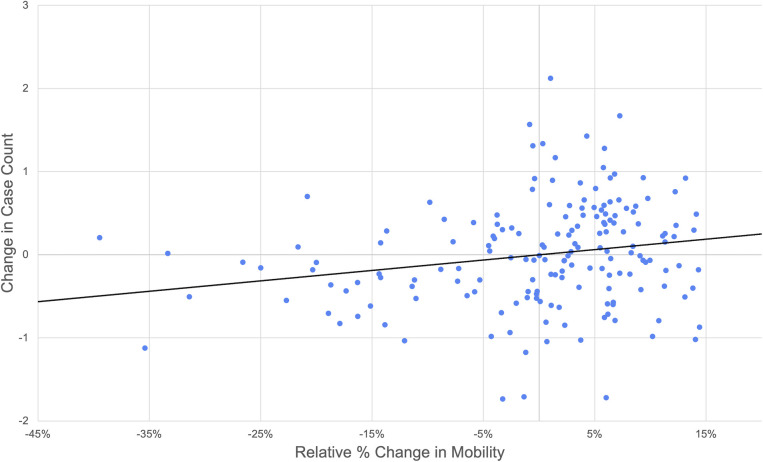
Results: Compared to a pre-COVID baseline, Spain saw the largest decrease in aggregate population mobility (~70%), as measured by the time spent away from residence, while Sweden saw the smallest decrease (~20%). The largest declines in mobility were associated with mandatory stay-at-home orders, followed by mandatory workplace closures, school closures, and non-mandatory workplace closures. While mandatory shelter-in-place orders were associated with 16.7% less mobility (95% CI: -23.7% to -9.7%), non-mandatory orders were only associated with an 8.4% decrease (95% CI: -14.9% to -1.8%). Large-gathering bans were associated with the smallest change in mobility compared with other policy types. Changes in mobility were in turn associated with changes in COVID-19 case growth. For example, a 10% decrease in time spent away from places of residence was associated with 11.8% (95% CI: 3.8%, 19.1%) fewer new COVID-19 cases.
Discussion: This comprehensive evaluation across Europe suggests that mandatory stay-at-home orders and workplace closures had the largest impacts on population mobility and subsequent COVID-19 cases at the onset of the pandemic. With a better understanding of policies' relative performance, countries can more effectively invest in, and target, early nonpharmacological interventions.
Conflict of interest statement
The above stated commercial affiliations did not alter adherence to PLOS ONE policies on sharing data and materials.
Figures

Similar articles
-
Impacts of social distancing policies on mobility and COVID-19 case growth in the US.Nat Commun. 2021 May 25;12(1):3118. doi: 10.1038/s41467-021-23404-5. Nat Commun. 2021. PMID: 34035295 Free PMC article.
-
Asynchrony Between Individual and Government Actions Accounts for Disproportionate Impact of COVID-19 on Vulnerable Communities.Am J Prev Med. 2021 Mar;60(3):318-326. doi: 10.1016/j.amepre.2020.10.012. Epub 2020 Nov 13. Am J Prev Med. 2021. PMID: 33309450 Free PMC article.
-
The Immediate Effect of COVID-19 Policies on Social-Distancing Behavior in the United States.Public Health Rep. 2021 Mar-Apr;136(2):245-252. doi: 10.1177/0033354920976575. Epub 2021 Jan 5. Public Health Rep. 2021. PMID: 33400622 Free PMC article.
-
Social distancing policies in 22 African countries during the COVID-19 pandemic: a desk review.Pan Afr Med J. 2020 Dec 14;37(Suppl 1):46. doi: 10.11604/pamj.supp.2020.37.46.27026. eCollection 2020. Pan Afr Med J. 2020. PMID: 33552374 Free PMC article. Review.
-
Effect of national and local lockdowns on the control of COVID-19 pandemic: a rapid review.Epidemiol Prev. 2020 Sep-Dec;44(5-6 Suppl 2):60-68. doi: 10.19191/EP20.5-6.S2.104. Epidemiol Prev. 2020. PMID: 33412795 Review. English.
Cited by
-
Dynamic interactions of COVID-19 incidences, mobility, and social distancing policies in seoul: A VAR model approach.Sci Rep. 2025 Jul 7;15(1):24288. doi: 10.1038/s41598-025-05583-z. Sci Rep. 2025. PMID: 40624117 Free PMC article.
-
Phase-wise evaluation and optimization of non-pharmaceutical interventions to contain the COVID-19 pandemic in the U.S.Front Public Health. 2023 Aug 3;11:1198973. doi: 10.3389/fpubh.2023.1198973. eCollection 2023. Front Public Health. 2023. PMID: 37601210 Free PMC article.
-
Effectiveness of social distancing measures and lockdowns for reducing transmission of COVID-19 in non-healthcare, community-based settings.Philos Trans A Math Phys Eng Sci. 2023 Oct 9;381(2257):20230132. doi: 10.1098/rsta.2023.0132. Epub 2023 Aug 23. Philos Trans A Math Phys Eng Sci. 2023. PMID: 37611629 Free PMC article.
-
A Questionnaire-Based Survey on the Impact of the COVID-19 Pandemic on Gastrointestinal Endoscopy in Asia.Digestion. 2022;103(1):7-21. doi: 10.1159/000520287. Epub 2021 Nov 10. Digestion. 2022. PMID: 34758472 Free PMC article.
-
Assessing self-selection biases in Facebook-recruited online surveys: Evidence from the COVID-19 Health Behavior Survey.PLoS One. 2025 Jul 8;20(7):e0326884. doi: 10.1371/journal.pone.0326884. eCollection 2025. PLoS One. 2025. PMID: 40627620 Free PMC article.
References
-
- Thunström L, Newbold SC, Finnoff D, Ashworth M, Shogren JF. The Benefits and Costs of Using Social Distancing to Flatten the Curve for COVID-19. J Benefit Cost Anal. 2020:1–17. doi: 10.1017/bca.2020.12 PMC7242774. - DOI
Publication types
MeSH terms
LinkOut - more resources
Full Text Sources
Medical
Miscellaneous
