. 2021 Jul 12;56(13):1945-1960.e7.
doi: 10.1016/j.devcel.2021.06.004. Epub 2021 Jun 29.

The Polycomb group protein MEDEA controls cell proliferation and embryonic patterning in Arabidopsis

Affiliations

The Polycomb group protein MEDEA controls cell proliferation and embryonic patterning in Arabidopsis

Sara Simonini et al. Dev Cell. .

Abstract

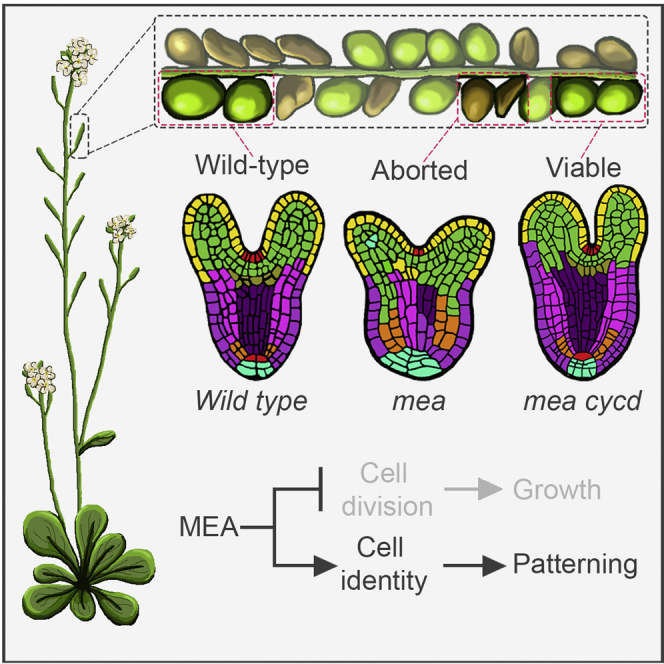
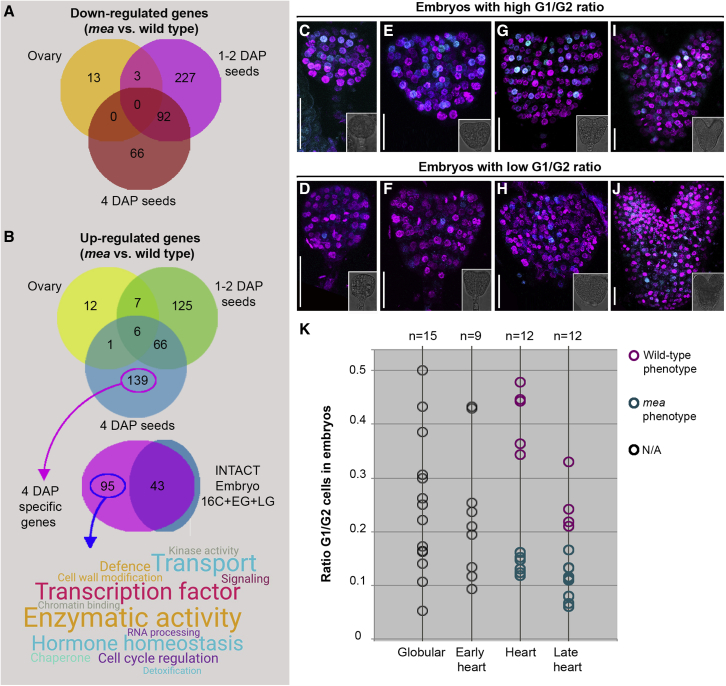
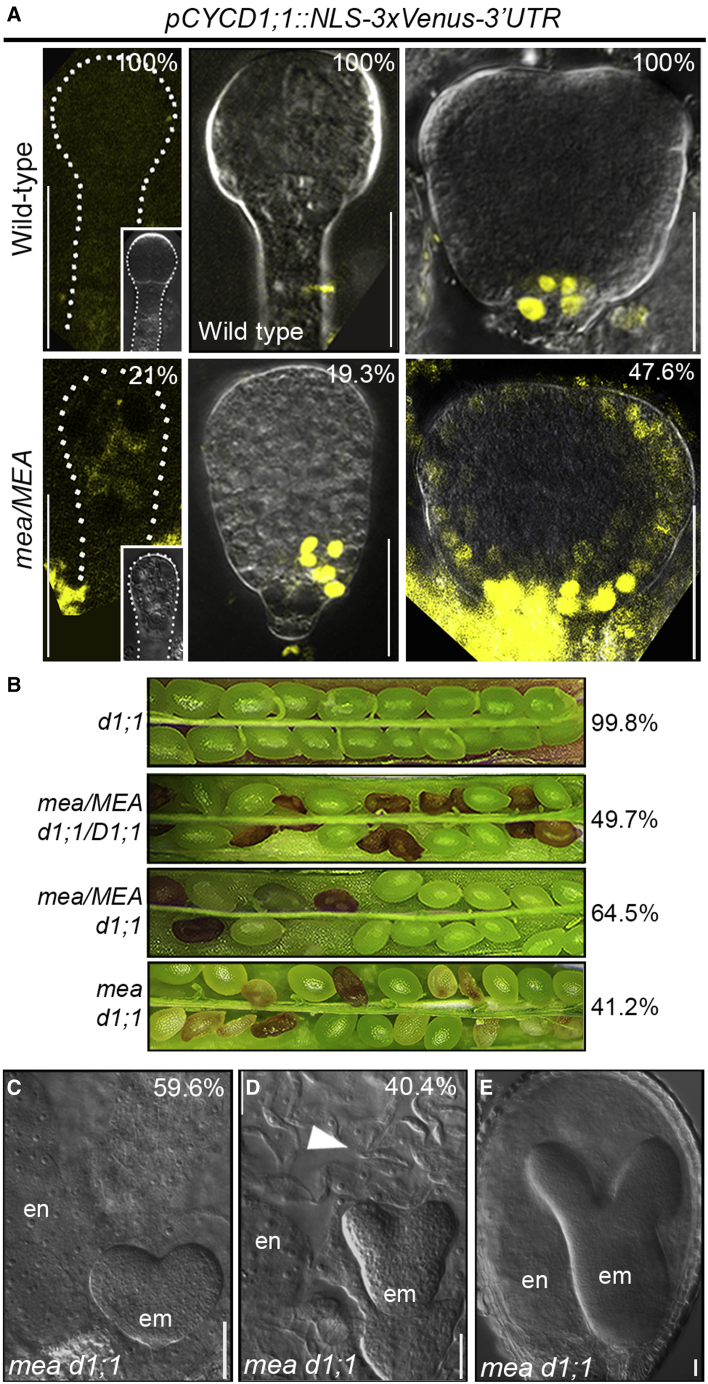
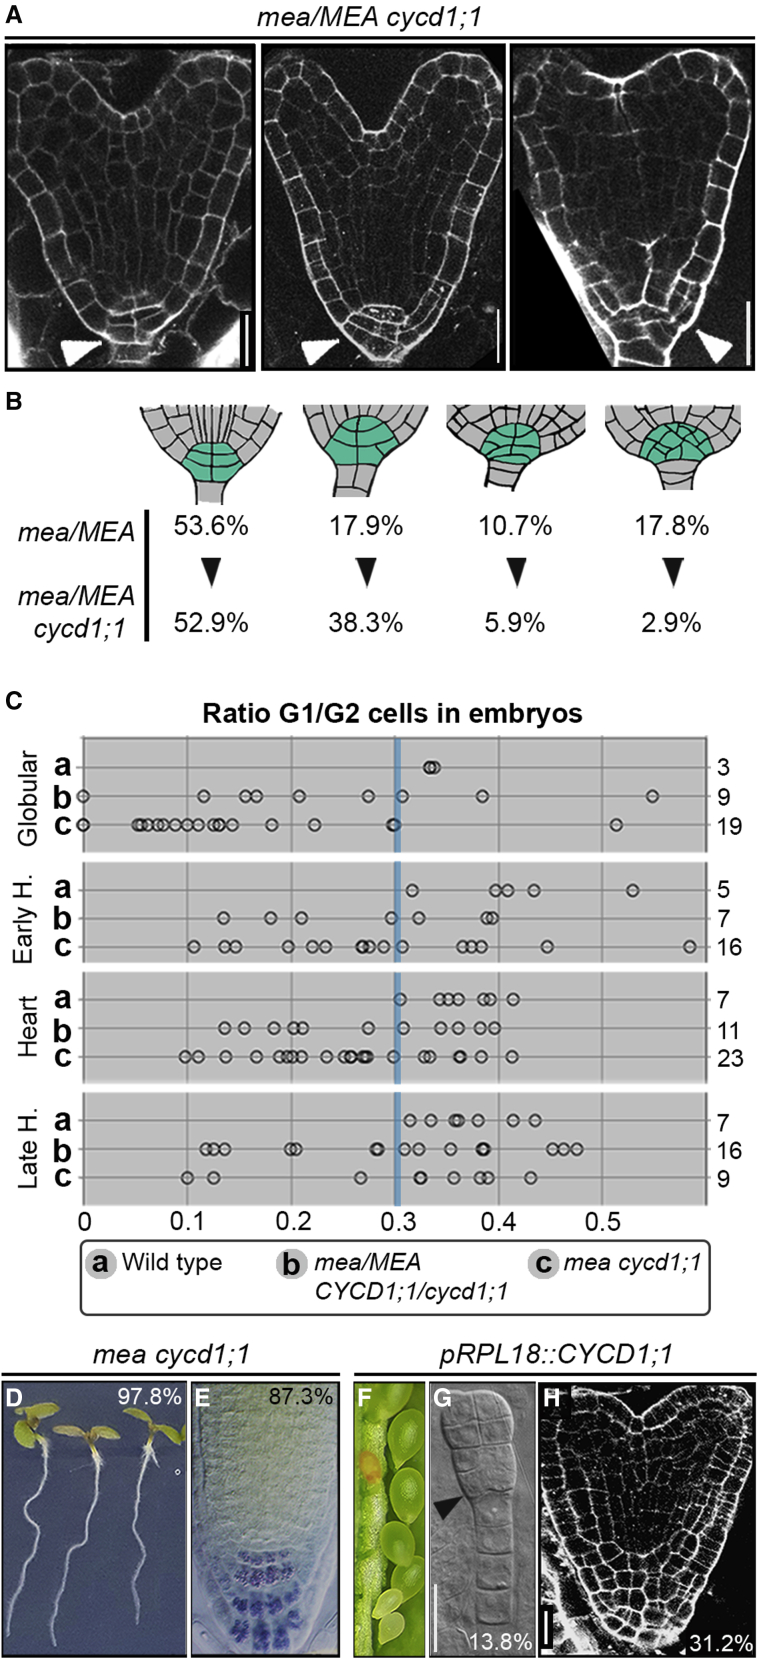
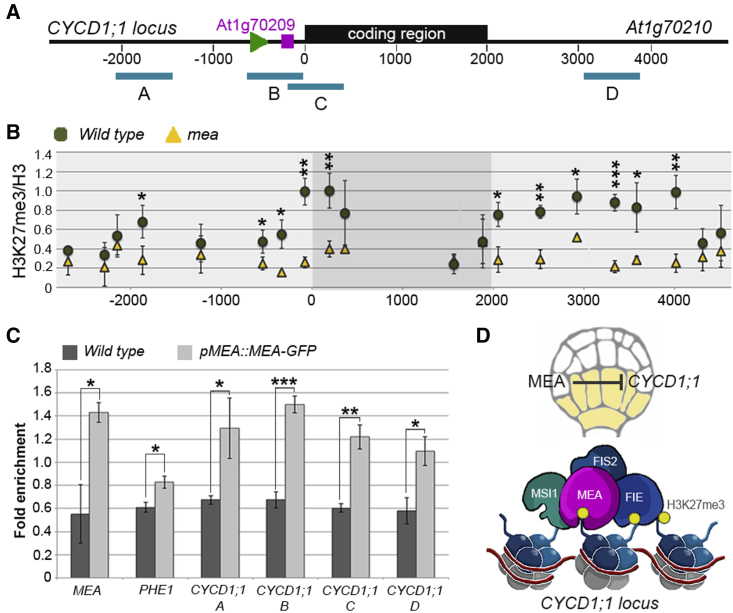
Establishing the embryonic body plan of multicellular organisms relies on precisely orchestrated cell divisions coupled with pattern formation, which, in animals, are regulated by Polycomb group (PcG) proteins. The conserved Polycomb Repressive Complex 2 (PRC2) mediates H3K27 trimethylation and comes in different flavors in Arabidopsis. The PRC2 catalytic subunit MEDEA is required for seed development; however, a role for PRC2 in embryonic patterning has been dismissed. Here, we demonstrate that embryos derived from medea eggs abort because MEDEA is required for patterning and cell lineage determination in the early embryo. Similar to PcG proteins in mammals, MEDEA regulates embryonic patterning and growth by controlling cell-cycle progression through repression of CYCD1;1, which encodes a core cell-cycle component. Thus, Arabidopsis embryogenesis is epigenetically regulated by PcG proteins, revealing that the PRC2-dependent modulation of cell-cycle progression was independently recruited to control embryonic cell proliferation and patterning in animals and plants.

Keywords: Arabidopsis; H3K27me3; MEDEA; PRC2; Polycomb group; cell proliferation; cyclin; embryonic patterning; evolutionary conservation; plant development.


Conflict of interest statement

Declaration of interests The authors declare no conflicts of interest.

Figures

None
Graphical abstract
Figure 1
Figure 1
Genetically uncoupling embryo and endosperm development reveals the requirement of MEA for embryogenesis (A) Schematic representation of the strategy adopted to generate seeds with embryo and endosperm having discordant genotypes. EC, egg cell; CC, central cell. (B) Set of crosses performed, with opened siliques showing developing seeds. Asterisks indicate developing seeds among aborting ones. (C–F) Fluorescent microscopy images of seeds derived from the double pollination experiment: no rescue (C), complete rescue (D), endosperm only rescue (E), and embryo only rescue (F). (G–L) Clearing of seeds of the WT × kpl+GFP × WT cross (G) and the five phenotypic classes (H–L) observed in mea × kpl+GFP × MEA−rescue+RFP crosses: mea-like (H), endosperm only (I), MEA-rescued (J), WT-looking embryo and mea endosperm (K), and abnormal embryo and WT-looking endosperm (J). Top right corner: percentage of seeds showing the phenotype. em, embryo; en, endosperm. Scale bar, 50 μm
Figure 2
Figure 2
mea embryos develop severe morphological defects (A and B) mPS-PI staining of mea/MEA seeds showing WT (A) and aberrant (B) morphology at the globular (left image) and late heart stage (right image). (C) Schematic representation of embryos in mea/MEA plants with wild-type (top row) or mea (bottom row) phenotypes obtained using mPS-PI images as template. Late globular, heart, and the basal part of late heart stage embryos are shown from left to right. The columella/QC region is highlighted in turquoise. (D and E) WT (E) and mea homozygous (F) seedlings grown on vertical plates. (F and G) Magnification of epidermal cells of the primary root of WT (F) and mea homozygous (G) seedlings grown vertically. (H and I) Lugol staining of the primary root tip of WT (H) and mea homozygous (I) seedlings. Scale bars, 25 μm (A and B, left panels; H–J), 50 μm (A and B, right panels), 250 μm (F and G).
Figure 3
Figure 3
Embryonic patterning is affected in mea embryos (A) Schematic representation of the analyzed embryonic domains. (B) Percentage of embryos showing an altered expression pattern of the corresponding marker line in mea/MEA seeds. (C–P) Confocal images showing the expression patterns in WT embryos (upper row) and mea-like embryos (lower row) at late heart stage for DR5V2 (C and D), pPLT1::PLT1-YFP (E and F), pTMO5::3xGFP (G and H), pSCR::SCR-GFP (I and J), pWOX5-dsRED (K and L), pCLV3::GFP (M and N), and pWUS::dsRED (O and P). Scale bar, 20 μm
Figure 4
Figure 4
mea embryos display an accelerated cell cycle (A) Venn diagram depicting the sets of downregulated genes in transcriptomic analyses of mea homozygous versus WT ovaries/developing seeds. (B) Schematic representation of upregulated genes in transcriptomic datasets of mea homozygous versus WT ovaries/developing seeds, with Venn diagram (top) and word cloud of terms (bottom) for molecular function of 4DAP-specific genes. 16C, 16-cell embryos; EG, early globular embryos; LG, late globular embryos. (C–J) Confocal microscopy images of embryos of mea/MEA seeds expressing the PlaCCI triple cell-cycle marker line. Images show CTD1-CFP (G1) and H3.1-RFP (S+early G2) signals; the M-phase marker is not included. Inlets in bottom left corners: brightfield images of the embryos analyzed. (K) Quantification of the G1/G2 ratio in embryos of mea/MEA seeds. Pink circles are WT-looking embryos, turquoise circles are mea-like embryos; gray circles are embryos for which a phenotypic distinction was not possible. Scale bar, 20 μm
Figure 5
Figure 5
Ectopic expression of CYCD1;1 is largely responsible for the morphological defects of mea embryos (A) Confocal microscopy images of embryos of mea/MEA plants showing expression of pCYCD1;1::NLS-3xVenus-3’UTR in WT (top) and mea/MEA (bottom) embryos at the 4–8-cell (left), globular (middle), and early heart (right) stage. Inlet in bottom right corners: brightfield images of the embryos analyzed. (B) Opened siliques (from top to bottom): cycd1;1, mea/MEA cycd1;1/CYCD1;1, mea/MEA cycd1;1, and mea cycd1;1 plants with percentage of viable seeds indicated on the right. (C–E) DIC microscopy images of seeds from mea cycd1;1 plants showing a mea-like seed (C), a seed with a WT-looking embryo surrounded by mea-looking endosperm (D), and a seed with a giant embryo (E). Arrowhead indicates uncellularized endosperm. Scale bar, 20μm
Figure 6
Figure 6
MEA patterns the embryo through regulation of a core cell-cycle component (A) mPS-PI staining of seeds of a mea/MEA cycd1;1 double mutant plant showing WT-looking embryos (left), embryos with few extra divisions in the columella/QC area (middle), and mea-like embryos (right). (B) Schematic representation of cell number and organization in the columella/QC region in mea/MEA cycd1;1 embryos compared with mea/MEA. The number of embryos showing a given range of cells is represented as a percentage. (C) Quantification of the G1/G2 ratio in embryos of WT (A), mea/MEA cycd1;1/CYCD1;1 (B), and mea cycd1;1 (C) plants. Values for WT and WT-looking embryos are higher than 0.3 (blue vertical bar). Numbers on the right side refer to the number of embryos imaged. (D and E) Gravitropic response of vertically grown mea cycd1;1 seedlings (D) and Lugol staining of the primary root tip (E). (F–H) Phenotype of pRPL18-CYCD1;1 plants showing seed abortion (F), early globular embryo with ectopic cell proliferation at the base (G), and mPS-PI staining of an embryo with excessive and disorganized cell divisions in the columella/QC area. Scale bar, 20μm
Figure 7
Figure 7
CYCD1;1 is a direct target of MEA in the embryo (A) Schematic representation of the CYCD1;1 (AT1G70210) locus depicting the coding region (black rectangular box), the position of the CYCD1;1 transcriptional start site (green arrowhead, position −459), the position of the short AT1G70209 gene (purple bar, coordinates form −218 to −362), and the regions (A–D) tested in (C). (B) CUT&RUN analysis of H3K27me3 over H3 occupancy at the CYCD1;1 locus in WT versus mea embryos. CUT&RUN was performed in biological triplicate for each genotype. Error bars: standard deviation. p value of a t test:  < 0.05, ∗∗ < 0.01, ∗∗∗ < 0.001. (C) Chromatin immunoprecipitation (ChIP) of pMEA::MEA-GFP versus the WT demonstrating direct binding of MEA at the CYCD1;1 locus (regions A–D). MEA and PHE1 are positive controls. Error bars: standard deviation. ChIP was performed in biological triplicate for each genotype. p value of a t test:  < 0.01, ∗∗ < 0.001, ∗∗∗ < 0.0001. (D) Graphical representation of the mechanism underlying CYCD1;1 regulation in the embryo: direct binding of MEA to the CYCD1;1 locus at early embryonic stages allows deposition of the repressive H3K27me3 mark, mediating CYCD1;1 repression and allowing cell proliferation and embryonic patterning to proceed normally.

References

    1. Adhikari A., Davie J.K. The PRC2 complex directly regulates the cell cycle and controls proliferation in skeletal muscle. Cell Cycle. 2020;19:2373–2394. - PMC - PubMed
    1. Barlow D.P., Bartolomei M.S. Genomic imprinting in mammals. Cold Spring Harb. Perspect. Biol. 2014;6 - PMC - PubMed
    1. Baroux C., Gagliardini V., Page D.R., Grossniklaus U. Dynamic regulatory interactions of Polycomb group genes: MEDEA autoregulation is required for imprinted gene expression in Arabidopsis. Genes Dev. 2006;20:1081–1086. - PMC - PubMed
    1. Batista R.A., Moreno-Romero J., Qiu Y., van Boven J., Santos-González J., Figueiredo D.D., Köhler C. The MADS-box transcription factor PHERES1 controls imprinting in the endosperm by binding to domesticated transposons. eLife. 2019;8 - PMC - PubMed
    1. Bencivenga S., Serrano-Mislata A., Bush M., Fox S., Sablowski R. Control of oriented tissue growth through repression of organ boundary genes promotes stem morphogenesis. Dev. Cell. 2016;39:198–208. - PMC - PubMed

Publication types

MeSH terms