Clinical Trial
. 2021 Jun 29;35(13):109301.
doi: 10.1016/j.celrep.2021.109301.

A critical role of hepatic GABA in the metabolic dysfunction and hyperphagia of obesity

Affiliations
Clinical Trial

A critical role of hepatic GABA in the metabolic dysfunction and hyperphagia of obesity

Caroline E Geisler et al. Cell Rep. .

Abstract

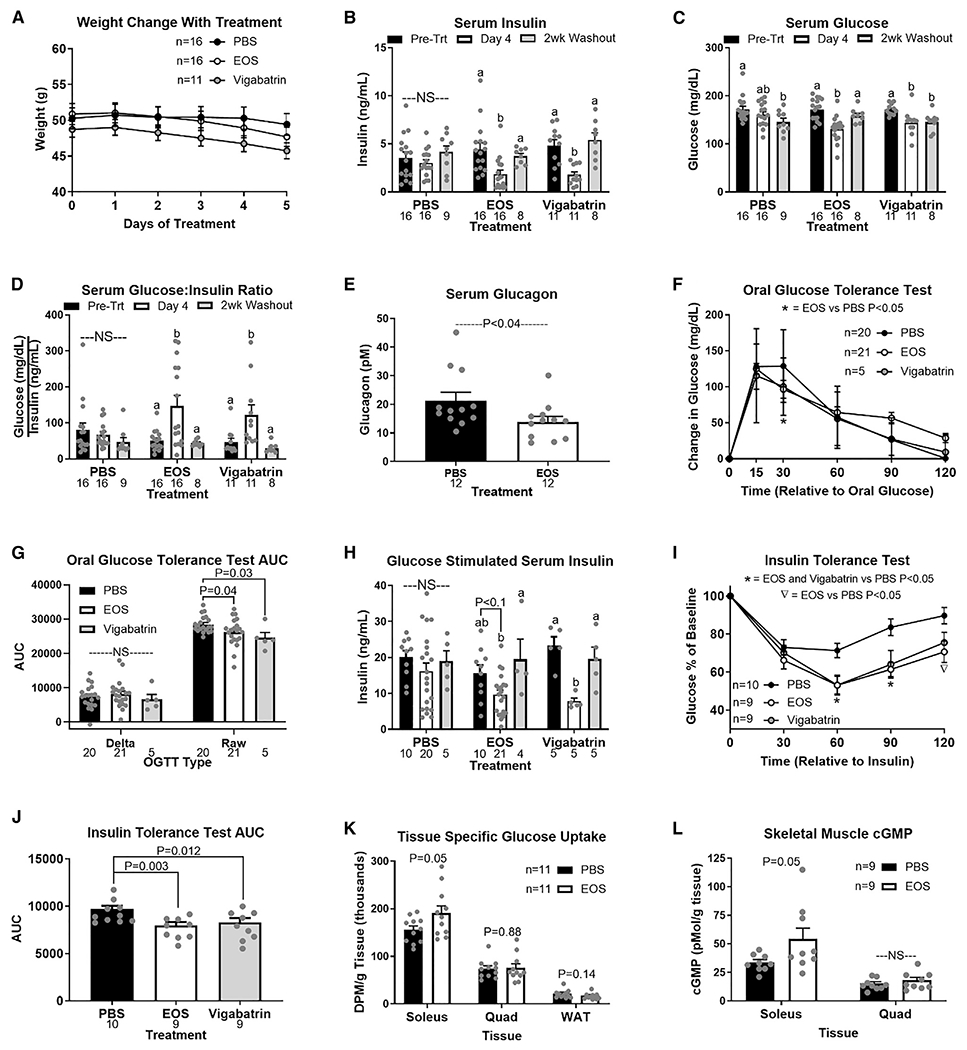
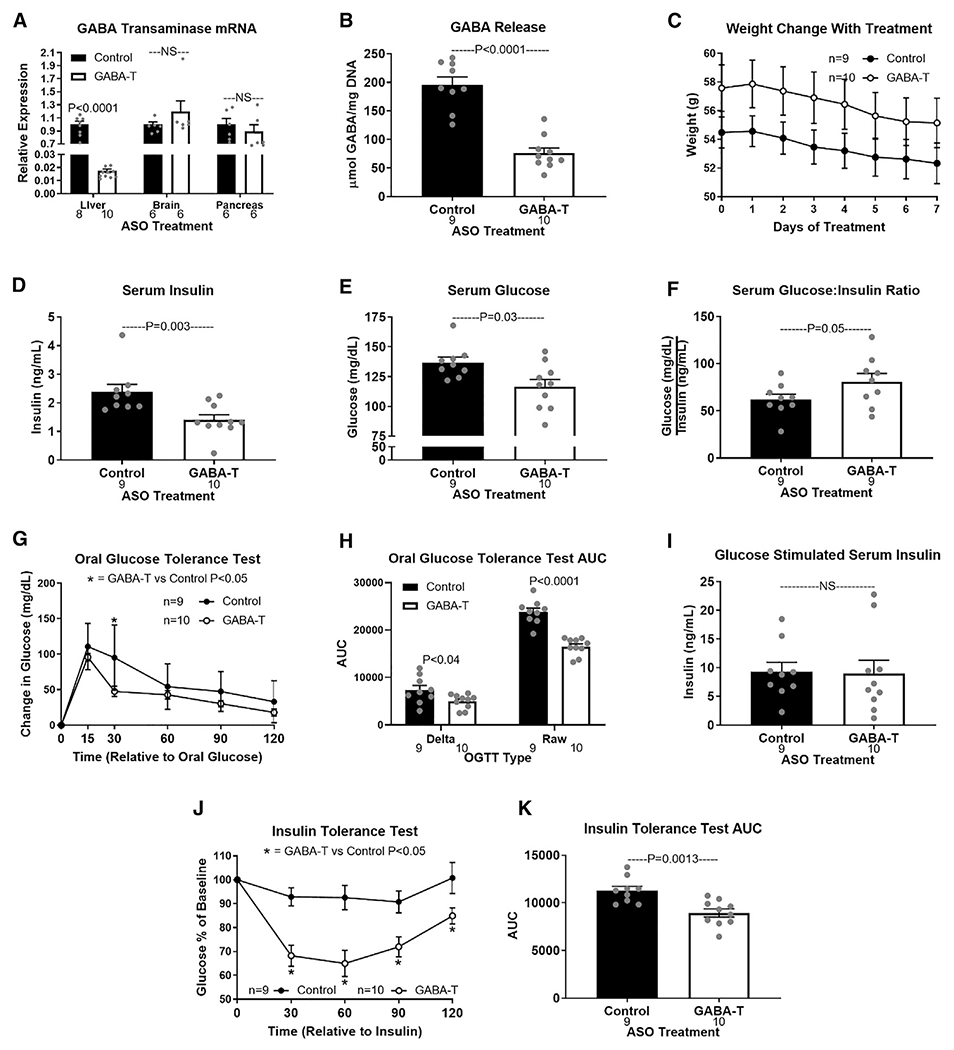
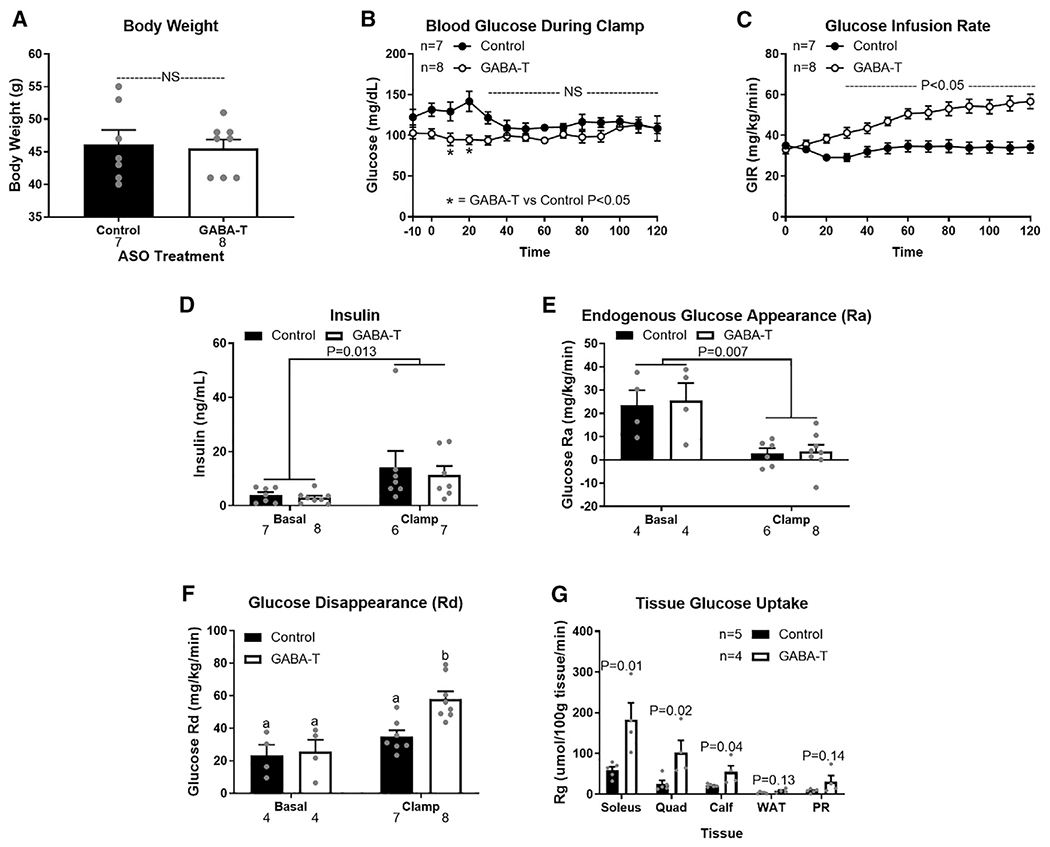
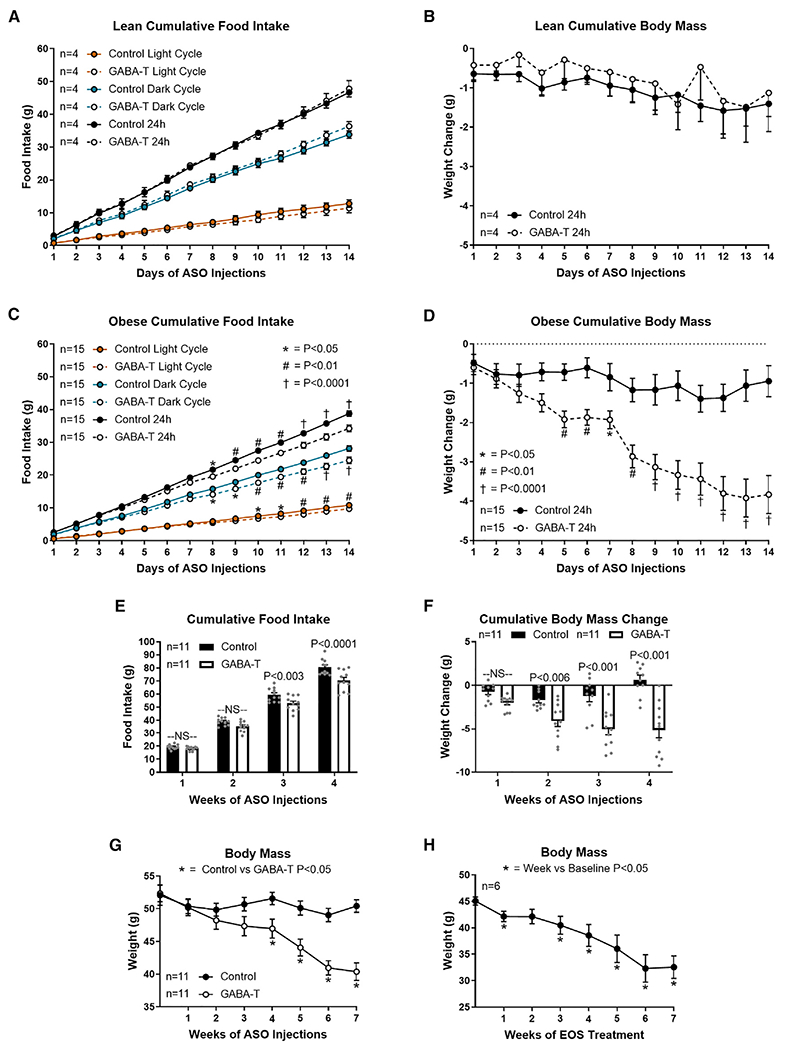
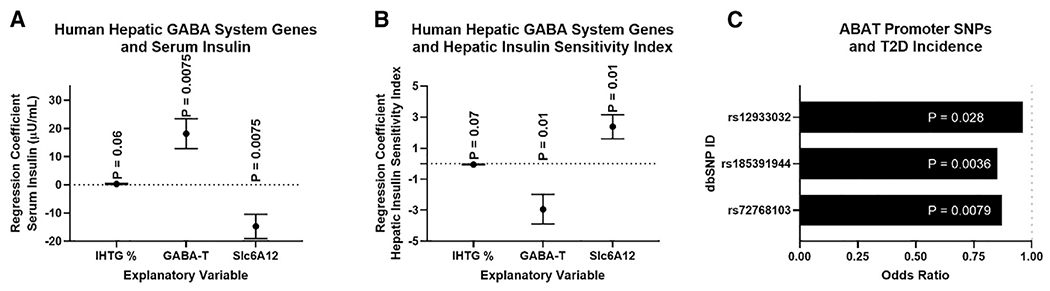
Hepatic lipid accumulation is a hallmark of type II diabetes (T2D) associated with hyperinsulinemia, insulin resistance, and hyperphagia. Hepatic synthesis of GABA, catalyzed by GABA-transaminase (GABA-T), is upregulated in obese mice. To assess the role of hepatic GABA production in obesity-induced metabolic and energy dysregulation, we treated mice with two pharmacologic GABA-T inhibitors and knocked down hepatic GABA-T expression using an antisense oligonucleotide. Hepatic GABA-T inhibition and knockdown decreased basal hyperinsulinemia and hyperglycemia and improved glucose intolerance. GABA-T knockdown improved insulin sensitivity assessed by hyperinsulinemic-euglycemic clamps in obese mice. Hepatic GABA-T knockdown also decreased food intake and induced weight loss without altering energy expenditure in obese mice. Data from people with obesity support the notion that hepatic GABA production and transport are associated with serum insulin, homeostatic model assessment for insulin resistance (HOMA-IR), T2D, and BMI. These results support a key role for hepatocyte GABA production in the dysfunctional glucoregulation and feeding behavior associated with obesity.

Keywords: GABA; GABA shunt; GABA transaminase; NAFLD; NASH; Type 2 diabetes mellitus; hyperinsulinemia; insulin resistance; obesity.


Conflict of interest statement

Declaration of interests The results presented in this paper have resulted in patent cooperation treaty application no. 62/511,753 and 62/647,468: METHODS AND COMPOSITIONS FOR REGULATING GLUCOSE HOMEOSTASIS, which has been licensed by Livendocrine, LLC, founded by B.J.R.

Figures

Figure 1.
Figure 1.. GABA-transaminase inhibition improves glucose homeostasis in obesity
HFD-induced obese mice were treated with GABA-transaminase inhibitors ethanolamine-O-sulfate (EOS) or vigabatrin (8 mg/day) or phosphate-buffered saline (PBS) (control) for 5 days. (A and B) Bars that do not share a common letter differ significantly within injection treatment (p < 0.05; number below bar denotes n per group) (A) Body weight during treatment. (B–D) Basal serum insulin (B), glucose (C), and glucose:insulin ratio (D) pre-treatment, on treatment day 4, and after a 2-week washout. (E) Serum glucagon in response to EOS. (F and G) Oral glucose tolerance (OGTT) (F) and OGTT area under the curve (AUC) (G) on treatment day 4. (H) Glucose-stimulated serum insulin pre-treatment, on treatment day 4, and after a 2-week washout. (I and J) Insulin tolerance test (ITT) (I) and ITT AUC (J) on treatment day 4. (K and L) Tissue-specific 3H-2-deoxy-D-glucose (10 μCi/mouse; K) uptake and cGMP content (L) on treatment day 5. DPM, disintegrations per minute; NS, non-significant. All data are presented as mean ± SEM.
Figure 2.
Figure 2.. Acute hepatic GABA-transaminase knockdown improves obesity-induced metabolic dysfunction
(A) GABA-T mRNA expression in liver, whole brain, and pancreas after 1 week of injections with a GABA-T targeted or scramble control antisense oligonucleotide (ASO) (12.5 mg/kg i.p. twice weekly) in high-fat-diet-induced obese mice. (B) Release of GABA (μmol/mg DNA) from hepatic slices. (C) Body weight during treatment. (D–F) Basal serum insulin (D), glucose (E), and glucose:insulin ratio (F). (G–K) OGTT (G), OGTT AUC (H), oral glucose-stimulated serum insulin (I), ITT (J), and ITT AUC (K). Number below bar denotes n per group. All data are presented as mean ± SEM.
Figure 3.
Figure 3.. 1 week of hepatic GABA-transaminase knockdown improves insulin sensitivity assessed by hyperinsulinemic euglycemic clamp
High-fat-diet-induced obese mice received 1 week of injections with a GABA-T targeted or scramble control ASO (12.5 mg/kg i.p. twice weekly) before hyperinsulinemic euglycemic clamps were performed. (A) Body weight the day of clamp procedures. (B and C) Blood glucose concentrations (B) and glucose infusion rate during the clamps (C). (D) Serum insulin concentrations before insulin infusion (basal) and during the clamp. (E and F) Endogenous glucose appearance (Ra) (E) and glucose disappearance (Rd) (F) before insulin infusion (basal) and during the clamp. (G) Tissue specific 14C-2-deoxyglucose uptake (PR, perirenal adipose tissue; WAT, white adipose tissue). Number below bar denotes n per group. All data are presented as mean ± SEM.
Figure 4.
Figure 4.. Obesity-induced hepatic GABA production increases phagic drive
Cumulative food intake and body mass during the first 2 weeks of GABA-T targeted or scramble control ASO injections (12.5 mg/kg i.p. twice weekly) in lean (A and B) and diet-induced obese (C–G) mice. Cumulative light cycle, dark cycle, and daily food intake (A) and cumulative body mass change (B) in lean mice are shown. Cumulative light cycle, dark cycle, and daily food intake (C) and cumulative body mass change (D) in obese mice are shown. Weekly cumulative food intake (E), cumulative body weight change (F), and body mass (G) during ASO treatment are shown. Body mass during chronic EOS treatment is shown (3 g/L in drinking water). All data are presented as mean ± SEM.
Figure 5.
Figure 5.. GABA-transaminase knockdown or inhibition decreases body mass and fat mass
Body composition in ASO-treated mice was assessed by dual-energy X-ray absorptiometry (DEXA) at the UCDavis Mouse Metabolic Phenotyping Center. Body composition in ethanolamine-O-sulfate (EOS)-treated mice was assessed by EchoMRI 900 at The University of Arizona. Change in body mass (A), fat mass (B), and lean mass (C) after 1 and 4 weeks of GABA-T targeted or scramble control ASO (12.5 mg/kg i.p. twice weekly) relative to pre-treatment body composition are shown. Body mass (D), fat mass (E), and lean mass (F) on day 0 and 7 of EOS treatment are shown (3 g/L in drinking water). All data are presented as mean ± SEM.
Figure 6.
Figure 6.. Associations between hepatic GABA system and glucoregulatory markers in people with obesity
Multivariate regressions, including intrahepatic triglyceride % (IHTG%), hepatic ABAT (GABA-T) mRNA, and the hepatic GABA transporter (SLC6A12) mRNA as explanatory variables for variations in serum insulin (A) or hepatic insulin sensitivity index (HISI) (B), ABAT and SLC6A12 mRNA (FPKMUQ; fragments per kilobase million reads upper quartile) were quantified by RNA sequencing (RNA-seq) from liver tissue. Single-nucleotide polymorphisms (SNPs) in the ABAT promoter are associated with a decreased risk of type 2 diabetes (T2D) (C). All data are presented as mean ± SEM.

References

    1. American Diabetes Association (2018). Economic costs of diabetes in the U.S. in 2017. Diabetes Care 41, 917–928. - PMC - PubMed
    1. Archer SL, Huang JM, Hampl V, Nelson DP, Shultz PJ, and Weir EK (1994). Nitric oxide and cGMP cause vasorelaxation by activation of a charybdotoxin-sensitive K channel by cGMP-dependent protein kinase. Proc. Natl. Acad. Sci. USA 91, 7583–7587. - PMC - PubMed
    1. Ayala JE, Bracy DP, Malabanan C, James FD, Ansari T, Fueger PT, McGuinness OP, and Wasserman DH (2011). Hyperinsulinemic-euglycemic clamps in conscious, unrestrained mice. J. Vis. Exp (57), 3188. - PMC - PubMed
    1. Centers for Disease Control and Prevention (2017). National Diabetes Statistics Report, 2017 (Centers for Disease Control and Prevention; ).
    1. Chang Y, Jung HS, Yun KE, Cho J, Cho YK, and Ryu S (2013). Cohort study of non-alcoholic fatty liver disease, NAFLD fibrosis score, and the risk of incident diabetes in a Korean population. Am. J. Gastroenterol 108, 1861–1868. - PubMed

Publication types

MeSH terms