. 2021 Jun 29;35(13):109298.
doi: 10.1016/j.celrep.2021.109298.

Hepatocyte membrane potential regulates serum insulin and insulin sensitivity by altering hepatic GABA release

Affiliations

Hepatocyte membrane potential regulates serum insulin and insulin sensitivity by altering hepatic GABA release

Caroline E Geisler et al. Cell Rep. .

Abstract

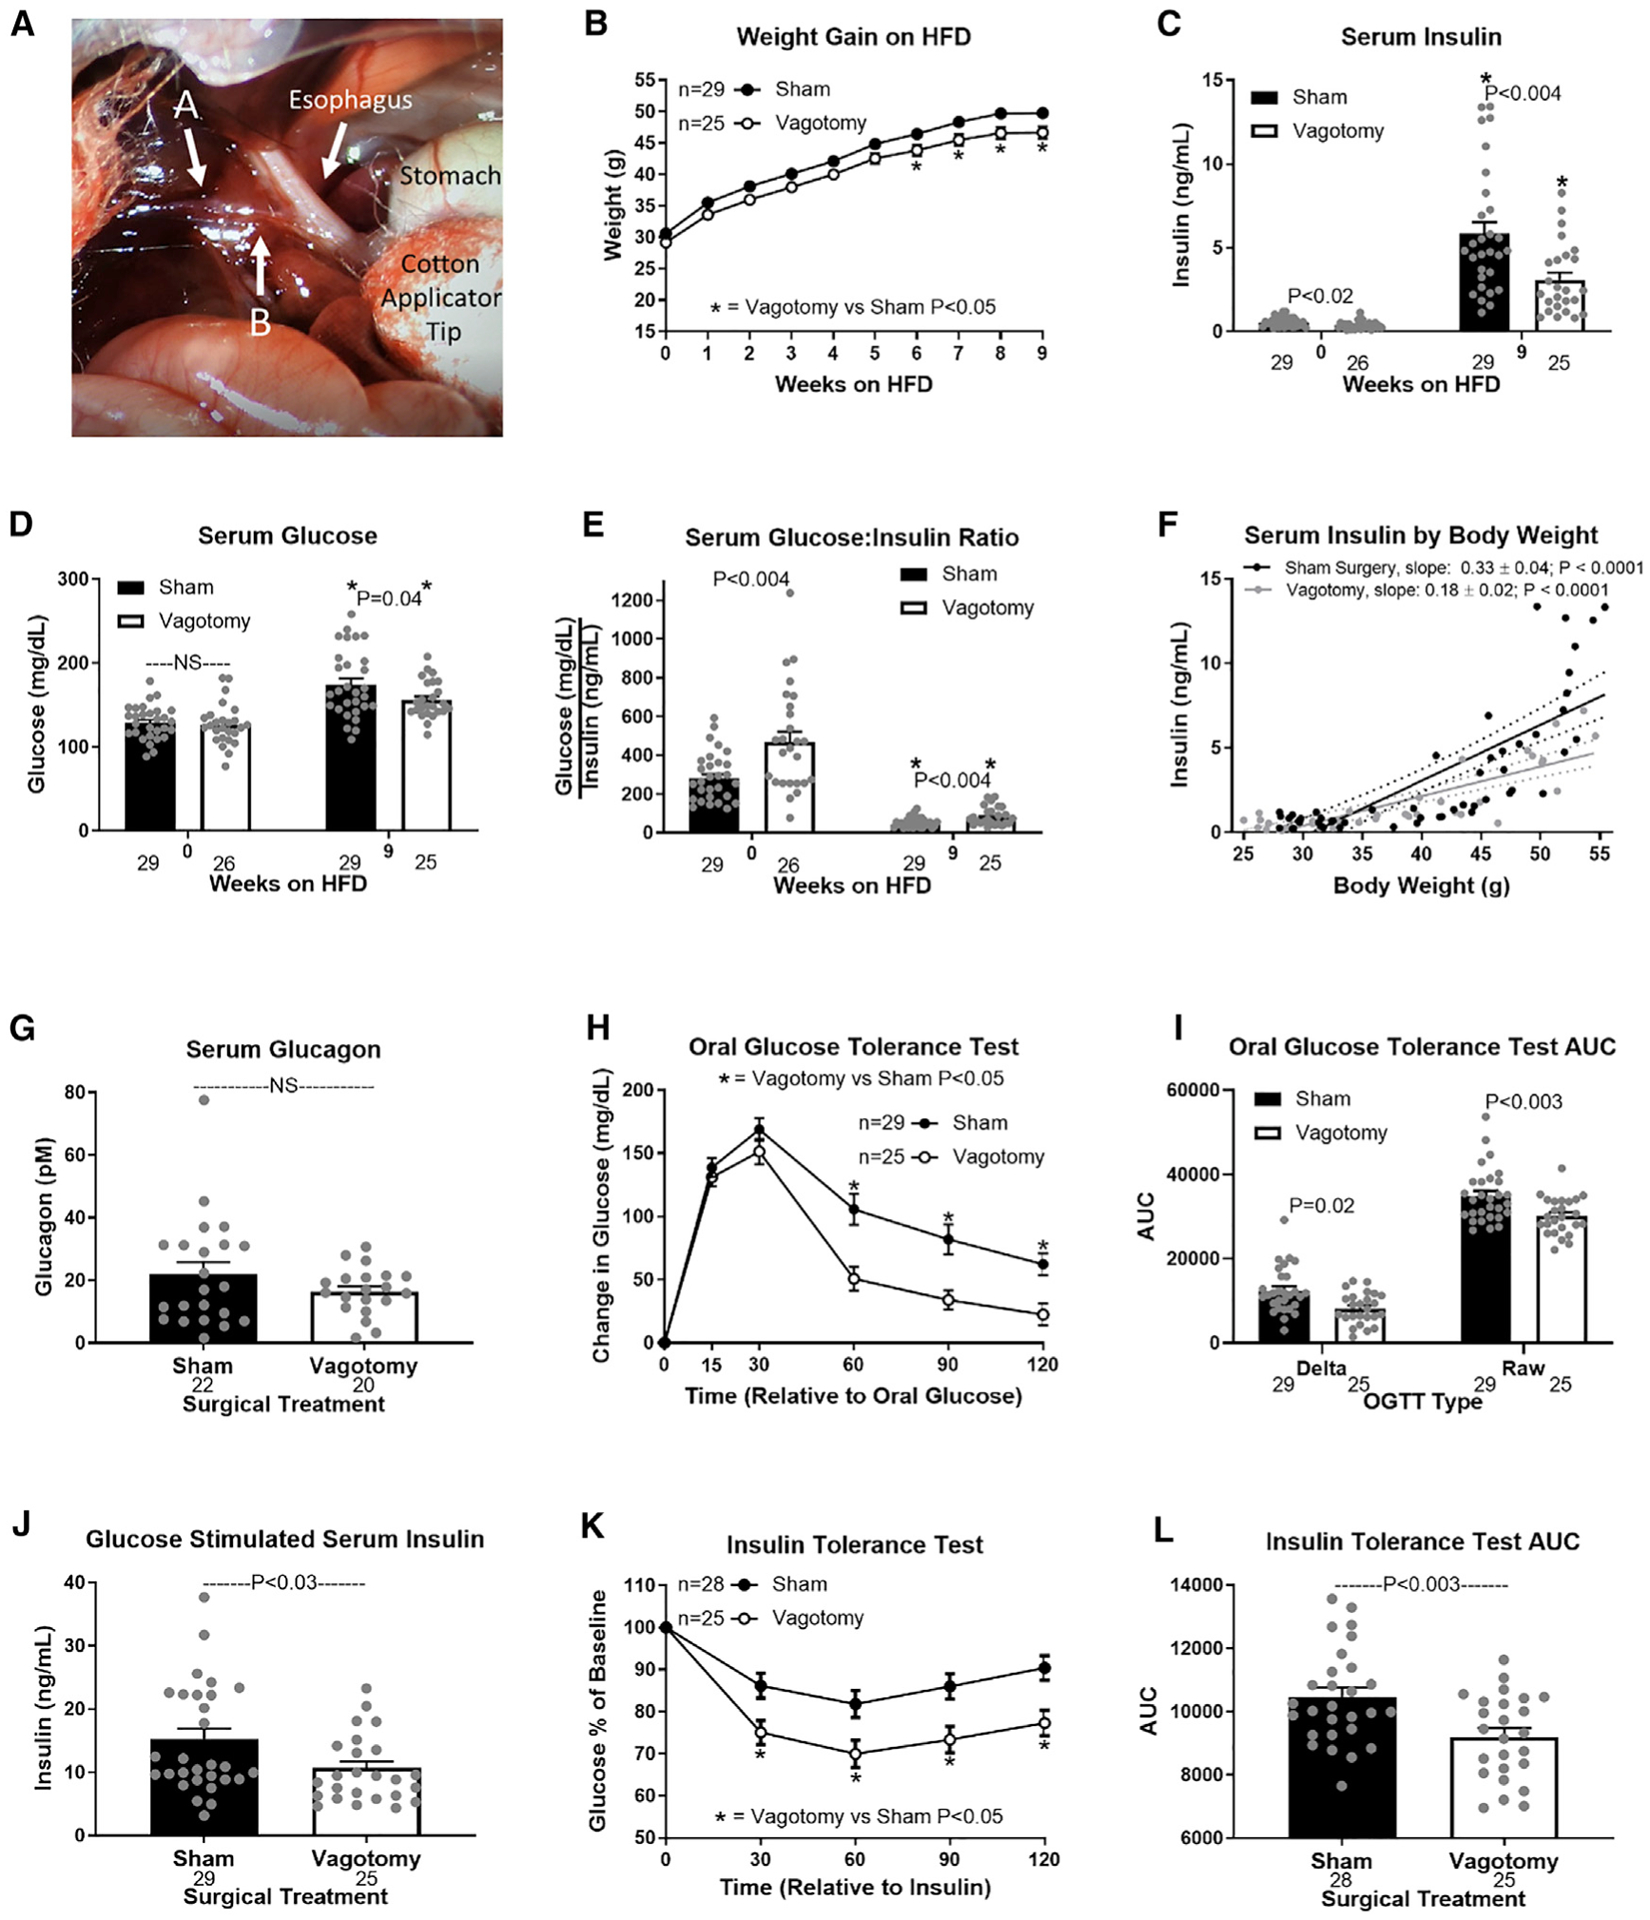
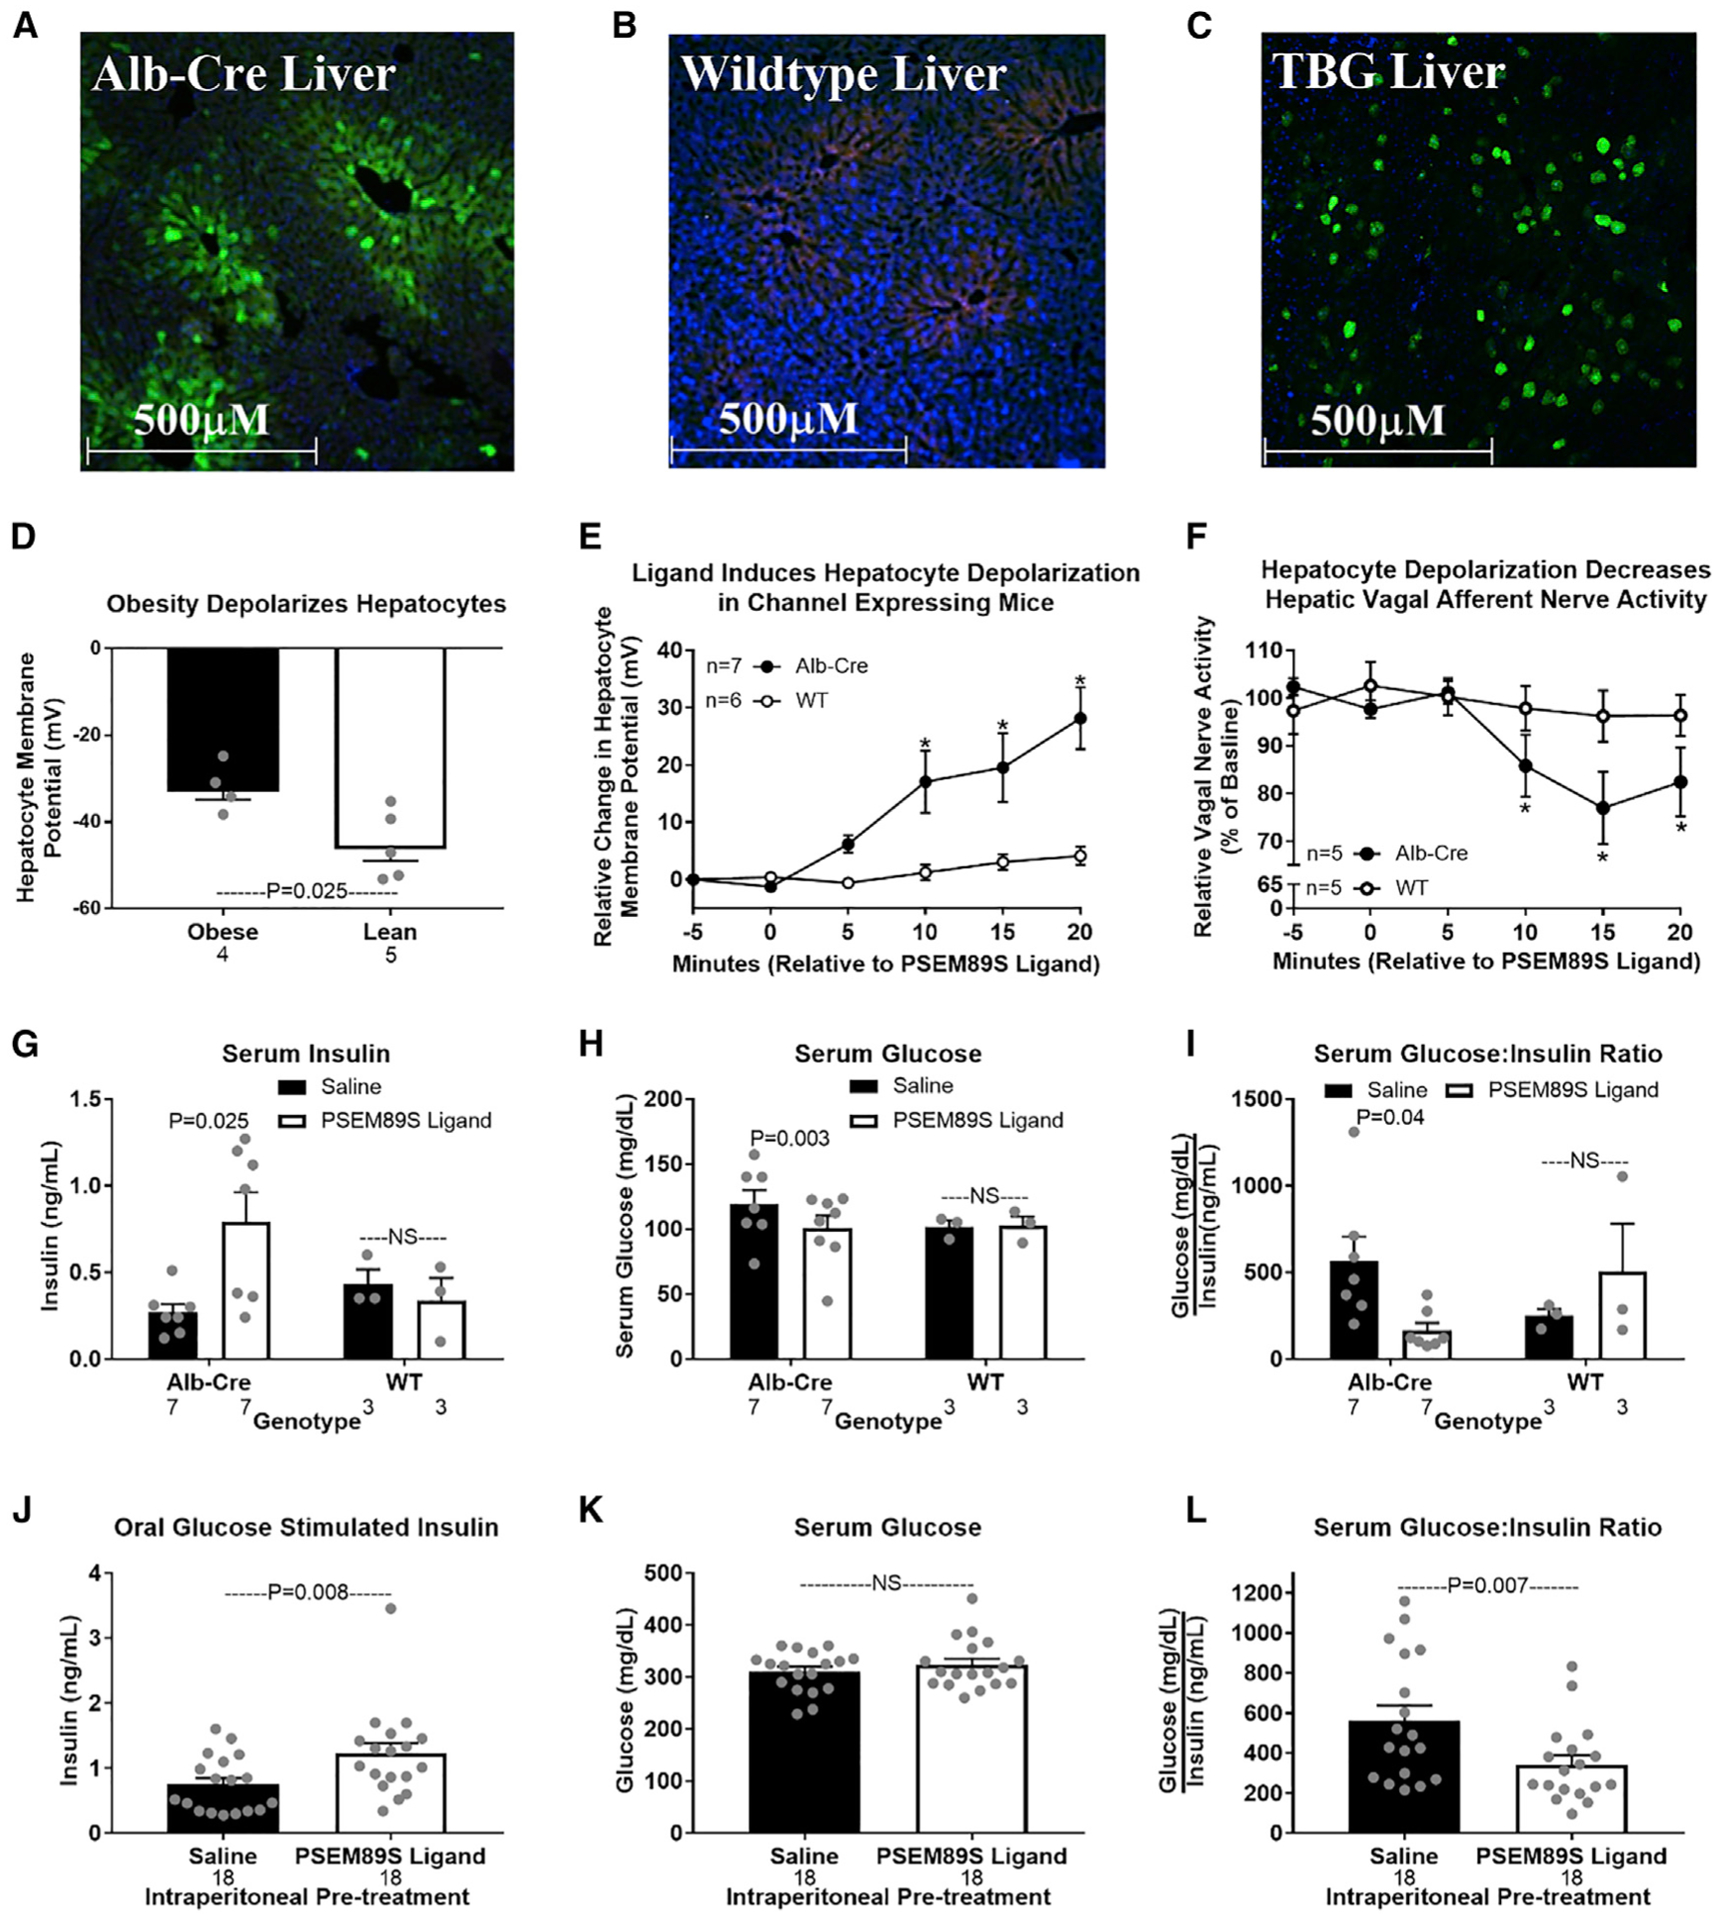
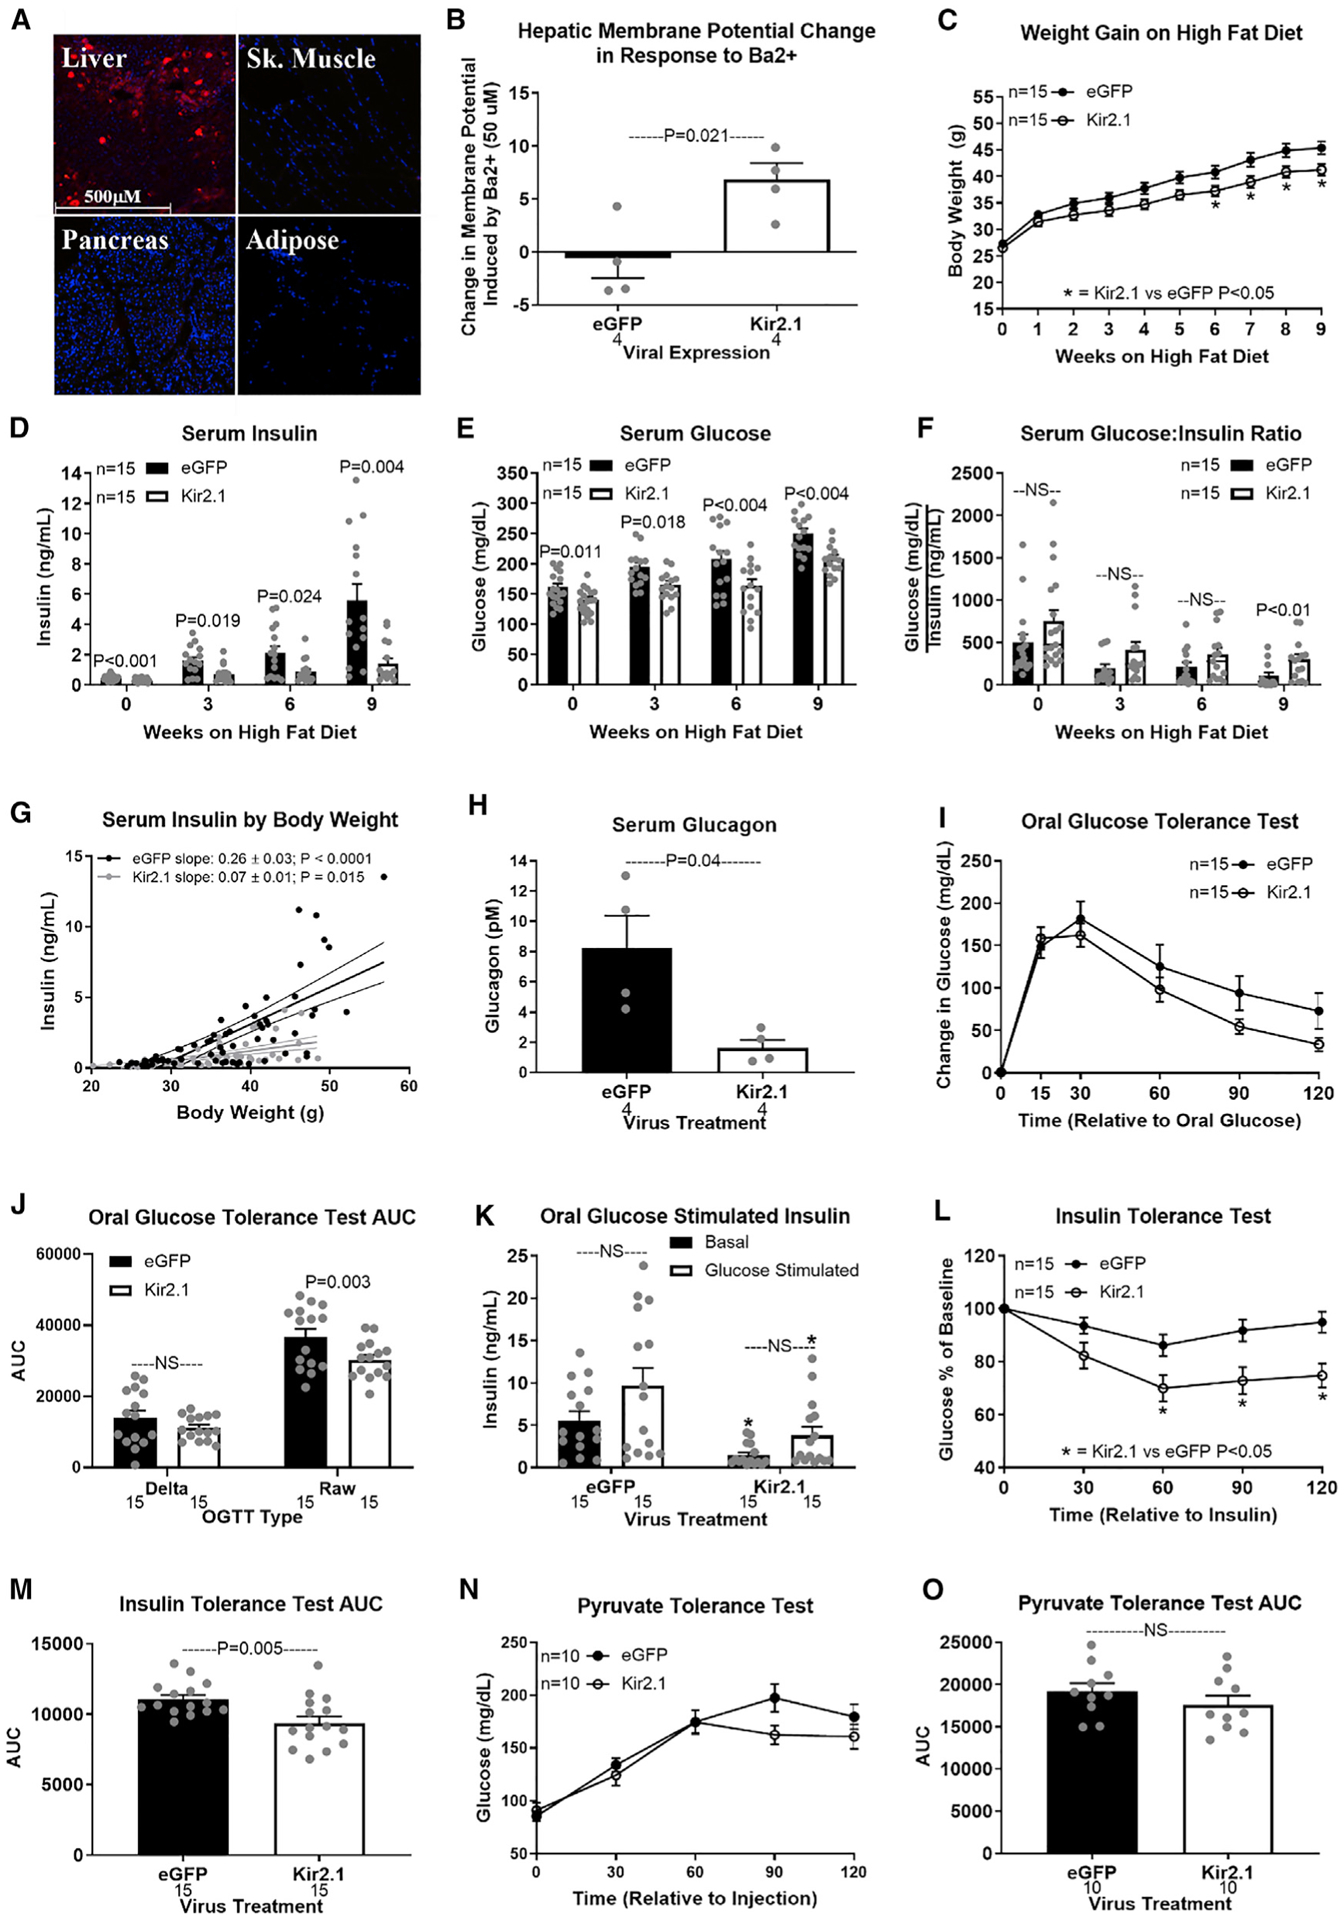
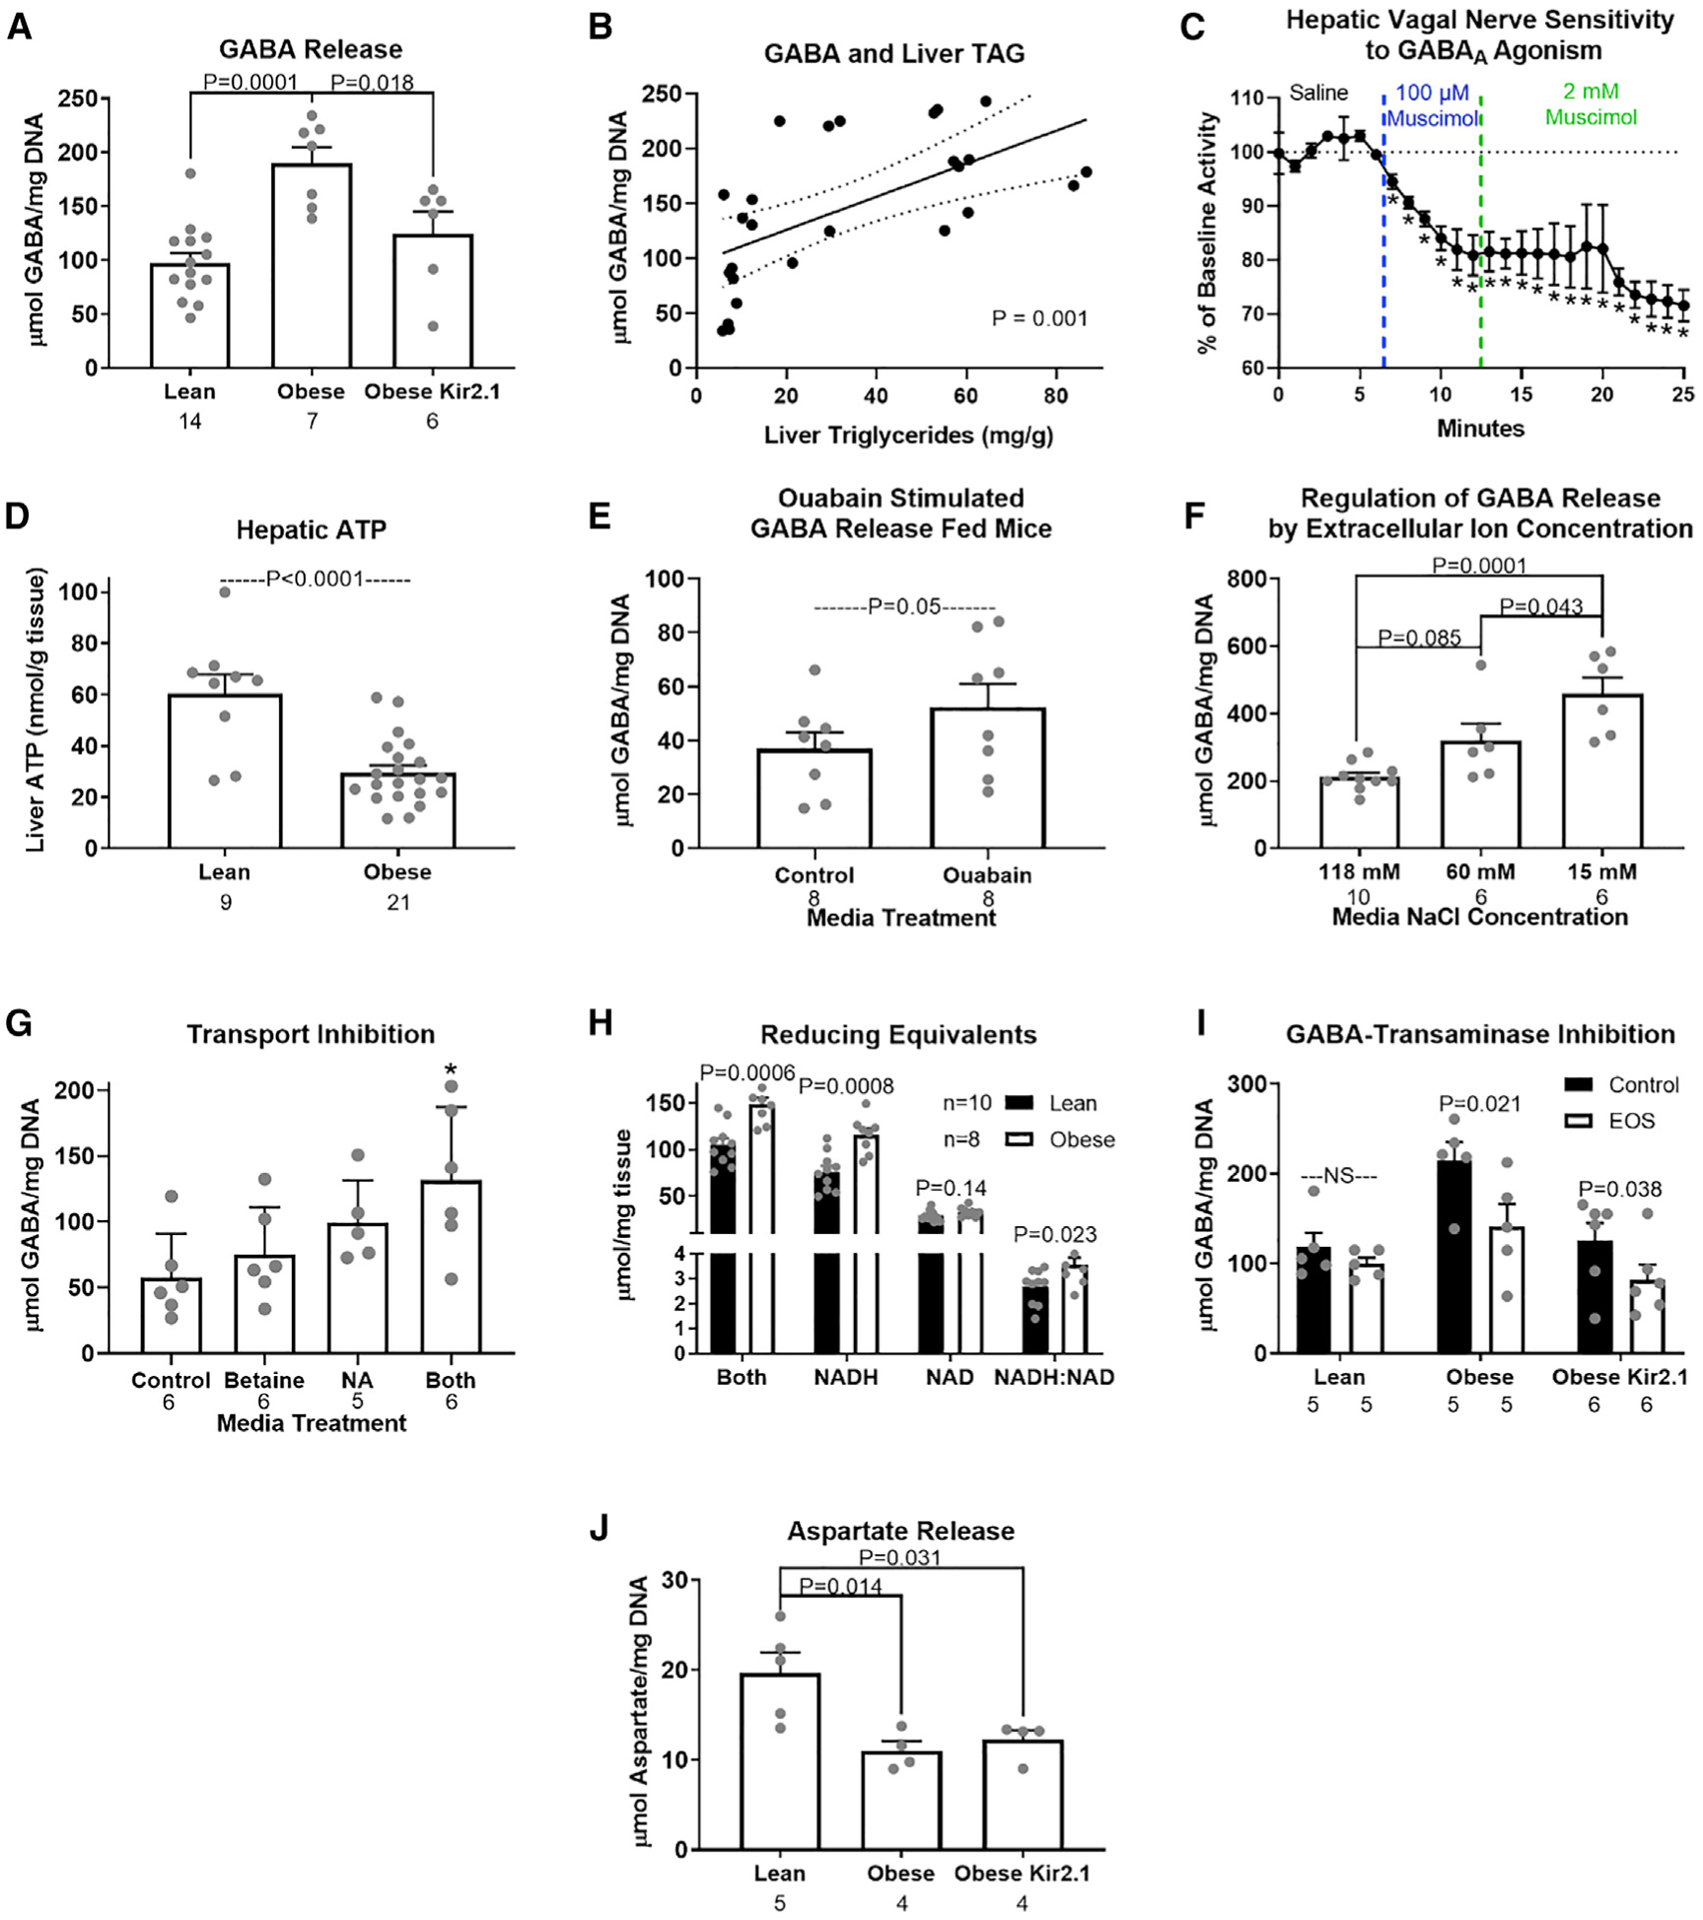
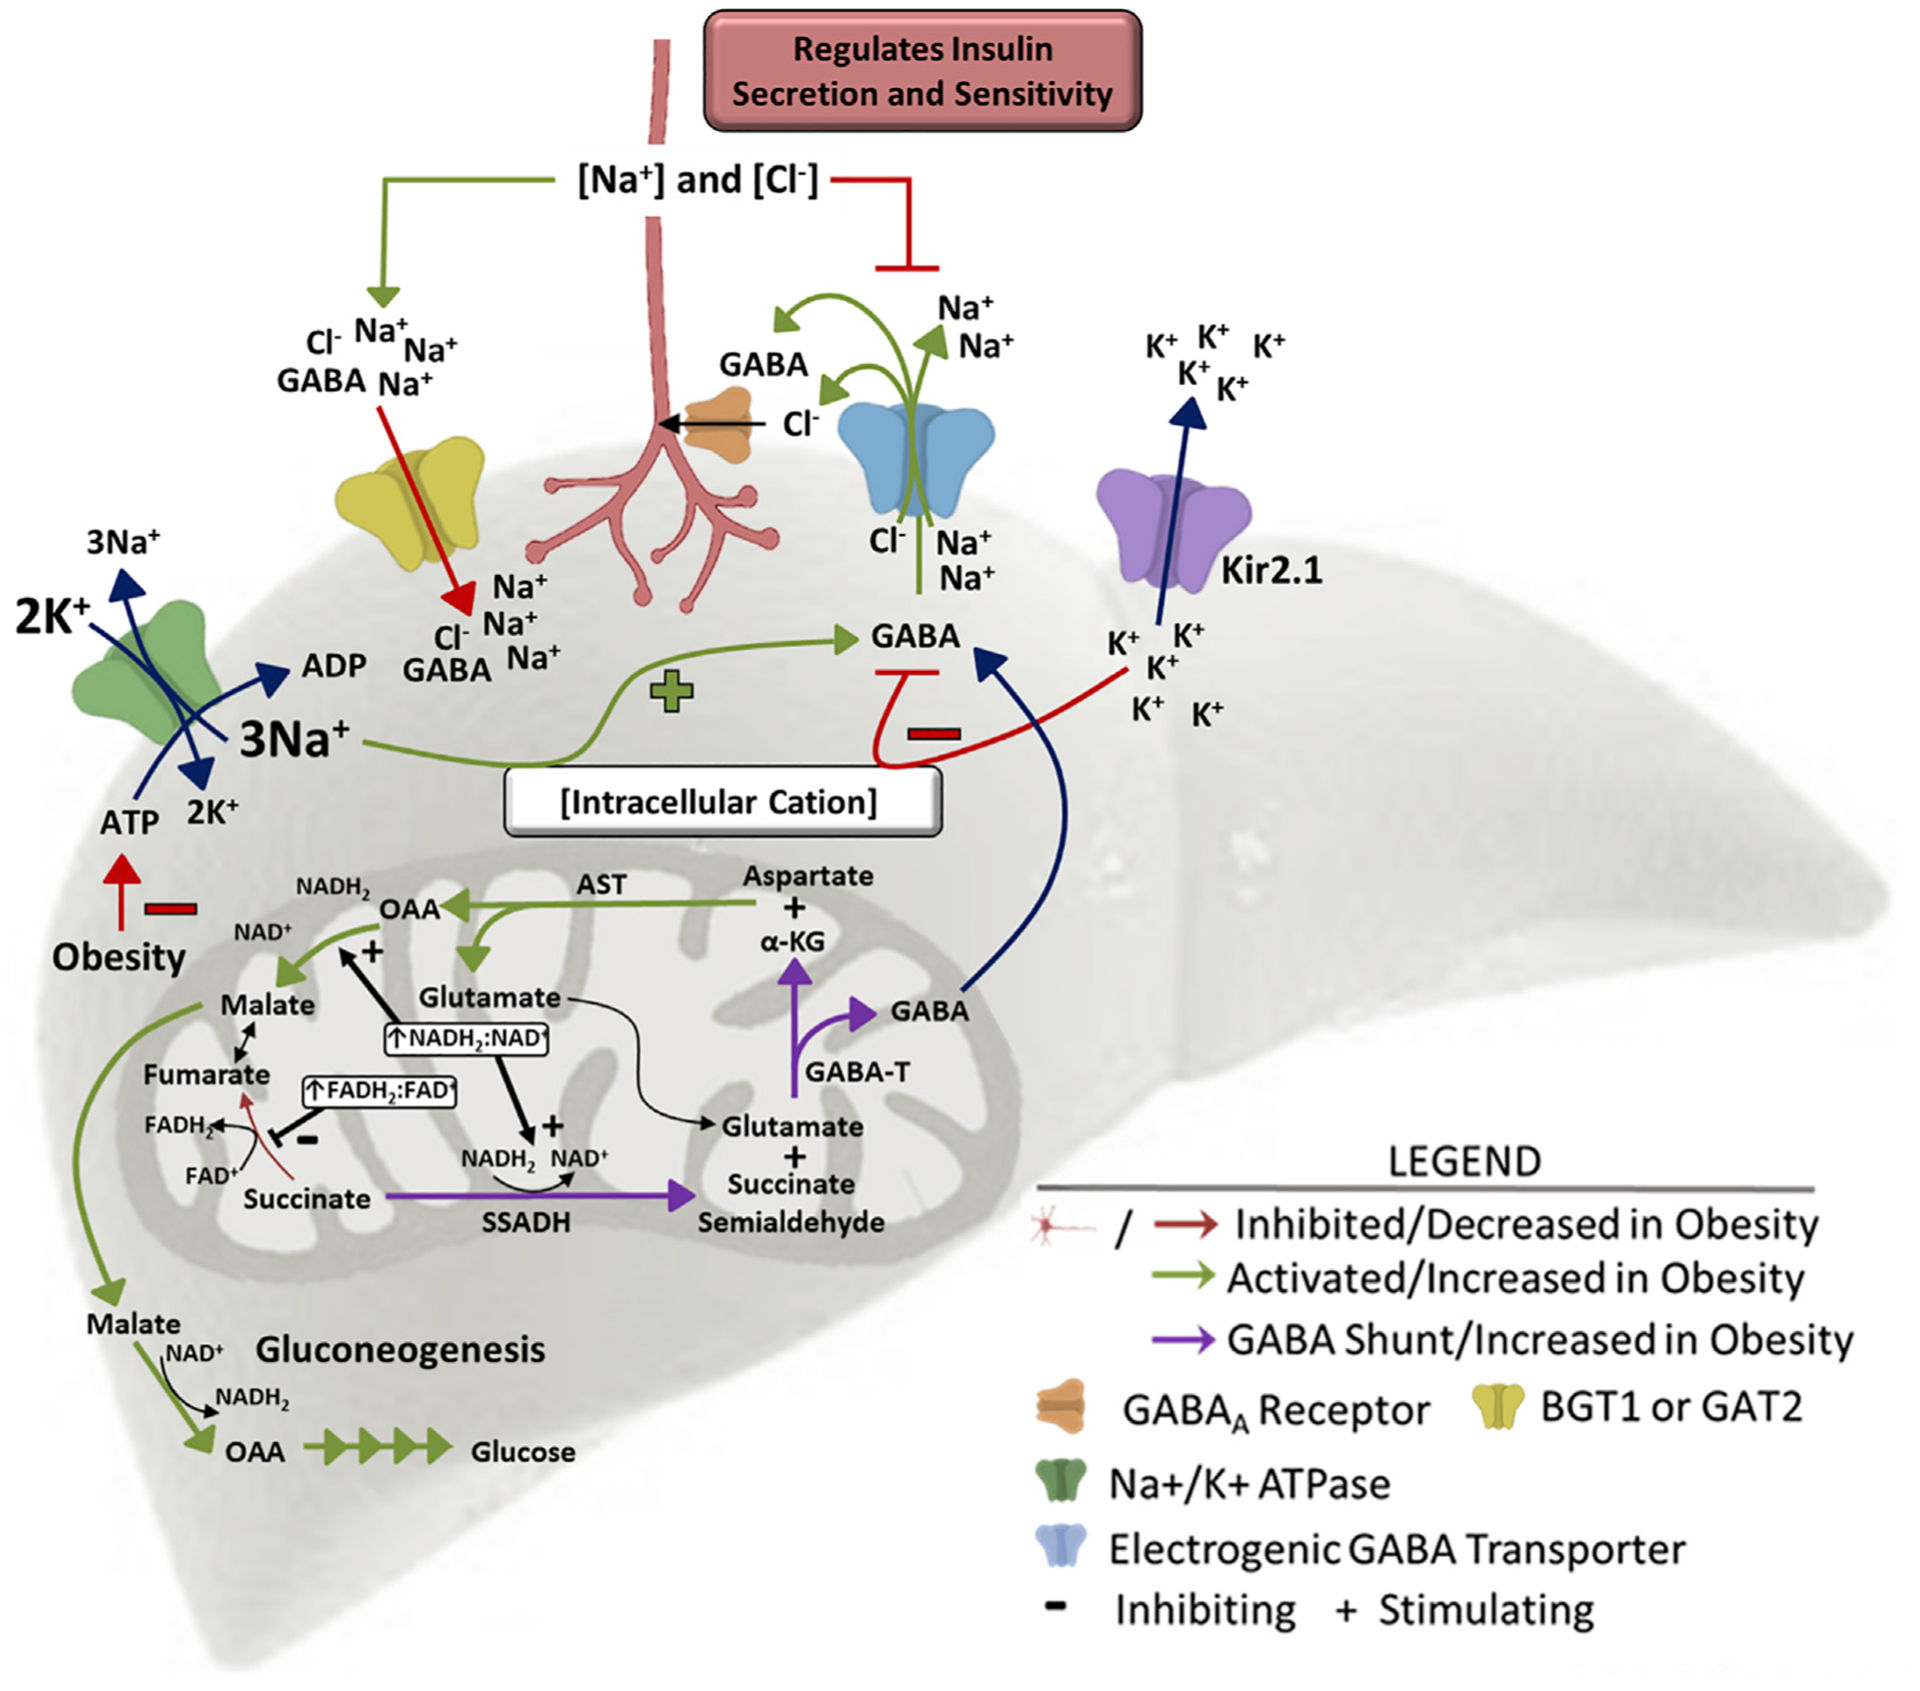
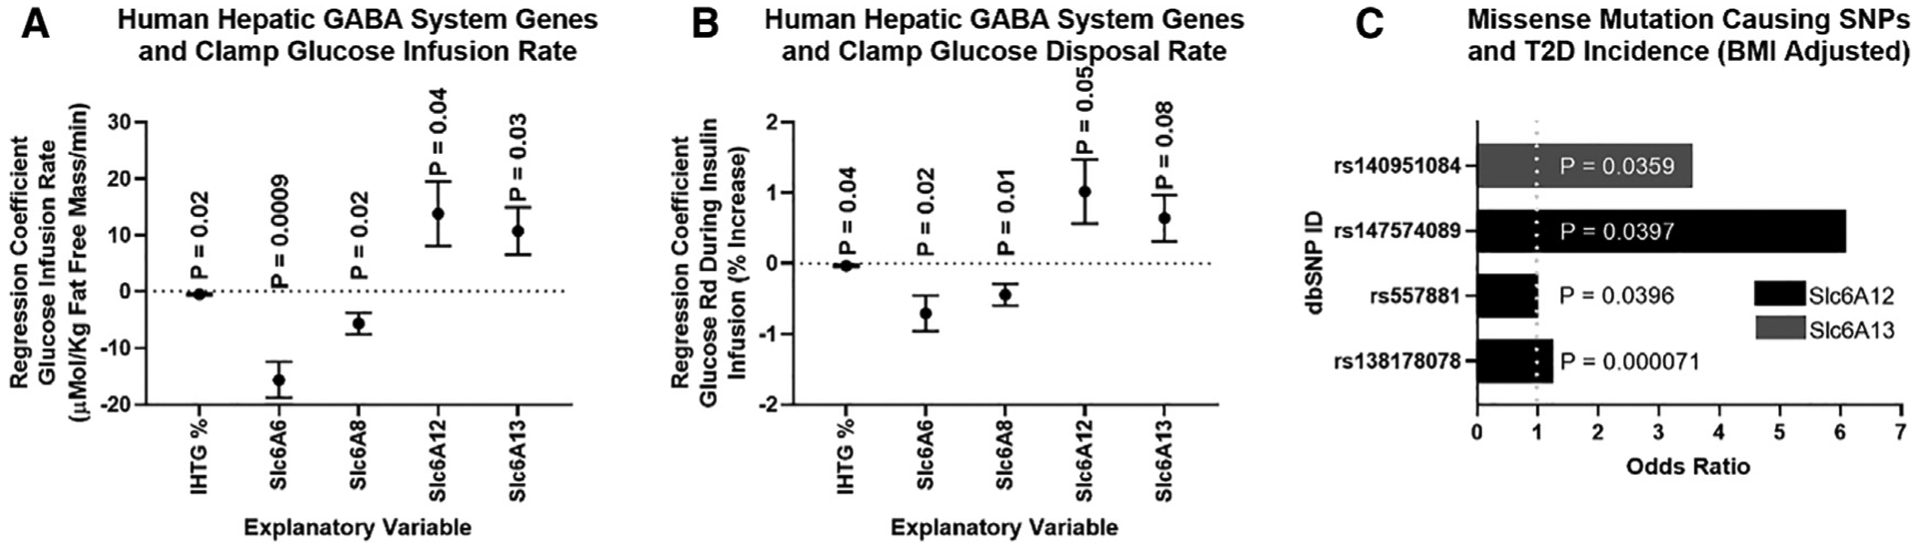
Hepatic lipid accumulation in obesity correlates with the severity of hyperinsulinemia and systemic insulin resistance. Obesity-induced hepatocellular lipid accumulation results in hepatocyte depolarization. We have established that hepatocyte depolarization depresses hepatic afferent vagal nerve firing, increases GABA release from liver slices, and causes hyperinsulinemia. Preventing hepatic GABA release or eliminating the ability of the liver to communicate to the hepatic vagal nerve ameliorates the hyperinsulinemia and insulin resistance associated with diet-induced obesity. In people with obesity, hepatic expression of GABA transporters is associated with glucose infusion and disposal rates during a hyperinsulinemic euglycemic clamp. Single-nucleotide polymorphisms in hepatic GABA re-uptake transporters are associated with an increased incidence of type 2 diabetes mellitus. Herein, we identify GABA as a neuro-hepatokine that is dysregulated in obesity and whose release can be manipulated to mute or exacerbate the glucoregulatory dysfunction common to obesity.

Keywords: GABA; GABA transporter; GABA-transaminase; NAFLD; Type 2 diabetes; hyperinsulinemia; insulin resistance; membrane potential; obesity.


Conflict of interest statement

Declaration of interests The results presented in this paper have resulted in patent cooperation treaty Application No. 62/511,753 and 62/647,468: METHODS AND COMPOSITIONS FOR REGULATING GLUCOSE HOMEOSTASIS, which has been licensed by Livendocrine, LLC founded by Benjamin Renquist.

Figures

Figure 1.
Figure 1.. Hepatic vagotomy protects against diet-induced hyperinsulinemia
(A) Visual operative field for hepatic vagotomy surgeries. Arrow A indicates the hepatic branch of the vagus, which was severed to vagotomize mice. Arrow A also indicates the electrode placement to record firing activity of the hepatic vagal afferent nerve (Figure 2F). Arrow B indicates where the hepatic vagal nerve was cut after securing the electrode to eliminate vagal efferent activity (Figure 2F). (B–E) Effects of hepatic vagotomy on high-fat-diet (HFD)-induced weight gain (B), serum insulin (C), glucose (D), and glucose/insulin ratio (E) at 0 and 9 weeks. (C–E) Asterisks denote significance (*p < 0.05) between bars of the same color. (F) Regression of body weight and serum insulin concentrations during HFD feeding in sham and vagotomized mice. (G–L) Effect of hepatic vagotomy after 9 weeks of HFD feeding on serum glucagon (G), oral glucose tolerance (OGTT; H), OGTT area under the curve (AUC; I), oral glucose-stimulated serum insulin (J), insulin tolerance (ITT; K), and ITT AUC (L). Number below bar denotes n per group. All data are presented as mean ± SEM. NS, non-significant.
Figure 2.
Figure 2.. Acute hepatocyte depolarization depresses hepatic vagal afferent nerve activity and elevates serum insulin
Immunohistochemical validation of liver-specific viral-induced PSEM89S ligand-gated depolarizing channel. (A–C) Liver from an Alb-Cre-expressing mouse (A) and a WT mouse (B) tail-vein injected with an AAV8 encoding the PSEM89S ligand-activated depolarizing channel and green fluorescent protein (GFP) whose expression is dependent on cre-recombinase. Original magnification, 10×. (D) Liver from a WT mouse tail-vein injected with an AAV8 encoding the PSEM89S ligand-activated depolarizing channel and GFP whose expression is driven by the liver-specific thyroxine binding globulin (TBG) promoter. Green represents GFP, blue represents DAPI (nucleus), and red represents background fluorescence. Hepatocyte membrane potential in lean and obese mice. (E–I) Data from Alb-Cre and WT mice tail-vein injected with an AAV8 encoding liver-specific expression of the PSEM89S ligand-activated depolarizing channel whose expression is dependent on cre-recombinase. PSEM89S ligand (30 μM) induced change in hepatocyte membrane potential (E). PSEM89S ligand induced relative change in hepatic vagal afferent nerve activity (F). Data in (F) were collected concurrently with data in (E). Serum insulin (G), glucose (H), and glucose/insulin ratio (I) in Alb-Cre and WT virus-injected mice 15 min after saline or PSEM89S ligand (30 mg/kg) administration. (J–L) Data from WT mice tail-vein injected with an AAV8 encoding the PSEM89S ligand-activated depolarizing channel whose liver-specific expression is driven by the thyroxine binding globulin (TBG) promoter. Serum insulin (J), glucose (K), and glucose/insulin ratio (L) in channel-expressing mice injected with either saline or PSEM89S ligand (30 mg/kg) 10 min prior to an oral glucose load (2.5 g/kg). Asterisk denotes significance (*p < 0.05) between groups within a time point. Number below bar denotes n per group. All data are presented as mean ± SEM. Alb-Cre, albumin-cre; WT, wild-type.
Figure 3.
Figure 3.. Hepatic hyperpolarization protects against diet-induced metabolic dysfunction
(A and B) Liver-specific expression of the Kir2.1 hyperpolarizing channel in a WT mouse (A; original magnification, 10×). Fluorescent imaging for red indicates tdTomato and blue indicates DAPI (nucleus). Barium (BaCl; 50 μM)-induced change in hepatocyte membrane potential in Kir2.1 and EGFP (control)-expressing mice (B). (C–F) Hepatic Kir2.1 expression effect on HFD-induced weight gain (C), serum insulin (D), glucose (E), and glucose/insulin ratio (F) at 0, 3, 6, and 9 weeks. (G) Regression of body weight and serum insulin concentrations during HFD feeding in Kir2.1 and EGFP mice. (H–O) Effect of hepatic Kir2.1 expression after 9 weeks of HFD feeding on serum glucagon (H), oral glucose tolerance (OGTT; I), OGTT AUC (J), oral glucose-stimulated serum insulin (K; asterisk denotes significance [*p < 0.05] between bars of the same color), ITT (L), ITT AUC (M), pyruvate tolerance (PTT; N), and PTT AUC (O). Number below bar denotes n per group. All data are presented as mean ± SEM.
Figure 4.
Figure 4.. Hepatic slice GABA release
(A–J) Release of GABA (μmol/mg DNA) from hepatic slices (A); relationship between hepatic GABA release and liver triglyceride concentration (B); hepatic vagal nerve activity in response to the GABAA receptor agonist, muscimol (C); hepatic ATP concentration (nmol/g tissue; D); release of GABA in slices incubated with the Na+/K+-ATPase inhibitor, Ouabain (1 mM; E); release of GABA (μmol/mg DNA) from hepatic slices in normal (118 mM), reduced (60 mM), and low (15 mM) NaCl media (F); GABA media concentrations in slices treated with the BGT1 inhibitor (betaine, 1 mM), the GAT2 inhibitor (nipecotic acid [NA], 1 mM), or both (G); reducing equivalent measures from livers of lean and obese mice (H), GABA media concentrations in response to inhibition of GABA-transaminase (EOS, 5.3 mM) in liver slices (I); and aspartate media concentrations in lean, obese, and obese Kir2.1-expressing mice (J). Asterisk indicates difference from control (*p < 0.05). Number below bar denotes n per group. All data are presented as mean ± SEM.
Figure 5.
Figure 5.. Working model of hepatic lipid accumulation-induced changes in hepatic metabolism and resulting changes in hepatic vagal nerve signaling to affect insulin secretion and sensitivity
High levels of β-oxidation in the obese liver increase the mitochondrial NADH2:NAD+ and FADH2:FAD+ ratios driving succinate to succinate semialdehyde, generating substrate for GABA-transaminase. GABA-transaminase produces GABA and α-ketoglutarate, a substrate for aspartate aminotransferase. Increased gluconeogenic flux in obesity drives the mitochondrial export of OAA as malate. The increased GABA release is encouraged by the depolarized membrane in obesity. GABA is co-transported with 3 Na+ and 1 Cl ion, so an increase in intracellular cation concentration (hepatocyte depolarization) encourages GABA export, while a decrease in intracellular cation concentration (hepatocyte hyperpolarization) limits GABA export. Kir2.1 expression induces hepatic K+ efflux and hyperpolarization, inhibiting GABA export. Obesity decreases hepatic ATP concentrations, impairing activity of the Na+/K+-ATPase pump and increasing intracellular Na+ concentrations, driving GABA export. This mechanism explains how hepatic lipid accumulation increases hepatic GABA release. AST, aspartate aminotransferase; GABA-T, GABA-transaminase; α-KG, α-ketoglutarate; OAA, oxaloacetate; SSADH, succinate semialdehyde dehydrogenase.
Figure 6.
Figure 6.. Immunohistochemical evidence of GABAA receptor expressing vagal afferent innervation in the liver
(A) Double labeling for the vagal afferent marker calretinin (green) and GABAA receptors (red; arrows indicate co-staining). (B) Enlarged view of area within the white box in (A) (white arrows indicate co-staining, and yellow arrows indicate GABAA-positive staining immediately adjacent to calretinin-positive fibers). (C and D) Immunohistochemical staining for the alternative vagal afferent marker calcitonin gene-related peptide (CGRP, green) and GABAA receptors (red, D; arrows indicate co-staining). Enlarged view of area within the white box in (C) (D; white arrows indicate co-staining, and yellow arrows indicate GABAA-positive staining immediately adjacent to CGRP-positive fibers). Blue represents DAPI (nucleus). Original magnification, 10×. BV, blood vessel.
Figure 7.
Figure 7.. Associations between hepatic GABA system and glucoregulatory markers in obese humans
(A and B) Multivariate regressions including intrahepatic triglyceride % (IHTG%) and the mRNA for the hepatic GABA transporters (Slc6A6, Slc6A8, Slc6A12, and Scl6A12) as explanatory variables for variations in glucose infusion rate during a hyperinsulinemic euglycemic clamp (μMol/kg fat-free mass/min) (A), and the glucose disposal rate calculated during a hyperinsulinemic-euglycemic clamp (Glucose Rd, % increase) (B). mRNA (fragments per kilobase of transcript per million mapped reads [FPKMs]) was quantified by RNA sequencing (RNA-seq) from liver tissue. (C) Single-nucleotide polymorphisms (SNPs) that cause missense mutations in Slc6A12 or Slc6A13 are associated with an increased incidence of type 2 diabetes (T2D) adjusted for body mass index (BMI). Regression data are presented as mean ± SEM.

References

    1. Ahrén B, and Lundquist I (1982). Modulation of basal insulin secretion in the obese, hyperglycemic mouse. Metabolism 31, 172–179. - PubMed
    1. Balbo SL, Ribeiro RA, Mendes MC, Lubaczeuski C, Maller AC, Carneiro EM, and Bonfleur ML (2016). Vagotomy diminishes obesity in cafeteria rats by decreasing cholinergic potentiation of insulin release. J. Physiol. Biochem 72, 625–633. - PubMed
    1. Ballantyne LL, Sin YY, Al-Dirbashi OY, Li X, Hurlbut DJ, and Funk CD (2016). Liver-specific knockout of arginase-1 leads to a profound phenotype similar to inducible whole body arginase-1 deficiency. Mol. Genet. Metab. Rep 9, 54–60. - PMC - PubMed
    1. Bernal-Mizrachi C, Xiaozhong L, Yin L, Knutsen RH, Howard MJ, Arends JJ, Desantis P, Coleman T, and Semenkovich CF (2007). An afferent vagal nerve pathway links hepatic PPARalpha activation to glucocorticoid-induced insulin resistance and hypertension. Cell Metab. 5, 91–102. - PMC - PubMed
    1. Berthoud HR (2004). Anatomy and function of sensory hepatic nerves. Anat. Rec. A Discov. Mol. Cell. Evol. Biol 280, 827–835. - PubMed

Publication types